Bhateliya Airbnb Market Analysis 2026: Short Term Rental Data & Vacation Rental Statistics in Uttarakhand, India
Is Airbnb profitable in Bhateliya in 2026? Explore comprehensive Airbnb analytics for Bhateliya, Uttarakhand, India to uncover income potential. This 2026 STR market report for Bhateliya, based on AirROI data from February 2025 to January 2026, reveals key trends in the niche market of 42 active listings.
Whether you're considering an Airbnb investment in Bhateliya, optimizing your existing vacation rental, or exploring rental arbitrage opportunities, understanding the Bhateliya Airbnb data is crucial. Leveraging the low regulation environment is key to maximizing your short term rental income potential. Let's dive into the specifics.
Key Bhateliya Airbnb Performance Metrics Overview
Monthly Airbnb Revenue Variations & Income Potential in Bhateliya (2026)
Understanding the monthly revenue variations for Airbnb listings in Bhateliya is key to maximizing your short term rental income potential. Seasonality significantly impacts earnings. Our analysis, based on data from the past 12 months, shows that the peak revenue month for STRs in Bhateliya is typically June, while September often presents the lowest earnings, highlighting opportunities for strategic pricing adjustments during shoulder and low seasons. Explore the typical Airbnb income in Bhateliya across different performance tiers:
- Best-in-class properties (Top 10%) achieve $1,793+ monthly, often utilizing dynamic pricing and superior guest experiences.
- Strong performing properties (Top 25%) earn $889 or more, indicating effective management and desirable locations/amenities.
- Typical properties (Median) generate around $478 per month, representing the average market performance.
- Entry-level properties (Bottom 25%) see earnings around $227, often with potential for optimization.
Average Monthly Airbnb Earnings Trend in Bhateliya
Bhateliya Airbnb Occupancy Rate Trends (2026)
Maximize your bookings by understanding the Bhateliya STR occupancy trends. Seasonal demand shifts significantly influence how often properties are booked. Typically, Junesees the highest demand (peak season occupancy), while September experiences the lowest (low season). Effective strategies, like adjusting minimum stays or offering promotions, can boost occupancy during slower periods. Here's how different property tiers perform in Bhateliya:
- Best-in-class properties (Top 10%) achieve 46%+ occupancy, indicating high desirability and potentially optimized availability.
- Strong performing properties (Top 25%) maintain 30% or higher occupancy, suggesting good market fit and guest satisfaction.
- Typical properties (Median) have an occupancy rate around 16%.
- Entry-level properties (Bottom 25%) average 9% occupancy, potentially facing higher vacancy.
Average Monthly Occupancy Rate Trend in Bhateliya
Average Daily Rate (ADR) Airbnb Trends in Bhateliya (2026)
Effective short term rental pricing strategy in Bhateliya involves understanding monthly ADR fluctuations. The Average Daily Rate (ADR) for Airbnb in Bhateliya typically peaks in June and dips lowest during September. Leveraging Airbnb dynamic pricing tools or strategies based on this seasonality can significantly boost revenue. Here's a look at the typical nightly rates achieved:
- Best-in-class properties (Top 10%) command rates of $213+ per night, often due to premium features or locations.
- Strong performing properties (Top 25%) achieve nightly rates of $127 or more.
- Typical properties (Median) charge around $78 per night.
- Entry-level properties (Bottom 25%) earn around $46 per night.
Average Daily Rate (ADR) Trend by Month in Bhateliya
Get Live Bhateliya Market Intelligence 👇

Explore Real-time Analytics
Airbnb Seasonality Analysis & Trends in Bhateliya (2026)
Peak Season (June, March, May)
- Revenue averages $1,177 per month
- Occupancy rates average 27.6%
- Daily rates average $119
Shoulder Season
- Revenue averages $731 per month
- Occupancy maintains around 21.7%
- Daily rates hold near $111
Low Season (February, August, September)
- Revenue drops to average $407 per month
- Occupancy decreases to average 15.1%
- Daily rates adjust to average $110
Seasonality Insights for Bhateliya
- The Airbnb seasonality in Bhateliya shows highly seasonal trends requiring careful strategy. While the sections above show seasonal averages, it's also insightful to look at the extremes:
- During the high season, the absolute peak month showcases Bhateliya's highest earning potential, with monthly revenues capable of climbing to $1,231, occupancy reaching a high of 29.7%, and ADRs peaking at $125.
- Conversely, the slowest single month of the year, typically falling within the low season, marks the market's lowest point. In this month, revenue might dip to $326, occupancy could drop to 11.5%, and ADRs may adjust down to $105.
- Understanding both the seasonal averages and these monthly peaks and troughs in revenue, occupancy, and ADR is crucial for maximizing your Airbnb profit potential in Bhateliya.
Seasonal Strategies for Maximizing Profit
- Peak Season: Maximize revenue through premium pricing and potentially longer minimum stays. Ensure high availability.
- Low Season: Offer competitive pricing, special promotions (e.g., extended stay discounts), and flexible cancellation policies. Target off-season travelers like remote workers or budget-conscious guests.
- Shoulder Seasons: Implement dynamic pricing that balances peak and low rates. Target weekend travelers or specific events. Offer slightly more flexible terms than peak season.
- Regularly analyze your own performance against these Bhateliya seasonality benchmarks and adjust your pricing and availability strategy accordingly.
Best Areas for Airbnb Investment in Bhateliya (2026)
Exploring the top neighborhoods for short-term rentals in Bhateliya? This section highlights key areas, outlining why they are attractive for hosts and guests, along with notable local attractions. Consider these locations based on your target guest profile and investment strategy.
| Neighborhood / Area | Why Host Here? (Target Guests & Appeal) | Key Attractions & Landmarks |
|---|---|---|
| Nainital | Iconic hill station known for its scenic lake and serene environment. A popular tourist destination, especially for families and honeymooners, with plenty of outdoor activities. | Naini Lake, Naina Devi Temple, Snow View Point, Tiffin Top, Dorothy's Seat, Eco Cave Gardens |
| Ranikhet | Charming hill station with lush meadows and beautiful views of the Himalayas. Ideal for those seeking peace and nature, attracting tourists and nature lovers. | Chaubatia Gardens, Haidakhan Babaji Temple, Mankameshwar Temple, Golf Course, Ranikhet Market, Jhula Devi Temple |
| Mukteshwar | Quaint village known for its breathtaking views and adventure sports. It attracts trekkers and those looking for a tranquil retreat. | Mukteshwar Dham, Chauli Ki Jali, Bhalu Gaad Waterfall, Mukteshwar Inspection Bungalow, Agneya Baba Temple, Kilmora Shop |
| Almora | Rich in culture and history, Almora offers a glimpse into traditional Kumaoni life. A great option for cultural tourism and nature explorers. | Kasaar Sangam Khushi, Chitai Golu Devta Temple, Binsar Wildlife Sanctuary, Almora Fort, Jageshwar, Kasar Devi Temple |
| Bhikiasain | A peaceful location surrounded by pine trees and hills, perfect for those looking to escape to nature and enjoy tranquility. | Local temples, Scenic viewpoints, Hiking trails, Village walks, Nature photography spots, Cultural experiences with locals |
| Kausani | Known as the 'Switzerland of India', Kausani offers mesmerizing views of the Himalayas and attracts visitors looking for a serene experience. | Anasakti Ashram, Viewpoint of Trisul and Nanda Devi, Baijnath Temple, Local tea estates, Kausani Tea Factory, Adventure activities like trekking |
| Bhimtal | Beautiful lake town with stunning natural surroundings. It serves as a quieter alternative to Nainital, suitable for families and couples. | Bhimtal Lake, Bhimeshwara Temple, Aquarium, Hiking trails, Kayaking, Boat rides |
| Munsiyari | A picturesque hill station, Munsiyari is known for its breathtaking views of the Panchachuli peaks, attracting adventure seekers and nature lovers alike. | Munsiyari Village, Birthi Falls, Khaliya Top Trek, Munsiyari Glacier, Thamri Kund, Local cultural experiences |
Understanding Airbnb License Requirements & STR Laws in Bhateliya (2026)
While Bhateliya, Uttarakhand, India currently shows low STR regulations, specific Airbnb license requirements might still exist or change. Always verify the latest short term rental regulations and Airbnb license requirements directly with local government authorities for Bhateliya to ensure full compliance before hosting.
(Source: AirROI data, 2026, finding no licensed listings among those analyzed)
Top Performing Airbnb Properties in Bhateliya (2026)
Benchmark your potential! Explore examples of top-performing Airbnb properties in Bhateliyabased on Trailing Twelve Month (TTM) revenue. Analyze their characteristics, revenue, occupancy rate, and ADR to understand what drives success in this market.
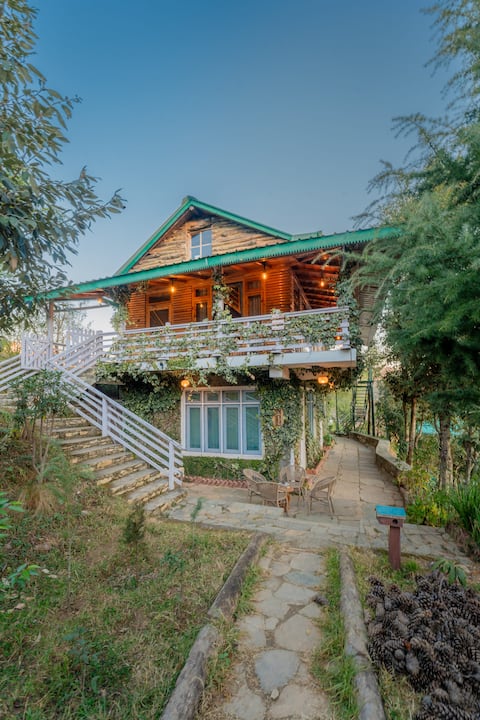
Group-Friendly Mountain Stay | Mukteshwar
Entire Place • 3 bedrooms

Hill top 6BR set w/ Pvt Balconies |Sunrise Sunset|
Private Room • 6 bedrooms
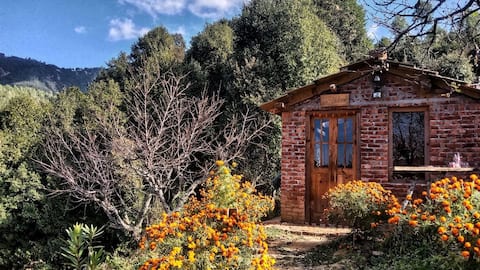
Aranyak Ranch Village Life Experience by the river
Entire Place • 3 bedrooms
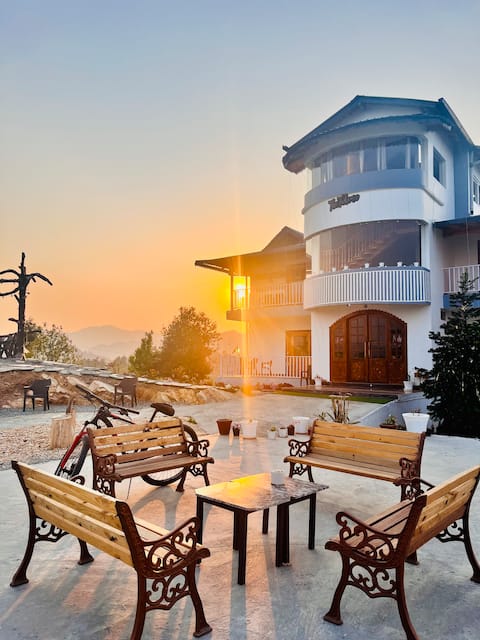
Luxe Hilltop view Villa The Tahoma Stays Muktshwar
Entire Place • 8 bedrooms
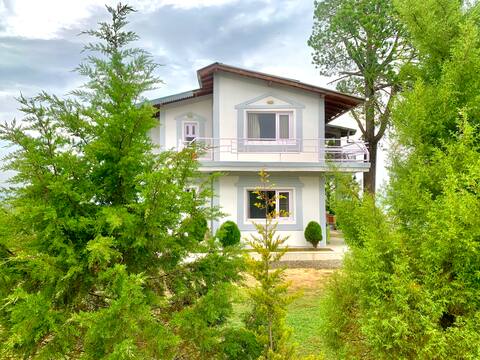
The Pine Villa (4BHK+Cook) Mukteshwar, Uttarakhand
Entire Place • 4 bedrooms

Ivy Suite @Shoonya | Mukteshwar, near Nainital
Entire Place • 2 bedrooms
Note: Performance varies based on location, size, amenities, seasonality, and management quality. Data reflects the past 12 months.
Top Performing Airbnb Hosts in Bhateliya (2026)
Learn from the best! This table showcases top-performing Airbnb hosts in Bhateliya based on the number of properties managed and estimated total revenue over the past year. Analyze their scale and performance metrics.
| Host Name | Properties | Grossing Revenue | Stay Reviews | Avg Rating |
|---|---|---|---|---|
| Inder Singh | 6 | $72,290 | 20 | 5.00/5.0 |
| Mahima And RK | 6 | $60,027 | 103 | 4.92/5.0 |
| Aranyak Ranch | 1 | $19,519 | 65 | 4.62/5.0 |
| Rishabh | 1 | $15,717 | 55 | 4.78/5.0 |
| Prakshep | 1 | $11,242 | 1 | Not Rated |
| Anil | 2 | $10,717 | 4 | Not Rated |
| Sunny | 2 | $10,436 | 36 | 4.97/5.0 |
| Homeyhuts | 2 | $8,850 | 31 | 4.86/5.0 |
| Anurag | 1 | $8,293 | 20 | 4.80/5.0 |
| Anupam | 5 | $7,027 | 84 | 4.81/5.0 |
Analyzing the strategies of top hosts, such as their property selection, pricing, and guest communication, can offer valuable lessons for optimizing your own Airbnb operations in Bhateliya.
Dive Deeper: Advanced Bhateliya STR Market Data (2026)
Ready to unlock more insights? AirROI provides access to advanced metrics and comprehensive Airbnb data for Bhateliya. Explore detailed analytics beyond this report to refine your investment strategy, optimize pricing, and maximize your vacation rental profits.
Explore Advanced MetricsBhateliya Short-Term Rental Market Composition (2026): Property & Room Types
Room Type Distribution
Property Type Distribution
Market Composition Insights for Bhateliya
- The Bhateliya Airbnb market composition is heavily skewed towards Entire Home/Apt listings, which make up 59.5% of the 42 active rentals. This indicates strong guest preference for privacy and space.
- However, a notable 40.5% share for Private Rooms suggests opportunities for budget-conscious travelers or hosts renting out spare rooms.
- Looking at the property type distribution in Bhateliya, House properties are the most common (57.1%), reflecting the local real estate landscape.
- Houses represent a significant 57.1% portion, catering likely to families or larger groups.
- The presence of 7.1% Hotel/Boutique listings indicates integration with traditional hospitality.
- Smaller segments like unique stays, apartment/condo (combined 4.8%) offer potential for unique stay experiences.
Bhateliya Airbnb Room Capacity Analysis (2026): Bedroom Distribution
Distribution of Listings by Number of Bedrooms
Room Capacity Insights for Bhateliya
- The dominant room capacity in Bhateliya is 2 bedrooms listings, making up 31% of the market. This suggests a strong demand for properties suitable for couples or solo travelers.
- Together, 2 bedrooms and 3 bedrooms properties represent 57.2% of the active Airbnb listings in Bhateliya, indicating a high concentration in these sizes.
- A significant 45.2% of listings offer 3+ bedrooms, catering to larger groups and families seeking more space in Bhateliya.
Bhateliya Vacation Rental Guest Capacity Trends (2026)
Distribution of Listings by Guest Capacity
Guest Capacity Insights for Bhateliya
- The most common guest capacity trend in Bhateliya vacation rentals is listings accommodating 8+ guests (31%). This suggests the primary traveler segment is likely larger groups.
- Properties designed for 8+ guests and 6 guests dominate the Bhateliya STR market, accounting for 45.3% of listings.
- 45.3% of properties accommodate 6+ guests, serving the market segment for larger families or group travel in Bhateliya.
- On average, properties in Bhateliya are equipped to host 4.2 guests.
Bhateliya Airbnb Booking Patterns (2026): Available vs. Booked Days
Available Days Distribution
Booked Days Distribution
Booking Pattern Insights for Bhateliya
- The most common availability pattern in Bhateliya falls within the 271-366 days range, representing 81% of listings. This suggests many properties have significant open periods on their calendars.
- Approximately 100.0% of listings show high availability (181+ days open annually), indicating potential for increased bookings or specific owner usage patterns.
- For booked days, the 1-30 days range is most frequent in Bhateliya (40.5%), reflecting common guest stay durations or potential owner blocking patterns.
Bhateliya Airbnb Minimum Stay Requirements Analysis
Distribution of Listings by Minimum Night Requirement
1 Night
34 listings
81% of total
2 Nights
1 listings
2.4% of total
30+ Nights
7 listings
16.7% of total
Key Insights
- The most prevalent minimum stay requirement in Bhateliya is 1 Night, adopted by 81% of listings. This highlights the market's preference for shorter, flexible bookings.
- A strong majority (83.4%) of the Bhateliya Airbnb data shows acceptance of very short stays (1-2 nights), indicating a dynamic, high-turnover market.
- A significant segment (16.7%) caters to monthly stays (30+ nights) in Bhateliya, pointing to opportunities in the extended-stay market.
Recommendations
- Align with the market by considering a 1 Night minimum stay, as 81% of Bhateliya hosts use this setting.
- Explore offering discounts for stays of 30+ nights to attract the 16.7% of the market seeking extended stays.
- Adjust minimum nights based on seasonality – potentially shorter during low season and longer during peak demand periods in Bhateliya.
Bhateliya Airbnb Cancellation Policy Trends Analysis (2026)
Limited
3 listings
7.1% of total
Flexible
13 listings
31% of total
Moderate
15 listings
35.7% of total
Firm
11 listings
26.2% of total
Cancellation Policy Insights for Bhateliya
- The prevailing Airbnb cancellation policy trend in Bhateliya is Moderate, used by 35.7% of listings.
- There's a relatively balanced mix between guest-friendly (66.7%) and stricter (26.2%) policies, offering choices for different guest needs.
Recommendations for Hosts
- Consider adopting a Moderate policy to align with the 35.7% market standard in Bhateliya.
- Regularly review your cancellation policy against competitors and market demand shifts in Bhateliya.
Bhateliya STR Booking Lead Time Analysis (2026)
Average Booking Lead Time by Month
Booking Lead Time Insights for Bhateliya
- The overall average booking lead time for vacation rentals in Bhateliya is 19 days.
- Guests book furthest in advance for stays during December (average 39 days), likely coinciding with peak travel demand or local events.
- The shortest booking windows occur for stays in March (average 10 days), indicating more last-minute travel plans during this time.
- Seasonally, Winter (22 days avg.) sees the longest lead times, while Spring (13 days avg.) has the shortest, reflecting typical travel planning cycles.
Recommendations for Hosts
- Use the overall average lead time (19 days) as a baseline for your pricing and availability strategy in Bhateliya.
- For December stays, consider implementing length-of-stay discounts or slightly higher rates for bookings made less than 39 days out to capitalize on advance planning.
- During March, focus on last-minute booking availability and promotions, as guests book with very short notice (10 days avg.).
- Target marketing efforts for the Winter season well in advance (at least 22 days) to capture early planners.
- Monitor your own booking lead times against these Bhateliya averages to identify opportunities for dynamic pricing adjustments.
Popular & Essential Airbnb Amenities in Bhateliya (2026)
Amenity Prevalence
Amenity Insights for Bhateliya
- Essential amenities in Bhateliya that guests expect include: Wifi. Lacking these (this) could significantly impact bookings.
- Popular amenities like Free parking on premises, TV, Hot water are common but not universal. Offering these can provide a competitive edge.
Recommendations for Hosts
- Ensure your listing includes all essential amenities for Bhateliya: Wifi.
- Consider adding popular differentiators like Free parking on premises or TV to increase appeal.
- Highlight unique or less common amenities you offer (e.g., hot tub, dedicated workspace, EV charger) in your listing description and photos.
- Regularly check competitor amenities in Bhateliya to stay competitive.
Bhateliya Airbnb Guest Demographics & Profile Analysis (2026)
Guest Profile Summary for Bhateliya
- The typical guest profile for Airbnb in Bhateliya consists of primarily domestic travelers (92%), often arriving from nearby New Delhi, typically belonging to the Post-2000s (Gen Z/Alpha) group (50%), primarily speaking Hindi or English.
- Domestic travelers account for 91.8% of guests.
- Key international markets include India (91.8%) and United Kingdom (2.4%).
- Top languages spoken are Hindi (42.7%) followed by English (42.7%).
- A significant demographic segment is the Post-2000s (Gen Z/Alpha) group, representing 50% of guests.
Recommendations for Hosts
- Target domestic marketing efforts towards travelers from New Delhi and Delhi.
- Tailor amenities and listing descriptions to appeal to the dominant Post-2000s (Gen Z/Alpha) demographic (e.g., highlight fast WiFi, smart home features, local guides).
- Highlight unique local experiences or amenities relevant to the primary guest profile.
- Consider seasonal promotions aligned with peak travel times for key origin markets.
Nearby Short-Term Rental Market Comparison
How does the Bhateliya Airbnb market stack up against its neighbors? Compare key performance metrics like average monthly revenue, ADR, and occupancy rates in surrounding areas to understand the broader regional STR landscape.
| Market | Active Properties | Monthly Revenue | Daily Rate | Avg. Occupancy |
|---|---|---|---|---|
| Dungsil Malla | 22 | $923 | $156.38 | 19% |
| barlowganj | 21 | $851 | $206.15 | 24% |
| Jabarkhet | 28 | $765 | $98.72 | 29% |
| bluchor hill | 28 | $762 | $152.00 | 21% |
| Bhimtal | 92 | $598 | $144.67 | 20% |
| Bilaspur | 12 | $591 | $130.77 | 20% |
| bhatta | 48 | $565 | $100.82 | 26% |
| Mussoorie | 187 | $551 | $116.52 | 26% |
| Rāmnagar | 23 | $543 | $140.74 | 17% |
| Jawaharna | 24 | $542 | $129.87 | 16% |