barlowganj Airbnb Market Analysis 2026: Short Term Rental Data & Vacation Rental Statistics in Uttarakhand, India
Is Airbnb profitable in barlowganj in 2026? Explore comprehensive Airbnb analytics for barlowganj, Uttarakhand, India to uncover income potential. This 2026 STR market report for barlowganj, based on AirROI data from February 2025 to January 2026, reveals key trends in the niche market of 21 active listings.
Whether you're considering an Airbnb investment in barlowganj, optimizing your existing vacation rental, or exploring rental arbitrage opportunities, understanding the barlowganj Airbnb data is crucial. Leveraging the low regulation environment is key to maximizing your short term rental income potential. Let's dive into the specifics.
Key barlowganj Airbnb Performance Metrics Overview
Monthly Airbnb Revenue Variations & Income Potential in barlowganj (2026)
Understanding the monthly revenue variations for Airbnb listings in barlowganj is key to maximizing your short term rental income potential. Seasonality significantly impacts earnings. Our analysis, based on data from the past 12 months, shows that the peak revenue month for STRs in barlowganj is typically June, while July often presents the lowest earnings, highlighting opportunities for strategic pricing adjustments during shoulder and low seasons. Explore the typical Airbnb income in barlowganj across different performance tiers:
- Best-in-class properties (Top 10%) achieve $2,895+ monthly, often utilizing dynamic pricing and superior guest experiences.
- Strong performing properties (Top 25%) earn $1,976 or more, indicating effective management and desirable locations/amenities.
- Typical properties (Median) generate around $888 per month, representing the average market performance.
- Entry-level properties (Bottom 25%) see earnings around $424, often with potential for optimization.
Average Monthly Airbnb Earnings Trend in barlowganj
barlowganj Airbnb Occupancy Rate Trends (2026)
Maximize your bookings by understanding the barlowganj STR occupancy trends. Seasonal demand shifts significantly influence how often properties are booked. Typically, Junesees the highest demand (peak season occupancy), while July experiences the lowest (low season). Effective strategies, like adjusting minimum stays or offering promotions, can boost occupancy during slower periods. Here's how different property tiers perform in barlowganj:
- Best-in-class properties (Top 10%) achieve 67%+ occupancy, indicating high desirability and potentially optimized availability.
- Strong performing properties (Top 25%) maintain 41% or higher occupancy, suggesting good market fit and guest satisfaction.
- Typical properties (Median) have an occupancy rate around 23%.
- Entry-level properties (Bottom 25%) average 11% occupancy, potentially facing higher vacancy.
Average Monthly Occupancy Rate Trend in barlowganj
Average Daily Rate (ADR) Airbnb Trends in barlowganj (2026)
Effective short term rental pricing strategy in barlowganj involves understanding monthly ADR fluctuations. The Average Daily Rate (ADR) for Airbnb in barlowganj typically peaks in October and dips lowest during August. Leveraging Airbnb dynamic pricing tools or strategies based on this seasonality can significantly boost revenue. Here's a look at the typical nightly rates achieved:
- Best-in-class properties (Top 10%) command rates of $405+ per night, often due to premium features or locations.
- Strong performing properties (Top 25%) achieve nightly rates of $274 or more.
- Typical properties (Median) charge around $141 per night.
- Entry-level properties (Bottom 25%) earn around $70 per night.
Average Daily Rate (ADR) Trend by Month in barlowganj
Get Live barlowganj Market Intelligence 👇

Explore Real-time Analytics
Airbnb Seasonality Analysis & Trends in barlowganj (2026)
Peak Season (June, December, March)
- Revenue averages $1,810 per month
- Occupancy rates average 35.4%
- Daily rates average $203
Shoulder Season
- Revenue averages $1,274 per month
- Occupancy maintains around 31.0%
- Daily rates hold near $199
Low Season (July, August, October)
- Revenue drops to average $886 per month
- Occupancy decreases to average 22.1%
- Daily rates adjust to average $192
Seasonality Insights for barlowganj
- The Airbnb seasonality in barlowganj shows highly seasonal trends requiring careful strategy. While the sections above show seasonal averages, it's also insightful to look at the extremes:
- During the high season, the absolute peak month showcases barlowganj's highest earning potential, with monthly revenues capable of climbing to $1,899, occupancy reaching a high of 39.2%, and ADRs peaking at $228.
- Conversely, the slowest single month of the year, typically falling within the low season, marks the market's lowest point. In this month, revenue might dip to $832, occupancy could drop to 19.1%, and ADRs may adjust down to $173.
- Understanding both the seasonal averages and these monthly peaks and troughs in revenue, occupancy, and ADR is crucial for maximizing your Airbnb profit potential in barlowganj.
Seasonal Strategies for Maximizing Profit
- Peak Season: Maximize revenue through premium pricing and potentially longer minimum stays. Ensure high availability.
- Low Season: Offer competitive pricing, special promotions (e.g., extended stay discounts), and flexible cancellation policies. Target off-season travelers like remote workers or budget-conscious guests.
- Shoulder Seasons: Implement dynamic pricing that balances peak and low rates. Target weekend travelers or specific events. Offer slightly more flexible terms than peak season.
- Regularly analyze your own performance against these barlowganj seasonality benchmarks and adjust your pricing and availability strategy accordingly.
Best Areas for Airbnb Investment in barlowganj (2026)
Exploring the top neighborhoods for short-term rentals in barlowganj? This section highlights key areas, outlining why they are attractive for hosts and guests, along with notable local attractions. Consider these locations based on your target guest profile and investment strategy.
| Neighborhood / Area | Why Host Here? (Target Guests & Appeal) | Key Attractions & Landmarks |
|---|---|---|
| Mall Road | Popular tourist destination with stunning views of the mountains and an array of shopping and dining options. A great place for tourists to stay to explore nearby attractions. | The Mall Road Promenade, Town Hall, Cloud's End, Malsi Deer Park, St. Paul’s Church |
| Lake Mist | A serene location known for its beautiful lake and natural surroundings, perfect for nature lovers and families seeking tranquility away from the city buzz. | Lake Mist, Kempty Falls, Dhanaulti, Surkanda Devi Temple, Skywalk at Dhanaulti |
| Landour | Charming hillside area with colonial architecture and beautiful scenery. It's a place for peace seekers and those wanting a quiet retreat close to nature. | Landour Language School, Char Dukan, Sisters Bazaar, Lal Tibba, St. John's Church |
| Mussoorie Ghar | A picturesque area that offers a traditional hill station experience with easy access to both nature and culture. Families enjoy visiting this quieter part of the town. | Mussoorie Lake, Camel's Back Road, Gun Hill, Jharipani Falls, K Dev Bhoomi Wax Museum |
| Kempty Falls | Famous for its stunning waterfall, Kempty Falls is a must-visit spot for tourists. It's a popular location for guests looking to experience the natural beauty of the region. | Kempty Falls, Kempty Fall restaurants, Bhatta Falls, Baldi River, Cloud End |
| Dhanaulti | Known for its eco-parks and adventure sports, Dhanaulti attracts tourists looking for a mix of nature and excitement, being just a short drive from Mussoorie. | Eco Park Dhanaulti, Surkanda Devi Temple, Dhanaulti Adventure Park, Deogarh Fort, Thangdhar Village |
| Jharipani | A peaceful suburb of Mussoorie known for its quiet ambiance and beautiful nature. Perfect for relaxation and a retreat away from the busy tourist spots. | Jharipani Falls, The Ramgarh Lodge, Jharipani Market, Nearby trekking trails, Local eateries |
| Happy Valley | A tranquil residential area in Mussoorie with picturesque views and a laid-back atmosphere, ideal for visitors looking for a quiet getaway close to the city center. | Happy Valley Buddhist Temple, Library Bazaar, Mussoorie Heritage Center, Evening walks on the hill, Local cafes |
Understanding Airbnb License Requirements & STR Laws in barlowganj (2026)
While barlowganj, Uttarakhand, India currently shows low STR regulations, specific Airbnb license requirements might still exist or change. Always verify the latest short term rental regulations and Airbnb license requirements directly with local government authorities for barlowganj to ensure full compliance before hosting.
(Source: AirROI data, 2026, finding no licensed listings among those analyzed)
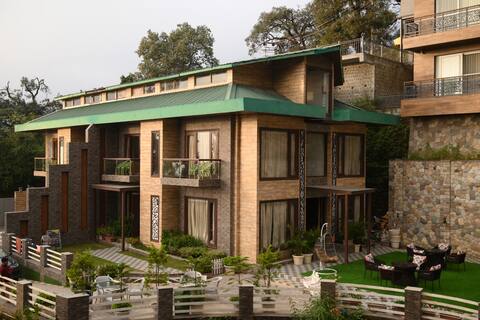
Top Performing Airbnb Properties in barlowganj (2026)
Benchmark your potential! Explore examples of top-performing Airbnb properties in barlowganjbased on Trailing Twelve Month (TTM) revenue. Analyze their characteristics, revenue, occupancy rate, and ADR to understand what drives success in this market.
Ridgewood Manor Mussoorie
Entire Place • 4 bedrooms

Brisa Cottage - Discover Nature and Yourself
Entire Place • 2 bedrooms

One Oak Maryville
Entire Place • 2 bedrooms

The Huxley Cottage - Views That Take Breadth Away
Entire Place • 2 bedrooms

Merryville Cottage
Entire Place • 2 bedrooms

A Luxurious Paradise Homestay Mussoorie
Entire Place • 5 bedrooms
Note: Performance varies based on location, size, amenities, seasonality, and management quality. Data reflects the past 12 months.
Top Performing Airbnb Hosts in barlowganj (2026)
Learn from the best! This table showcases top-performing Airbnb hosts in barlowganj based on the number of properties managed and estimated total revenue over the past year. Analyze their scale and performance metrics.
| Host Name | Properties | Grossing Revenue | Stay Reviews | Avg Rating |
|---|---|---|---|---|
| Nupur | 2 | $58,282 | 339 | 4.83/5.0 |
| Disha | 1 | $32,217 | 11 | 4.55/5.0 |
| Neha | 5 | $31,016 | 6 | Not Rated |
| Simran | 1 | $28,538 | 53 | 4.72/5.0 |
| Dhruv | 1 | $14,579 | 54 | 4.91/5.0 |
| Lakshya | 1 | $9,528 | 1 | Not Rated |
| Priyanka | 1 | $7,414 | 19 | 4.00/5.0 |
| Puneet | 2 | $7,287 | 85 | 4.93/5.0 |
| Shirin | 1 | $7,284 | 74 | 4.61/5.0 |
| Asmira | 1 | $6,488 | 95 | 4.78/5.0 |
Analyzing the strategies of top hosts, such as their property selection, pricing, and guest communication, can offer valuable lessons for optimizing your own Airbnb operations in barlowganj.
Dive Deeper: Advanced barlowganj STR Market Data (2026)
Ready to unlock more insights? AirROI provides access to advanced metrics and comprehensive Airbnb data for barlowganj. Explore detailed analytics beyond this report to refine your investment strategy, optimize pricing, and maximize your vacation rental profits.
Explore Advanced Metricsbarlowganj Short-Term Rental Market Composition (2026): Property & Room Types
Room Type Distribution
Property Type Distribution
Market Composition Insights for barlowganj
- The barlowganj Airbnb market composition is heavily skewed towards Entire Home/Apt listings, which make up 85.7% of the 21 active rentals. This indicates strong guest preference for privacy and space.
- Looking at the property type distribution in barlowganj, House properties are the most common (81%), reflecting the local real estate landscape.
- Houses represent a significant 81% portion, catering likely to families or larger groups.
barlowganj Airbnb Room Capacity Analysis (2026): Bedroom Distribution
Distribution of Listings by Number of Bedrooms
Room Capacity Insights for barlowganj
- The dominant room capacity in barlowganj is 2 bedrooms listings, making up 28.6% of the market. This suggests a strong demand for properties suitable for couples or solo travelers.
- Together, 2 bedrooms and 3 bedrooms properties represent 52.4% of the active Airbnb listings in barlowganj, indicating a high concentration in these sizes.
- A significant 57.1% of listings offer 3+ bedrooms, catering to larger groups and families seeking more space in barlowganj.
barlowganj Vacation Rental Guest Capacity Trends (2026)
Distribution of Listings by Guest Capacity
Guest Capacity Insights for barlowganj
- The most common guest capacity trend in barlowganj vacation rentals is listings accommodating 6 guests (33.3%). This suggests the primary traveler segment is likely larger groups.
- Properties designed for 6 guests and 8+ guests dominate the barlowganj STR market, accounting for 66.6% of listings.
- 71.4% of properties accommodate 6+ guests, serving the market segment for larger families or group travel in barlowganj.
- On average, properties in barlowganj are equipped to host 5.6 guests.
barlowganj Airbnb Booking Patterns (2026): Available vs. Booked Days
Available Days Distribution
Booked Days Distribution
Booking Pattern Insights for barlowganj
- The most common availability pattern in barlowganj falls within the 271-366 days range, representing 76.2% of listings. This suggests many properties have significant open periods on their calendars.
- Approximately 90.5% of listings show high availability (181+ days open annually), indicating potential for increased bookings or specific owner usage patterns.
- For booked days, the 1-30 days range is most frequent in barlowganj (42.9%), reflecting common guest stay durations or potential owner blocking patterns.
- A notable 9.5% of properties secure long booking periods (181+ days booked per year), highlighting successful long-term rental strategies or significant owner usage.
barlowganj Airbnb Minimum Stay Requirements Analysis
Distribution of Listings by Minimum Night Requirement
1 Night
19 listings
90.5% of total
30+ Nights
2 listings
9.5% of total
Key Insights
- The most prevalent minimum stay requirement in barlowganj is 1 Night, adopted by 90.5% of listings. This highlights the market's preference for shorter, flexible bookings.
- A strong majority (90.5%) of the barlowganj Airbnb data shows acceptance of very short stays (1-2 nights), indicating a dynamic, high-turnover market.
Recommendations
- Align with the market by considering a 1 Night minimum stay, as 90.5% of barlowganj hosts use this setting.
- Explore offering discounts for stays of 30+ nights to attract the 9.5% of the market seeking extended stays.
- Adjust minimum nights based on seasonality – potentially shorter during low season and longer during peak demand periods in barlowganj.
barlowganj Airbnb Cancellation Policy Trends Analysis (2026)
Flexible
4 listings
19% of total
Moderate
3 listings
14.3% of total
Firm
9 listings
42.9% of total
Strict
5 listings
23.8% of total
Cancellation Policy Insights for barlowganj
- The prevailing Airbnb cancellation policy trend in barlowganj is Firm, used by 42.9% of listings.
- A majority (66.7%) of hosts in barlowganj utilize Firm or Strict policies, indicating a market where hosts prioritize booking security.
Recommendations for Hosts
- Consider adopting a Firm policy to align with the 42.9% market standard in barlowganj.
- Regularly review your cancellation policy against competitors and market demand shifts in barlowganj.
barlowganj STR Booking Lead Time Analysis (2026)
Average Booking Lead Time by Month
Booking Lead Time Insights for barlowganj
- The overall average booking lead time for vacation rentals in barlowganj is 13 days.
- Guests book furthest in advance for stays during December (average 26 days), likely coinciding with peak travel demand or local events.
- The shortest booking windows occur for stays in March (average 6 days), indicating more last-minute travel plans during this time.
- Seasonally, Winter (16 days avg.) sees the longest lead times, while Fall (11 days avg.) has the shortest, reflecting typical travel planning cycles.
Recommendations for Hosts
- Use the overall average lead time (13 days) as a baseline for your pricing and availability strategy in barlowganj.
- For December stays, consider implementing length-of-stay discounts or slightly higher rates for bookings made less than 26 days out to capitalize on advance planning.
- Target marketing efforts for the Winter season well in advance (at least 16 days) to capture early planners.
- Monitor your own booking lead times against these barlowganj averages to identify opportunities for dynamic pricing adjustments.
Popular & Essential Airbnb Amenities in barlowganj (2026)
Amenity Prevalence
Amenity Insights for barlowganj
- Essential amenities in barlowganj that guests expect include: Heating, Wifi, Hot water, Free parking on premises. Lacking these (any) could significantly impact bookings.
- Popular amenities like Extra pillows and blankets, Dishes and silverware, TV are common but not universal. Offering these can provide a competitive edge.
Recommendations for Hosts
- Ensure your listing includes all essential amenities for barlowganj: Heating, Wifi, Hot water, Free parking on premises.
- Prioritize adding missing essentials: Hot water, Free parking on premises.
- Consider adding popular differentiators like Extra pillows and blankets or Dishes and silverware to increase appeal.
- Highlight unique or less common amenities you offer (e.g., hot tub, dedicated workspace, EV charger) in your listing description and photos.
- Regularly check competitor amenities in barlowganj to stay competitive.
barlowganj Airbnb Guest Demographics & Profile Analysis (2026)
Guest Profile Summary for barlowganj
- The typical guest profile for Airbnb in barlowganj consists of primarily domestic travelers (81%), often arriving from nearby Mumbai, typically belonging to the Post-2000s (Gen Z/Alpha) group (50%), primarily speaking English or Hindi.
- Domestic travelers account for 81.3% of guests.
- Key international markets include India (81.3%) and United States (8.3%).
- Top languages spoken are English (51.2%) followed by Hindi (34.9%).
- A significant demographic segment is the Post-2000s (Gen Z/Alpha) group, representing 50% of guests.
Recommendations for Hosts
- Target domestic marketing efforts towards travelers from Mumbai and New Delhi.
- Tailor amenities and listing descriptions to appeal to the dominant Post-2000s (Gen Z/Alpha) demographic (e.g., highlight fast WiFi, smart home features, local guides).
- Highlight unique local experiences or amenities relevant to the primary guest profile.
- Consider seasonal promotions aligned with peak travel times for key origin markets.
Nearby Short-Term Rental Market Comparison
How does the barlowganj Airbnb market stack up against its neighbors? Compare key performance metrics like average monthly revenue, ADR, and occupancy rates in surrounding areas to understand the broader regional STR landscape.
| Market | Active Properties | Monthly Revenue | Daily Rate | Avg. Occupancy |
|---|---|---|---|---|
| Dungsil Malla | 22 | $923 | $156.38 | 19% |
| Jabarkhet | 28 | $765 | $98.72 | 29% |
| bluchor hill | 28 | $762 | $152.00 | 21% |
| Mashobra | 10 | $739 | $247.62 | 16% |
| Bhimtal | 92 | $598 | $144.67 | 20% |
| Narkanda | 17 | $592 | $128.48 | 16% |
| Bilaspur | 12 | $591 | $130.77 | 20% |
| Dharampur | 94 | $581 | $139.92 | 17% |
| bhatta | 48 | $565 | $100.82 | 26% |
| Mussoorie | 187 | $551 | $116.52 | 26% |