Varanasi Airbnb Market Analysis 2026: Short Term Rental Data & Vacation Rental Statistics in Uttar Pradesh, India
Is Airbnb profitable in Varanasi in 2026? Explore comprehensive Airbnb analytics for Varanasi, Uttar Pradesh, India to uncover income potential. This 2026 STR market report for Varanasi, based on AirROI data from February 2025 to January 2026, reveals key trends in the market of 745 active listings.
Whether you're considering an Airbnb investment in Varanasi, optimizing your existing vacation rental, or exploring rental arbitrage opportunities, understanding the Varanasi Airbnb data is crucial. Leveraging the low regulation environment is key to maximizing your short term rental income potential. Let's dive into the specifics.
Key Varanasi Airbnb Performance Metrics Overview
Monthly Airbnb Revenue Variations & Income Potential in Varanasi (2026)
Understanding the monthly revenue variations for Airbnb listings in Varanasi is key to maximizing your short term rental income potential. Seasonality significantly impacts earnings. Our analysis, based on data from the past 12 months, shows that the peak revenue month for STRs in Varanasi is typically February, while May often presents the lowest earnings, highlighting opportunities for strategic pricing adjustments during shoulder and low seasons. Explore the typical Airbnb income in Varanasi across different performance tiers:
- Best-in-class properties (Top 10%) achieve $989+ monthly, often utilizing dynamic pricing and superior guest experiences.
- Strong performing properties (Top 25%) earn $581 or more, indicating effective management and desirable locations/amenities.
- Typical properties (Median) generate around $291 per month, representing the average market performance.
- Entry-level properties (Bottom 25%) see earnings around $132, often with potential for optimization.
Average Monthly Airbnb Earnings Trend in Varanasi
Varanasi Airbnb Occupancy Rate Trends (2026)
Maximize your bookings by understanding the Varanasi STR occupancy trends. Seasonal demand shifts significantly influence how often properties are booked. Typically, Februarysees the highest demand (peak season occupancy), while May experiences the lowest (low season). Effective strategies, like adjusting minimum stays or offering promotions, can boost occupancy during slower periods. Here's how different property tiers perform in Varanasi:
- Best-in-class properties (Top 10%) achieve 62%+ occupancy, indicating high desirability and potentially optimized availability.
- Strong performing properties (Top 25%) maintain 44% or higher occupancy, suggesting good market fit and guest satisfaction.
- Typical properties (Median) have an occupancy rate around 26%.
- Entry-level properties (Bottom 25%) average 13% occupancy, potentially facing higher vacancy.
Average Monthly Occupancy Rate Trend in Varanasi
Average Daily Rate (ADR) Airbnb Trends in Varanasi (2026)
Effective short term rental pricing strategy in Varanasi involves understanding monthly ADR fluctuations. The Average Daily Rate (ADR) for Airbnb in Varanasi typically peaks in February and dips lowest during January. Leveraging Airbnb dynamic pricing tools or strategies based on this seasonality can significantly boost revenue. Here's a look at the typical nightly rates achieved:
- Best-in-class properties (Top 10%) command rates of $81+ per night, often due to premium features or locations.
- Strong performing properties (Top 25%) achieve nightly rates of $54 or more.
- Typical properties (Median) charge around $36 per night.
- Entry-level properties (Bottom 25%) earn around $24 per night.
Average Daily Rate (ADR) Trend by Month in Varanasi
Get Live Varanasi Market Intelligence 👇

Explore Real-time Analytics
Airbnb Seasonality Analysis & Trends in Varanasi (2026)
Peak Season (February, December, March)
- Revenue averages $648 per month
- Occupancy rates average 45.7%
- Daily rates average $47
Shoulder Season
- Revenue averages $390 per month
- Occupancy maintains around 27.2%
- Daily rates hold near $46
Low Season (May, August, September)
- Revenue drops to average $306 per month
- Occupancy decreases to average 21.8%
- Daily rates adjust to average $46
Seasonality Insights for Varanasi
- The Airbnb seasonality in Varanasi shows highly seasonal trends requiring careful strategy. While the sections above show seasonal averages, it's also insightful to look at the extremes:
- During the high season, the absolute peak month showcases Varanasi's highest earning potential, with monthly revenues capable of climbing to $827, occupancy reaching a high of 60.2%, and ADRs peaking at $47.
- Conversely, the slowest single month of the year, typically falling within the low season, marks the market's lowest point. In this month, revenue might dip to $294, occupancy could drop to 19.5%, and ADRs may adjust down to $44.
- Understanding both the seasonal averages and these monthly peaks and troughs in revenue, occupancy, and ADR is crucial for maximizing your Airbnb profit potential in Varanasi.
Seasonal Strategies for Maximizing Profit
- Peak Season: Maximize revenue through premium pricing and potentially longer minimum stays. Ensure high availability.
- Low Season: Offer competitive pricing, special promotions (e.g., extended stay discounts), and flexible cancellation policies. Target off-season travelers like remote workers or budget-conscious guests.
- Shoulder Seasons: Implement dynamic pricing that balances peak and low rates. Target weekend travelers or specific events. Offer slightly more flexible terms than peak season.
- Regularly analyze your own performance against these Varanasi seasonality benchmarks and adjust your pricing and availability strategy accordingly.
Best Areas for Airbnb Investment in Varanasi (2026)
Exploring the top neighborhoods for short-term rentals in Varanasi? This section highlights key areas, outlining why they are attractive for hosts and guests, along with notable local attractions. Consider these locations based on your target guest profile and investment strategy.
| Neighborhood / Area | Why Host Here? (Target Guests & Appeal) | Key Attractions & Landmarks |
|---|---|---|
| Dashashwamedh Ghat | The most famous ghat in Varanasi, known for its evening Ganga Aarti, attracting thousands of tourists. Ideal for those who want to experience the spiritual essence of the city directly by the river. | Ganga Aarti, Dashashwamedh Ghat, Kashi Vishwanath Temple, Boat rides on the Ganges, Local shops and eateries |
| Assi Ghat | A vibrant and less crowded ghat, popular with both locals and tourists. Known for its morning yoga sessions and cultural festivals, it provides a laid-back atmosphere by the river. | Assi Ghat, Yoga classes, Local cafes, Cultural performances, Shopping stalls |
| Sarnath | A significant Buddhist pilgrimage site located near Varanasi, attracting visitors interested in history and spirituality. Offers a tranquil experience away from the bustle of the city. | Dhamek Stupa, Sarnath Museum, Buddha's first sermon site, Various temples, Peaceful gardens |
| Kedar Ghat | Less touristy compared to others, Kedar Ghat offers a more local experience of Varanasi life. Excellent for those seeking authenticity away from the crowded spots. | Kedar Ghat, Local temples, Quiet surroundings, Cultural immersion, Street food stalls |
| Manikarnika Ghat | Known as the main cremation ghat, it's deeply significant to Hindu tradition. Offers a unique, albeit intense, perspective on Hindu beliefs about life and death. | Cremation rituals, Cultural significance, Nearby temples, Boat rides, Local stories |
| Ghats of Varanasi | The series of ghats lining the Ganges River, each with its own unique character and significance. Perfect for visitors looking to explore the diversity of Varanasi's river culture. | Multiple ghats, Cultural events, Pilgrimage experiences, Historical significance, Local crafts |
| Varanasi Old City | A maze of narrow lanes filled with history, temples, and shops. Ideal for those wanting to experience the traditional lifestyle and heritage of Varanasi. | Kashi Vishwanath Temple, Local bazaars, Heritage buildings, Street snacks, Cultural experiences |
| Tulsi Ghat | A peaceful ghat that is less commercialized. Known for its association with the poet Tulsidas and the various cultural activities it hosts. | Tulsi Ghat, Cultural events, Peaceful setting, Boating options, Local cuisine |
Understanding Airbnb License Requirements & STR Laws in Varanasi (2026)
While Varanasi, Uttar Pradesh, India currently shows low STR regulations, specific Airbnb license requirements might still exist or change. Always verify the latest short term rental regulations and Airbnb license requirements directly with local government authorities for Varanasi to ensure full compliance before hosting.
(Source: AirROI data, 2026, based on 0% licensed listings)
Top Performing Airbnb Properties in Varanasi (2026)
Benchmark your potential! Explore examples of top-performing Airbnb properties in Varanasibased on Trailing Twelve Month (TTM) revenue. Analyze their characteristics, revenue, occupancy rate, and ADR to understand what drives success in this market.

4BR Ganga House w/ Serene River view - Varanasi
Entire Place • 4 bedrooms

3BR @ Arcadian Manor w/Pvt Pool & Lawn - Varanasi
Entire Place • 3 bedrooms
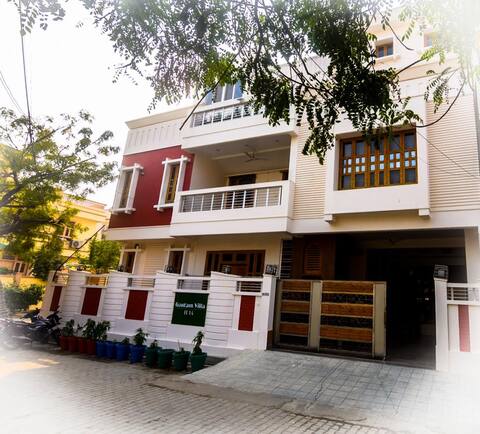
Gautam Villa
Entire Place • 5 bedrooms

Pristine by M
Entire Place • 3 bedrooms

5 Bedroom Villa @ Serene Stays near Ghat & Temple
Entire Place • 5 bedrooms

Kumari Kunj Home Stay (only family) near KV Temple
Entire Place • 2 bedrooms
Note: Performance varies based on location, size, amenities, seasonality, and management quality. Data reflects the past 12 months.
Top Performing Airbnb Hosts in Varanasi (2026)
Learn from the best! This table showcases top-performing Airbnb hosts in Varanasi based on the number of properties managed and estimated total revenue over the past year. Analyze their scale and performance metrics.
| Host Name | Properties | Grossing Revenue | Stay Reviews | Avg Rating |
|---|---|---|---|---|
| Sahej | 10 | $87,953 | 487 | 4.83/5.0 |
| Vishrut | 13 | $69,108 | 1115 | 4.68/5.0 |
| Abhishu | 9 | $63,921 | 299 | 4.79/5.0 |
| Shruti | 13 | $61,665 | 306 | 4.48/5.0 |
| Paarvi | 9 | $55,388 | 648 | 4.78/5.0 |
| Anil | 1 | $52,434 | 10 | 4.80/5.0 |
| Kanti | 15 | $45,768 | 378 | 4.77/5.0 |
| Raj Kumar | 9 | $42,683 | 110 | 4.92/5.0 |
| Dipti | 5 | $41,904 | 98 | 4.67/5.0 |
| Vaibhav | 5 | $41,539 | 286 | 4.95/5.0 |
Analyzing the strategies of top hosts, such as their property selection, pricing, and guest communication, can offer valuable lessons for optimizing your own Airbnb operations in Varanasi.
Dive Deeper: Advanced Varanasi STR Market Data (2026)
Ready to unlock more insights? AirROI provides access to advanced metrics and comprehensive Airbnb data for Varanasi. Explore detailed analytics beyond this report to refine your investment strategy, optimize pricing, and maximize your vacation rental profits.
Explore Advanced MetricsVaranasi Short-Term Rental Market Composition (2026): Property & Room Types
Room Type Distribution
Property Type Distribution
Market Composition Insights for Varanasi
- The Varanasi Airbnb market composition is heavily skewed towards Entire Home/Apt listings, which make up 54.6% of the 745 active rentals. This indicates strong guest preference for privacy and space.
- However, a notable 44.6% share for Private Rooms suggests opportunities for budget-conscious travelers or hosts renting out spare rooms.
- Looking at the property type distribution in Varanasi, Apartment/Condo properties are the most common (46.4%), reflecting the local real estate landscape.
- Houses represent a significant 37.7% portion, catering likely to families or larger groups.
- The presence of 14.6% Hotel/Boutique listings indicates integration with traditional hospitality.
- Smaller segments like others, outdoor/unique (combined 1.2%) offer potential for unique stay experiences.
Varanasi Airbnb Room Capacity Analysis (2026): Bedroom Distribution
Distribution of Listings by Number of Bedrooms
Room Capacity Insights for Varanasi
- The dominant room capacity in Varanasi is 2 bedrooms listings, making up 28.1% of the market. This suggests a strong demand for properties suitable for couples or solo travelers.
- Together, 2 bedrooms and 1 bedroom properties represent 47.3% of the active Airbnb listings in Varanasi, indicating a high concentration in these sizes.
- A significant 26.0% of listings offer 3+ bedrooms, catering to larger groups and families seeking more space in Varanasi.
Varanasi Vacation Rental Guest Capacity Trends (2026)
Distribution of Listings by Guest Capacity
Guest Capacity Insights for Varanasi
- The most common guest capacity trend in Varanasi vacation rentals is listings accommodating 8+ guests (20.7%). This suggests the primary traveler segment is likely larger groups.
- Properties designed for 8+ guests and 6 guests dominate the Varanasi STR market, accounting for 31.8% of listings.
- 34.8% of properties accommodate 6+ guests, serving the market segment for larger families or group travel in Varanasi.
- On average, properties in Varanasi are equipped to host 3.6 guests.
Varanasi Airbnb Booking Patterns (2026): Available vs. Booked Days
Available Days Distribution
Booked Days Distribution
Booking Pattern Insights for Varanasi
- The most common availability pattern in Varanasi falls within the 271-366 days range, representing 75.7% of listings. This suggests many properties have significant open periods on their calendars.
- Approximately 94.5% of listings show high availability (181+ days open annually), indicating potential for increased bookings or specific owner usage patterns.
- For booked days, the 31-90 days range is most frequent in Varanasi (37.7%), reflecting common guest stay durations or potential owner blocking patterns.
- A notable 6.1% of properties secure long booking periods (181+ days booked per year), highlighting successful long-term rental strategies or significant owner usage.
Varanasi Airbnb Minimum Stay Requirements Analysis
Distribution of Listings by Minimum Night Requirement
1 Night
697 listings
93.6% of total
2 Nights
17 listings
2.3% of total
3 Nights
2 listings
0.3% of total
30+ Nights
29 listings
3.9% of total
Key Insights
- The most prevalent minimum stay requirement in Varanasi is 1 Night, adopted by 93.6% of listings. This highlights the market's preference for shorter, flexible bookings.
- A strong majority (95.9%) of the Varanasi Airbnb data shows acceptance of very short stays (1-2 nights), indicating a dynamic, high-turnover market.
Recommendations
- Align with the market by considering a 1 Night minimum stay, as 93.6% of Varanasi hosts use this setting.
- Adjust minimum nights based on seasonality – potentially shorter during low season and longer during peak demand periods in Varanasi.
Varanasi Airbnb Cancellation Policy Trends Analysis (2026)
Limited
17 listings
2.3% of total
Flexible
380 listings
51% of total
Moderate
210 listings
28.2% of total
Firm
122 listings
16.4% of total
Strict
16 listings
2.1% of total
Cancellation Policy Insights for Varanasi
- The prevailing Airbnb cancellation policy trend in Varanasi is Flexible, used by 51% of listings.
- The market strongly favors guest-friendly terms, with 79.2% of listings offering Flexible or Moderate policies. This suggests guests in Varanasi may expect booking flexibility.
- Strict cancellation policies are quite rare (2.1%), potentially making listings with this policy less competitive unless justified by high demand or property type.
Recommendations for Hosts
- Consider adopting a Flexible policy to align with the 51% market standard in Varanasi.
- Given the high prevalence of Flexible policies (51%), offering this can enhance booking appeal, especially during shoulder seasons.
- Using a Strict policy might deter some guests, as only 2.1% of listings use it. Evaluate if potential revenue protection outweighs possible lower booking rates.
- Regularly review your cancellation policy against competitors and market demand shifts in Varanasi.
Varanasi STR Booking Lead Time Analysis (2026)
Average Booking Lead Time by Month
Booking Lead Time Insights for Varanasi
- The overall average booking lead time for vacation rentals in Varanasi is 19 days.
- Guests book furthest in advance for stays during November (average 38 days), likely coinciding with peak travel demand or local events.
- The shortest booking windows occur for stays in June (average 11 days), indicating more last-minute travel plans during this time.
- Seasonally, Fall (28 days avg.) sees the longest lead times, while Summer (14 days avg.) has the shortest, reflecting typical travel planning cycles.
Recommendations for Hosts
- Use the overall average lead time (19 days) as a baseline for your pricing and availability strategy in Varanasi.
- For November stays, consider implementing length-of-stay discounts or slightly higher rates for bookings made less than 38 days out to capitalize on advance planning.
- During June, focus on last-minute booking availability and promotions, as guests book with very short notice (11 days avg.).
- Target marketing efforts for the Fall season well in advance (at least 28 days) to capture early planners.
- Monitor your own booking lead times against these Varanasi averages to identify opportunities for dynamic pricing adjustments.
Popular & Essential Airbnb Amenities in Varanasi (2026)
Amenity Prevalence
Amenity Insights for Varanasi
- Essential amenities in Varanasi that guests expect include: Wifi. Lacking these (this) could significantly impact bookings.
- Popular amenities like Air conditioning, Hot water, Free parking on premises are common but not universal. Offering these can provide a competitive edge.
Recommendations for Hosts
- Ensure your listing includes all essential amenities for Varanasi: Wifi.
- Prioritize adding missing essentials: Wifi.
- Consider adding popular differentiators like Air conditioning or Hot water to increase appeal.
- Highlight unique or less common amenities you offer (e.g., hot tub, dedicated workspace, EV charger) in your listing description and photos.
- Regularly check competitor amenities in Varanasi to stay competitive.
Varanasi Airbnb Guest Demographics & Profile Analysis (2026)
Guest Profile Summary for Varanasi
- The typical guest profile for Airbnb in Varanasi consists of primarily domestic travelers (67%), often arriving from nearby Bengaluru, typically belonging to the Post-2000s (Gen Z/Alpha) group (50%), primarily speaking English or Hindi.
- Domestic travelers account for 67.1% of guests.
- Key international markets include India (67.1%) and United States (8.9%).
- Top languages spoken are English (41.8%) followed by Hindi (30.3%).
- A significant demographic segment is the Post-2000s (Gen Z/Alpha) group, representing 50% of guests.
Recommendations for Hosts
- Target domestic marketing efforts towards travelers from Bengaluru and New Delhi.
- Tailor amenities and listing descriptions to appeal to the dominant Post-2000s (Gen Z/Alpha) demographic (e.g., highlight fast WiFi, smart home features, local guides).
- Highlight unique local experiences or amenities relevant to the primary guest profile.
- Consider seasonal promotions aligned with peak travel times for key origin markets.
Nearby Short-Term Rental Market Comparison
How does the Varanasi Airbnb market stack up against its neighbors? Compare key performance metrics like average monthly revenue, ADR, and occupancy rates in surrounding areas to understand the broader regional STR landscape.