Sunrakh Airbnb Market Analysis 2026: Short Term Rental Data & Vacation Rental Statistics in Uttar Pradesh, India
Is Airbnb profitable in Sunrakh in 2026? Explore comprehensive Airbnb analytics for Sunrakh, Uttar Pradesh, India to uncover income potential. This 2026 STR market report for Sunrakh, based on AirROI data from February 2025 to January 2026, reveals key trends in the niche market of 53 active listings.
Whether you're considering an Airbnb investment in Sunrakh, optimizing your existing vacation rental, or exploring rental arbitrage opportunities, understanding the Sunrakh Airbnb data is crucial. Leveraging the low regulation environment is key to maximizing your short term rental income potential. Let's dive into the specifics.
Key Sunrakh Airbnb Performance Metrics Overview
Monthly Airbnb Revenue Variations & Income Potential in Sunrakh (2026)
Understanding the monthly revenue variations for Airbnb listings in Sunrakh is key to maximizing your short term rental income potential. Seasonality significantly impacts earnings. Our analysis, based on data from the past 12 months, shows that the peak revenue month for STRs in Sunrakh is typically August, while April often presents the lowest earnings, highlighting opportunities for strategic pricing adjustments during shoulder and low seasons. Explore the typical Airbnb income in Sunrakh across different performance tiers:
- Best-in-class properties (Top 10%) achieve $759+ monthly, often utilizing dynamic pricing and superior guest experiences.
- Strong performing properties (Top 25%) earn $481 or more, indicating effective management and desirable locations/amenities.
- Typical properties (Median) generate around $289 per month, representing the average market performance.
- Entry-level properties (Bottom 25%) see earnings around $137, often with potential for optimization.
Average Monthly Airbnb Earnings Trend in Sunrakh
Sunrakh Airbnb Occupancy Rate Trends (2026)
Maximize your bookings by understanding the Sunrakh STR occupancy trends. Seasonal demand shifts significantly influence how often properties are booked. Typically, Decembersees the highest demand (peak season occupancy), while May experiences the lowest (low season). Effective strategies, like adjusting minimum stays or offering promotions, can boost occupancy during slower periods. Here's how different property tiers perform in Sunrakh:
- Best-in-class properties (Top 10%) achieve 62%+ occupancy, indicating high desirability and potentially optimized availability.
- Strong performing properties (Top 25%) maintain 47% or higher occupancy, suggesting good market fit and guest satisfaction.
- Typical properties (Median) have an occupancy rate around 30%.
- Entry-level properties (Bottom 25%) average 16% occupancy, potentially facing higher vacancy.
Average Monthly Occupancy Rate Trend in Sunrakh
Average Daily Rate (ADR) Airbnb Trends in Sunrakh (2026)
Effective short term rental pricing strategy in Sunrakh involves understanding monthly ADR fluctuations. The Average Daily Rate (ADR) for Airbnb in Sunrakh typically peaks in March and dips lowest during January. Leveraging Airbnb dynamic pricing tools or strategies based on this seasonality can significantly boost revenue. Here's a look at the typical nightly rates achieved:
- Best-in-class properties (Top 10%) command rates of $53+ per night, often due to premium features or locations.
- Strong performing properties (Top 25%) achieve nightly rates of $36 or more.
- Typical properties (Median) charge around $29 per night.
- Entry-level properties (Bottom 25%) earn around $22 per night.
Average Daily Rate (ADR) Trend by Month in Sunrakh
Get Live Sunrakh Market Intelligence 👇

Explore Real-time Analytics
Airbnb Seasonality Analysis & Trends in Sunrakh (2026)
Peak Season (August, May, September)
- Revenue averages $601 per month
- Occupancy rates average 27.1%
- Daily rates average $58
Shoulder Season
- Revenue averages $499 per month
- Occupancy maintains around 37.0%
- Daily rates hold near $57
Low Season (January, February, April)
- Revenue drops to average $315 per month
- Occupancy decreases to average 32.4%
- Daily rates adjust to average $56
Seasonality Insights for Sunrakh
- The Airbnb seasonality in Sunrakh shows highly seasonal trends requiring careful strategy. While the sections above show seasonal averages, it's also insightful to look at the extremes:
- During the high season, the absolute peak month showcases Sunrakh's highest earning potential, with monthly revenues capable of climbing to $650, occupancy reaching a high of 47.4%, and ADRs peaking at $60.
- Conversely, the slowest single month of the year, typically falling within the low season, marks the market's lowest point. In this month, revenue might dip to $225, occupancy could drop to 22.9%, and ADRs may adjust down to $54.
- Understanding both the seasonal averages and these monthly peaks and troughs in revenue, occupancy, and ADR is crucial for maximizing your Airbnb profit potential in Sunrakh.
Seasonal Strategies for Maximizing Profit
- Peak Season: Maximize revenue through premium pricing and potentially longer minimum stays. Ensure high availability.
- Low Season: Offer competitive pricing, special promotions (e.g., extended stay discounts), and flexible cancellation policies. Target off-season travelers like remote workers or budget-conscious guests.
- Shoulder Seasons: Implement dynamic pricing that balances peak and low rates. Target weekend travelers or specific events. Offer slightly more flexible terms than peak season.
- Regularly analyze your own performance against these Sunrakh seasonality benchmarks and adjust your pricing and availability strategy accordingly.
Best Areas for Airbnb Investment in Sunrakh (2026)
Exploring the top neighborhoods for short-term rentals in Sunrakh? This section highlights key areas, outlining why they are attractive for hosts and guests, along with notable local attractions. Consider these locations based on your target guest profile and investment strategy.
| Neighborhood / Area | Why Host Here? (Target Guests & Appeal) | Key Attractions & Landmarks |
|---|---|---|
| Vrindavan | Famous pilgrimage city, attracting thousands of devotees and tourists to its temples and spiritual sites. Ideal for hosting guests seeking religious experiences and tranquil stays near sacred locations. | Banke Bihari Temple, ISKCON Vrindavan, Radha Raman Temple, Seva Kunj, Prem Mandir, Kusum Sarovar |
| Mathura | Birthplace of Lord Krishna and a major cultural spot with rich history and vibrant markets. A great place for tourists looking to explore Indian culture and heritage. | Krishna Janmabhoomi, Dwarkadhish Temple, Vishram Ghat, Gita Mandir, Maa Vaishno Devi Dham, Mathura Museum |
| Agra | Home to the iconic Taj Mahal and a UNESCO World Heritage site, attracting millions of visitors. A prime location for short-term rentals seeking to visit this architectural wonder and other historical sites. | Taj Mahal, Agra Fort, Fatehpur Sikri, Itimad-ud-Daulah's Tomb, Mehtab Bagh, Sadar Bazaar |
| Fatehpur Sikri | Historical city built by Emperor Akbar, famous for its stunning Mughal architecture. Popular among history enthusiasts and tourists looking to delve into India's past. | Jama Masjid, Buland Darwaza, Panch Mahal, Tomb of Salim Chishti, Sikri Fort, Sufi shrines |
| Rajasthan | Offers a glimpse into royal history and flamboyant culture, with colorful festivals and beautiful landscapes. Attracts a mix of locals and tourists looking for a unique stay. | Jaipur City Pink Fort, Udaipur Lake Pichola, Jaisalmer Fort, Ranthambore National Park, Desert Safari, Pushkar Fair |
| Noida | Emerging real estate market with a blend of modern infrastructure and proximity to Delhi. Suitable for business travelers and tech professionals visiting for work. | Noida Film City, DLF Mall of India, Noida Golf Course, The Great India Place, Akshardham Temple |
| Delhi | The capital city offering a rich tapestry of history, culture, and modern attractions. A hotspot for tourists and business visitors alike, ensuring a steady flow of guests. | India Gate, Red Fort, Qutub Minar, Lotus Temple, Humayun's Tomb, Connaught Place |
| Gurgaon | A rapidly growing city with a vibrant nightlife and proximity to Delhi. Ideal for young professionals and urban travelers looking for a modern experience. | Kingdom of Dreams, Cyber Hub, Sultanpur National Park, Aravalli Golf Course, Ambience Mall |
Understanding Airbnb License Requirements & STR Laws in Sunrakh (2026)
While Sunrakh, Uttar Pradesh, India currently shows low STR regulations, specific Airbnb license requirements might still exist or change. Always verify the latest short term rental regulations and Airbnb license requirements directly with local government authorities for Sunrakh to ensure full compliance before hosting.
(Source: AirROI data, 2026, finding no licensed listings among those analyzed)
Top Performing Airbnb Properties in Sunrakh (2026)
Benchmark your potential! Explore examples of top-performing Airbnb properties in Sunrakhbased on Trailing Twelve Month (TTM) revenue. Analyze their characteristics, revenue, occupancy rate, and ADR to understand what drives success in this market.
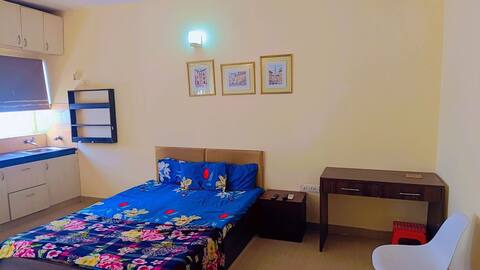
Modern Loft in the City
Entire Place • 1 bedroom

Keshavi- Blissful 2+1 bhk luxurious homestay
Entire Place • 3 bedrooms
Umang: Luxury Villa, Near Temples, Prime Location
Entire Place • 2 bedrooms

Manmohana: 2BHK Divine Krishna abode in Vrindavan
Entire Place • 2 bedrooms
RadhaKrishna Kutir - 2BHK in Vrindavan's heart
Entire Place • 2 bedrooms

Nitya Nikunj | 2BHK Near Prem Mandir | Fast Wifi
Entire Place • 2 bedrooms
Note: Performance varies based on location, size, amenities, seasonality, and management quality. Data reflects the past 12 months.
Top Performing Airbnb Hosts in Sunrakh (2026)
Learn from the best! This table showcases top-performing Airbnb hosts in Sunrakh based on the number of properties managed and estimated total revenue over the past year. Analyze their scale and performance metrics.
| Host Name | Properties | Grossing Revenue | Stay Reviews | Avg Rating |
|---|---|---|---|---|
| Sagar | 1 | $57,724 | 1 | Not Rated |
| Parv | 4 | $25,915 | 237 | 4.82/5.0 |
| Tarun | 4 | $24,777 | 365 | 4.94/5.0 |
| Akanksha | 2 | $13,880 | 113 | 4.88/5.0 |
| Saumya | 3 | $13,862 | 266 | 4.66/5.0 |
| Peeush | 2 | $12,626 | 258 | 4.97/5.0 |
| Kamal | 2 | $7,153 | 186 | 4.89/5.0 |
| Vishal | 2 | $5,892 | 23 | 4.89/5.0 |
| Shabnum B Khurana | 3 | $5,687 | 129 | 4.96/5.0 |
| Shriya | 1 | $5,297 | 107 | 4.87/5.0 |
Analyzing the strategies of top hosts, such as their property selection, pricing, and guest communication, can offer valuable lessons for optimizing your own Airbnb operations in Sunrakh.
Dive Deeper: Advanced Sunrakh STR Market Data (2026)
Ready to unlock more insights? AirROI provides access to advanced metrics and comprehensive Airbnb data for Sunrakh. Explore detailed analytics beyond this report to refine your investment strategy, optimize pricing, and maximize your vacation rental profits.
Explore Advanced MetricsSunrakh Short-Term Rental Market Composition (2026): Property & Room Types
Room Type Distribution
Property Type Distribution
Market Composition Insights for Sunrakh
- The Sunrakh Airbnb market composition is heavily skewed towards Entire Home/Apt listings, which make up 98.1% of the 53 active rentals. This indicates strong guest preference for privacy and space.
- Looking at the property type distribution in Sunrakh, Apartment/Condo properties are the most common (88.7%), reflecting the local real estate landscape.
Sunrakh Airbnb Room Capacity Analysis (2026): Bedroom Distribution
Distribution of Listings by Number of Bedrooms
Room Capacity Insights for Sunrakh
- The dominant room capacity in Sunrakh is 1 bedroom listings, making up 73.6% of the market. This suggests a strong demand for properties suitable for couples or solo travelers.
- Together, 1 bedroom and 2 bedrooms properties represent 90.6% of the active Airbnb listings in Sunrakh, indicating a high concentration in these sizes.
- With over half the market (73.6%) consisting of studios or 1-bedroom units, Sunrakh is particularly well-suited for individuals or couples.
- Listings with 3+ bedrooms (7.6%) represent a smaller niche, potentially indicating an underserved market for larger group accommodations in Sunrakh.
Sunrakh Vacation Rental Guest Capacity Trends (2026)
Distribution of Listings by Guest Capacity
Guest Capacity Insights for Sunrakh
- The most common guest capacity trend in Sunrakh vacation rentals is listings accommodating 4 guests (30.2%). This suggests the primary traveler segment is likely small families or groups.
- Properties designed for 4 guests and 3 guests dominate the Sunrakh STR market, accounting for 54.7% of listings.
- 18.9% of properties accommodate 6+ guests, serving the market segment for larger families or group travel in Sunrakh.
- On average, properties in Sunrakh are equipped to host 4.0 guests.
Sunrakh Airbnb Booking Patterns (2026): Available vs. Booked Days
Available Days Distribution
Booked Days Distribution
Booking Pattern Insights for Sunrakh
- The most common availability pattern in Sunrakh falls within the 271-366 days range, representing 62.3% of listings. This suggests many properties have significant open periods on their calendars.
- Approximately 90.6% of listings show high availability (181+ days open annually), indicating potential for increased bookings or specific owner usage patterns.
- For booked days, the 31-90 days range is most frequent in Sunrakh (37.7%), reflecting common guest stay durations or potential owner blocking patterns.
- A notable 9.4% of properties secure long booking periods (181+ days booked per year), highlighting successful long-term rental strategies or significant owner usage.
Sunrakh Airbnb Minimum Stay Requirements Analysis
Distribution of Listings by Minimum Night Requirement
1 Night
50 listings
94.3% of total
2 Nights
1 listings
1.9% of total
30+ Nights
2 listings
3.8% of total
Key Insights
- The most prevalent minimum stay requirement in Sunrakh is 1 Night, adopted by 94.3% of listings. This highlights the market's preference for shorter, flexible bookings.
- A strong majority (96.2%) of the Sunrakh Airbnb data shows acceptance of very short stays (1-2 nights), indicating a dynamic, high-turnover market.
Recommendations
- Align with the market by considering a 1 Night minimum stay, as 94.3% of Sunrakh hosts use this setting.
- Adjust minimum nights based on seasonality – potentially shorter during low season and longer during peak demand periods in Sunrakh.
Sunrakh Airbnb Cancellation Policy Trends Analysis (2026)
Limited
3 listings
5.7% of total
Flexible
21 listings
39.6% of total
Moderate
12 listings
22.6% of total
Firm
15 listings
28.3% of total
Strict
2 listings
3.8% of total
Cancellation Policy Insights for Sunrakh
- The prevailing Airbnb cancellation policy trend in Sunrakh is Flexible, used by 39.6% of listings.
- There's a relatively balanced mix between guest-friendly (62.2%) and stricter (32.1%) policies, offering choices for different guest needs.
- Strict cancellation policies are quite rare (3.8%), potentially making listings with this policy less competitive unless justified by high demand or property type.
Recommendations for Hosts
- Consider adopting a Flexible policy to align with the 39.6% market standard in Sunrakh.
- Using a Strict policy might deter some guests, as only 3.8% of listings use it. Evaluate if potential revenue protection outweighs possible lower booking rates.
- Regularly review your cancellation policy against competitors and market demand shifts in Sunrakh.
Sunrakh STR Booking Lead Time Analysis (2026)
Average Booking Lead Time by Month
Booking Lead Time Insights for Sunrakh
- The overall average booking lead time for vacation rentals in Sunrakh is 12 days.
- Guests book furthest in advance for stays during October (average 23 days), likely coinciding with peak travel demand or local events.
- The shortest booking windows occur for stays in August (average 8 days), indicating more last-minute travel plans during this time.
- Seasonally, Fall (17 days avg.) sees the longest lead times, while Summer (10 days avg.) has the shortest, reflecting typical travel planning cycles.
Recommendations for Hosts
- Use the overall average lead time (12 days) as a baseline for your pricing and availability strategy in Sunrakh.
- For October stays, consider implementing length-of-stay discounts or slightly higher rates for bookings made less than 23 days out to capitalize on advance planning.
- Target marketing efforts for the Fall season well in advance (at least 17 days) to capture early planners.
- Monitor your own booking lead times against these Sunrakh averages to identify opportunities for dynamic pricing adjustments.
Popular & Essential Airbnb Amenities in Sunrakh (2026)
Amenity Prevalence
Amenity Insights for Sunrakh
- Essential amenities in Sunrakh that guests expect include: Air conditioning, Free parking on premises. Lacking these (any) could significantly impact bookings.
- Popular amenities like Hot water, Wifi, Kitchen are common but not universal. Offering these can provide a competitive edge.
- Warning: Wifi is not universally provided but is considered essential globally. Ensure reliable Wifi is offered.
Recommendations for Hosts
- Ensure your listing includes all essential amenities for Sunrakh: Air conditioning, Free parking on premises.
- Prioritize adding missing essentials: Free parking on premises.
- Consider adding popular differentiators like Hot water or Wifi to increase appeal.
- Highlight unique or less common amenities you offer (e.g., hot tub, dedicated workspace, EV charger) in your listing description and photos.
- Regularly check competitor amenities in Sunrakh to stay competitive.
Sunrakh Airbnb Guest Demographics & Profile Analysis (2026)
Guest Profile Summary for Sunrakh
- The typical guest profile for Airbnb in Sunrakh consists of primarily domestic travelers (80%), often arriving from nearby New Delhi, typically belonging to the Post-2000s (Gen Z/Alpha) group (50%), primarily speaking English or Hindi.
- Domestic travelers account for 79.9% of guests.
- Key international markets include India (79.9%) and United States (5.4%).
- Top languages spoken are English (44.4%) followed by Hindi (39.6%).
- A significant demographic segment is the Post-2000s (Gen Z/Alpha) group, representing 50% of guests.
Recommendations for Hosts
- Target domestic marketing efforts towards travelers from New Delhi and Delhi.
- Tailor amenities and listing descriptions to appeal to the dominant Post-2000s (Gen Z/Alpha) demographic (e.g., highlight fast WiFi, smart home features, local guides).
- Highlight unique local experiences or amenities relevant to the primary guest profile.
- Consider seasonal promotions aligned with peak travel times for key origin markets.
Nearby Short-Term Rental Market Comparison
How does the Sunrakh Airbnb market stack up against its neighbors? Compare key performance metrics like average monthly revenue, ADR, and occupancy rates in surrounding areas to understand the broader regional STR landscape.
| Market | Active Properties | Monthly Revenue | Daily Rate | Avg. Occupancy |
|---|---|---|---|---|
| Bissar Akbarpur | 13 | $2,149 | $368.42 | 20% |
| Tauru | 14 | $565 | $159.68 | 15% |
| Bajidpur | 11 | $480 | $64.35 | 27% |
| New Delhi | 2,081 | $381 | $55.43 | 32% |
| libiza town | 11 | $380 | $132.31 | 21% |
| Gurugram District | 405 | $289 | $73.78 | 24% |
| Gurugram | 1,252 | $287 | $63.42 | 23% |
| Dwarka | 50 | $278 | $51.02 | 30% |
| Greater Noida | 203 | $262 | $71.19 | 23% |
| Chhatikara | 14 | $241 | $42.28 | 32% |