Noida Airbnb Market Analysis 2026: Short Term Rental Data & Vacation Rental Statistics in Uttar Pradesh, India
Is Airbnb profitable in Noida in 2026? Explore comprehensive Airbnb analytics for Noida, Uttar Pradesh, India to uncover income potential. This 2026 STR market report for Noida, based on AirROI data from February 2025 to January 2026, reveals key trends in the niche market of 141 active listings.
Whether you're considering an Airbnb investment in Noida, optimizing your existing vacation rental, or exploring rental arbitrage opportunities, understanding the Noida Airbnb data is crucial. Leveraging the low regulation environment is key to maximizing your short term rental income potential. Let's dive into the specifics.
Key Noida Airbnb Performance Metrics Overview
Monthly Airbnb Revenue Variations & Income Potential in Noida (2026)
Understanding the monthly revenue variations for Airbnb listings in Noida is key to maximizing your short term rental income potential. Seasonality significantly impacts earnings. Our analysis, based on data from the past 12 months, shows that the peak revenue month for STRs in Noida is typically April, while May often presents the lowest earnings, highlighting opportunities for strategic pricing adjustments during shoulder and low seasons. Explore the typical Airbnb income in Noida across different performance tiers:
- Best-in-class properties (Top 10%) achieve $1,147+ monthly, often utilizing dynamic pricing and superior guest experiences.
- Strong performing properties (Top 25%) earn $734 or more, indicating effective management and desirable locations/amenities.
- Typical properties (Median) generate around $392 per month, representing the average market performance.
- Entry-level properties (Bottom 25%) see earnings around $119, often with potential for optimization.
Average Monthly Airbnb Earnings Trend in Noida
Noida Airbnb Occupancy Rate Trends (2026)
Maximize your bookings by understanding the Noida STR occupancy trends. Seasonal demand shifts significantly influence how often properties are booked. Typically, Novembersees the highest demand (peak season occupancy), while May experiences the lowest (low season). Effective strategies, like adjusting minimum stays or offering promotions, can boost occupancy during slower periods. Here's how different property tiers perform in Noida:
- Best-in-class properties (Top 10%) achieve 54%+ occupancy, indicating high desirability and potentially optimized availability.
- Strong performing properties (Top 25%) maintain 36% or higher occupancy, suggesting good market fit and guest satisfaction.
- Typical properties (Median) have an occupancy rate around 19%.
- Entry-level properties (Bottom 25%) average 10% occupancy, potentially facing higher vacancy.
Average Monthly Occupancy Rate Trend in Noida
Average Daily Rate (ADR) Airbnb Trends in Noida (2026)
Effective short term rental pricing strategy in Noida involves understanding monthly ADR fluctuations. The Average Daily Rate (ADR) for Airbnb in Noida typically peaks in June and dips lowest during January. Leveraging Airbnb dynamic pricing tools or strategies based on this seasonality can significantly boost revenue. Here's a look at the typical nightly rates achieved:
- Best-in-class properties (Top 10%) command rates of $141+ per night, often due to premium features or locations.
- Strong performing properties (Top 25%) achieve nightly rates of $68 or more.
- Typical properties (Median) charge around $34 per night.
- Entry-level properties (Bottom 25%) earn around $22 per night.
Average Daily Rate (ADR) Trend by Month in Noida
Get Live Noida Market Intelligence 👇

Explore Real-time Analytics
Airbnb Seasonality Analysis & Trends in Noida (2026)
Peak Season (April, March, February)
- Revenue averages $946 per month
- Occupancy rates average 26.9%
- Daily rates average $65
Shoulder Season
- Revenue averages $445 per month
- Occupancy maintains around 27.8%
- Daily rates hold near $62
Low Season (January, May, August)
- Revenue drops to average $271 per month
- Occupancy decreases to average 18.0%
- Daily rates adjust to average $63
Seasonality Insights for Noida
- The Airbnb seasonality in Noida shows highly seasonal trends requiring careful strategy. While the sections above show seasonal averages, it's also insightful to look at the extremes:
- During the high season, the absolute peak month showcases Noida's highest earning potential, with monthly revenues capable of climbing to $1,017, occupancy reaching a high of 32.4%, and ADRs peaking at $73.
- Conversely, the slowest single month of the year, typically falling within the low season, marks the market's lowest point. In this month, revenue might dip to $226, occupancy could drop to 9.6%, and ADRs may adjust down to $52.
- Understanding both the seasonal averages and these monthly peaks and troughs in revenue, occupancy, and ADR is crucial for maximizing your Airbnb profit potential in Noida.
Seasonal Strategies for Maximizing Profit
- Peak Season: Maximize revenue through premium pricing and potentially longer minimum stays. Ensure high availability.
- Low Season: Offer competitive pricing, special promotions (e.g., extended stay discounts), and flexible cancellation policies. Target off-season travelers like remote workers or budget-conscious guests.
- Shoulder Seasons: Implement dynamic pricing that balances peak and low rates. Target weekend travelers or specific events. Offer slightly more flexible terms than peak season.
- Regularly analyze your own performance against these Noida seasonality benchmarks and adjust your pricing and availability strategy accordingly.
Best Areas for Airbnb Investment in Noida (2026)
Exploring the top neighborhoods for short-term rentals in Noida? This section highlights key areas, outlining why they are attractive for hosts and guests, along with notable local attractions. Consider these locations based on your target guest profile and investment strategy.
| Neighborhood / Area | Why Host Here? (Target Guests & Appeal) | Key Attractions & Landmarks |
|---|---|---|
| Sector 18 | The main shopping and entertainment hub of Noida, attracting locals and tourists alike. Ideal for hosting guests seeking proximity to major malls and dining options. | DLF Mall of India, Great India Place, Wave Mall, Amity University, Noida Film City |
| Sector 62 | A growing IT and business hub, home to many tech parks and corporate offices. Perfect for business travelers and professionals visiting the area. | Logix City Centre Mall, Cybiz Center, Stellar IT Park, HCL Technologies, Tech Mahindra |
| Sector 15 | A residential and commercial area with excellent connectivity. Close to popular markets and eateries, making it convenient for short-term rentals. | Noida Stadium, Botanical Garden, Sector 15 Market, Local eateries, Shiv Mandir |
| Noida Expressway | The expressway connects Noida to Delhi and is lined with residential projects and amenities. Attracts visitors for both leisure and business stays. | Jaypee Hospital, Tata Consultancy Services, Various tech parks, Noida Golf Course, Shopping complexes |
| Sector 50 | A well-established residential area with parks and recreational facilities. It appeals to families and long-term visitors looking for comfort and amenities. | Atta Market, Noida City Centre Metro Station, Park Area, Various restaurants, Shopping options |
| Sector 63 | Known for its IT parks and corporate offices. Attracts working professionals and visitors on business trips, making it a prime area for Airbnbs. | Advant Navis Business Park, Sector 63 Market, Shiv Nadar University, Multiple cafes, IT Park |
| Golf Course Road | An upscale area with luxury apartments and affluent residential projects. Ideal for tourists looking for a premium stay experience. | Noida Golf Course, Golf City, Residential complexes, Fine dining restaurants, Spas and wellness centers |
| Sector 76 | A developing sector with good connectivity and amenities. It is becoming a popular choice for travelers looking for a budget-friendly option close to the city. | Local markets, Parks and recreation areas, Transport accessibility, Nearby shopping areas, Restaurants |
Understanding Airbnb License Requirements & STR Laws in Noida (2026)
While Noida, Uttar Pradesh, India currently shows low STR regulations, specific Airbnb license requirements might still exist or change. Always verify the latest short term rental regulations and Airbnb license requirements directly with local government authorities for Noida to ensure full compliance before hosting.
(Source: AirROI data, 2026, finding no licensed listings among those analyzed)
Top Performing Airbnb Properties in Noida (2026)
Benchmark your potential! Explore examples of top-performing Airbnb properties in Noidabased on Trailing Twelve Month (TTM) revenue. Analyze their characteristics, revenue, occupancy rate, and ADR to understand what drives success in this market.
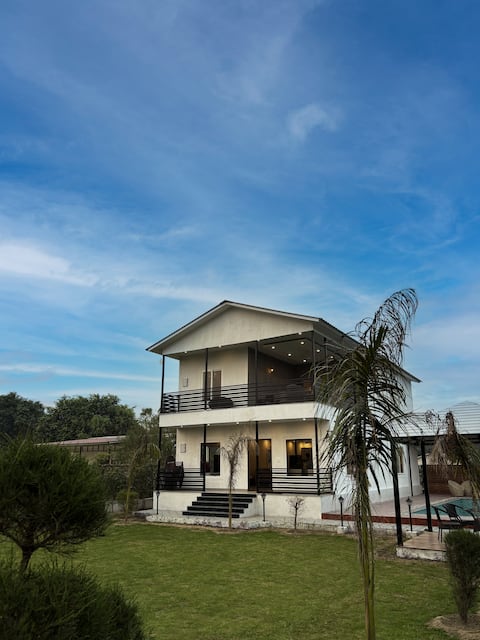
The Oasis: 4BHK Villa | Sec-135
Entire Place • 4 bedrooms

Noida | 8BR @Golfwood Manor
Entire Place • 8 bedrooms
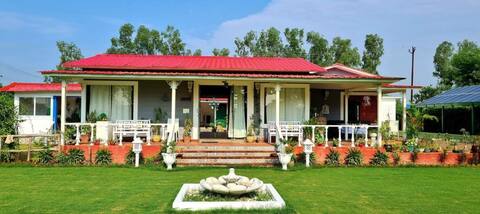
Baganbari - a picturesque farmstay
Entire Place • 3 bedrooms

Noida Golf course | 5BR Albatross Haven
Entire Place • 5 bedrooms
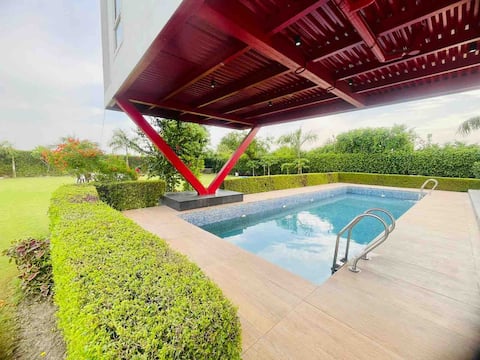
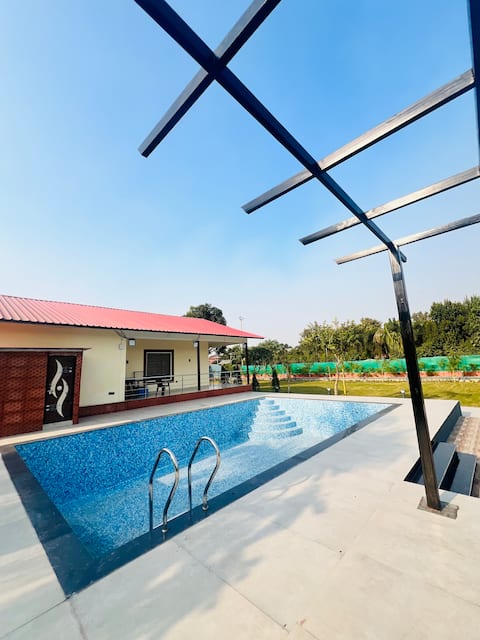
Stylish Farmhouse in Noida with pool! sector 135
Entire Place • 4 bedrooms
Devansh Farmhouse
Entire Place • 2 bedrooms
Note: Performance varies based on location, size, amenities, seasonality, and management quality. Data reflects the past 12 months.
Top Performing Airbnb Hosts in Noida (2026)
Learn from the best! This table showcases top-performing Airbnb hosts in Noida based on the number of properties managed and estimated total revenue over the past year. Analyze their scale and performance metrics.
| Host Name | Properties | Grossing Revenue | Stay Reviews | Avg Rating |
|---|---|---|---|---|
| Manpreet | 2 | $26,854 | 9 | 4.25/5.0 |
| Nandini | 1 | $24,437 | 22 | 4.95/5.0 |
| Vikas | 2 | $19,382 | 12 | 4.55/5.0 |
| Casa Luma | 3 | $16,687 | 61 | 4.85/5.0 |
| GoBravo Stays (Gobravostays) | 5 | $14,551 | 12 | 3.89/5.0 |
| Piyush | 5 | $13,297 | 40 | 4.61/5.0 |
| Ashish | 1 | $13,096 | 28 | 4.86/5.0 |
| Rajesh | 3 | $9,777 | 543 | 4.84/5.0 |
| Mohit | 1 | $9,671 | 1 | Not Rated |
| Vijay | 1 | $8,642 | 38 | 4.08/5.0 |
Analyzing the strategies of top hosts, such as their property selection, pricing, and guest communication, can offer valuable lessons for optimizing your own Airbnb operations in Noida.
Dive Deeper: Advanced Noida STR Market Data (2026)
Ready to unlock more insights? AirROI provides access to advanced metrics and comprehensive Airbnb data for Noida. Explore detailed analytics beyond this report to refine your investment strategy, optimize pricing, and maximize your vacation rental profits.
Explore Advanced MetricsNoida Short-Term Rental Market Composition (2026): Property & Room Types
Room Type Distribution
Property Type Distribution
Market Composition Insights for Noida
- The Noida Airbnb market composition is heavily skewed towards Entire Home/Apt listings, which make up 82.3% of the 141 active rentals. This indicates strong guest preference for privacy and space.
- Looking at the property type distribution in Noida, Apartment/Condo properties are the most common (62.4%), reflecting the local real estate landscape.
- Smaller segments like hotel/boutique (combined 4.3%) offer potential for unique stay experiences.
Noida Airbnb Room Capacity Analysis (2026): Bedroom Distribution
Distribution of Listings by Number of Bedrooms
Room Capacity Insights for Noida
- The dominant room capacity in Noida is 1 bedroom listings, making up 51.8% of the market. This suggests a strong demand for properties suitable for couples or solo travelers.
- Together, 1 bedroom and 3 bedrooms properties represent 66.7% of the active Airbnb listings in Noida, indicating a high concentration in these sizes.
- With over half the market (51.8%) consisting of studios or 1-bedroom units, Noida is particularly well-suited for individuals or couples.
- A significant 22.0% of listings offer 3+ bedrooms, catering to larger groups and families seeking more space in Noida.
Noida Vacation Rental Guest Capacity Trends (2026)
Distribution of Listings by Guest Capacity
Guest Capacity Insights for Noida
- The most common guest capacity trend in Noida vacation rentals is listings accommodating 2 guests (32.6%). This suggests the primary traveler segment is likely couples or solo travelers.
- Properties designed for 2 guests and 8+ guests dominate the Noida STR market, accounting for 63.1% of listings.
- 34.0% of properties accommodate 6+ guests, serving the market segment for larger families or group travel in Noida.
- On average, properties in Noida are equipped to host 4.0 guests.
Noida Airbnb Booking Patterns (2026): Available vs. Booked Days
Available Days Distribution
Booked Days Distribution
Booking Pattern Insights for Noida
- The most common availability pattern in Noida falls within the 271-366 days range, representing 88.7% of listings. This suggests many properties have significant open periods on their calendars.
- Approximately 99.3% of listings show high availability (181+ days open annually), indicating potential for increased bookings or specific owner usage patterns.
- For booked days, the 1-30 days range is most frequent in Noida (49.6%), reflecting common guest stay durations or potential owner blocking patterns.
- A notable 0.7% of properties secure long booking periods (181+ days booked per year), highlighting successful long-term rental strategies or significant owner usage.
Noida Airbnb Minimum Stay Requirements Analysis
Distribution of Listings by Minimum Night Requirement
1 Night
132 listings
93.6% of total
2 Nights
4 listings
2.8% of total
4-6 Nights
1 listings
0.7% of total
30+ Nights
4 listings
2.8% of total
Key Insights
- The most prevalent minimum stay requirement in Noida is 1 Night, adopted by 93.6% of listings. This highlights the market's preference for shorter, flexible bookings.
- A strong majority (96.4%) of the Noida Airbnb data shows acceptance of very short stays (1-2 nights), indicating a dynamic, high-turnover market.
- Dedicated monthly rentals (30+ nights) represent a small niche (2.8%), possibly an untapped area for hosts.
Recommendations
- Align with the market by considering a 1 Night minimum stay, as 93.6% of Noida hosts use this setting.
- Adjust minimum nights based on seasonality – potentially shorter during low season and longer during peak demand periods in Noida.
Noida Airbnb Cancellation Policy Trends Analysis (2026)
Limited
4 listings
2.8% of total
Flexible
78 listings
55.3% of total
Moderate
41 listings
29.1% of total
Firm
11 listings
7.8% of total
Strict
7 listings
5% of total
Cancellation Policy Insights for Noida
- The prevailing Airbnb cancellation policy trend in Noida is Flexible, used by 55.3% of listings.
- The market strongly favors guest-friendly terms, with 84.4% of listings offering Flexible or Moderate policies. This suggests guests in Noida may expect booking flexibility.
- Strict cancellation policies are quite rare (5%), potentially making listings with this policy less competitive unless justified by high demand or property type.
Recommendations for Hosts
- Consider adopting a Flexible policy to align with the 55.3% market standard in Noida.
- Given the high prevalence of Flexible policies (55.3%), offering this can enhance booking appeal, especially during shoulder seasons.
- Using a Strict policy might deter some guests, as only 5% of listings use it. Evaluate if potential revenue protection outweighs possible lower booking rates.
- Regularly review your cancellation policy against competitors and market demand shifts in Noida.
Noida STR Booking Lead Time Analysis (2026)
Average Booking Lead Time by Month
Booking Lead Time Insights for Noida
- The overall average booking lead time for vacation rentals in Noida is 10 days.
- Guests book furthest in advance for stays during November (average 22 days), likely coinciding with peak travel demand or local events.
- The shortest booking windows occur for stays in May (average 3 days), indicating more last-minute travel plans during this time.
- Seasonally, Fall (15 days avg.) sees the longest lead times, while Spring (5 days avg.) has the shortest, reflecting typical travel planning cycles.
Recommendations for Hosts
- Use the overall average lead time (10 days) as a baseline for your pricing and availability strategy in Noida.
- For November stays, consider implementing length-of-stay discounts or slightly higher rates for bookings made less than 22 days out to capitalize on advance planning.
- Target marketing efforts for the Fall season well in advance (at least 15 days) to capture early planners.
- Monitor your own booking lead times against these Noida averages to identify opportunities for dynamic pricing adjustments.
Popular & Essential Airbnb Amenities in Noida (2026)
Amenity Prevalence
Amenity Insights for Noida
- Essential amenities in Noida that guests expect include: Wifi, Air conditioning. Lacking these (any) could significantly impact bookings.
- Popular amenities like Kitchen, TV, Cooking basics are common but not universal. Offering these can provide a competitive edge.
Recommendations for Hosts
- Ensure your listing includes all essential amenities for Noida: Wifi, Air conditioning.
- Prioritize adding missing essentials: Air conditioning.
- Consider adding popular differentiators like Kitchen or TV to increase appeal.
- Highlight unique or less common amenities you offer (e.g., hot tub, dedicated workspace, EV charger) in your listing description and photos.
- Regularly check competitor amenities in Noida to stay competitive.
Noida Airbnb Guest Demographics & Profile Analysis (2026)
Guest Profile Summary for Noida
- The typical guest profile for Airbnb in Noida consists of primarily domestic travelers (86%), often arriving from nearby New Delhi, typically belonging to the Post-2000s (Gen Z/Alpha) group (50%), primarily speaking English or Hindi.
- Domestic travelers account for 85.5% of guests.
- Key international markets include India (85.5%) and United States (3.5%).
- Top languages spoken are English (45.6%) followed by Hindi (39.7%).
- A significant demographic segment is the Post-2000s (Gen Z/Alpha) group, representing 50% of guests.
Recommendations for Hosts
- Target domestic marketing efforts towards travelers from New Delhi and Delhi.
- Tailor amenities and listing descriptions to appeal to the dominant Post-2000s (Gen Z/Alpha) demographic (e.g., highlight fast WiFi, smart home features, local guides).
- Highlight unique local experiences or amenities relevant to the primary guest profile.
- Consider seasonal promotions aligned with peak travel times for key origin markets.
Nearby Short-Term Rental Market Comparison
How does the Noida Airbnb market stack up against its neighbors? Compare key performance metrics like average monthly revenue, ADR, and occupancy rates in surrounding areas to understand the broader regional STR landscape.
| Market | Active Properties | Monthly Revenue | Daily Rate | Avg. Occupancy |
|---|---|---|---|---|
| Bissar Akbarpur | 13 | $2,149 | $368.42 | 20% |
| Tauru | 14 | $565 | $159.68 | 15% |
| Bajidpur | 11 | $480 | $64.35 | 27% |
| New Delhi | 2,081 | $381 | $55.43 | 32% |
| libiza town | 11 | $380 | $132.31 | 21% |
| Sunrakh | 53 | $335 | $61.47 | 31% |
| Gurugram District | 405 | $289 | $73.78 | 24% |
| Gurugram | 1,252 | $287 | $63.42 | 23% |
| Dwarka | 50 | $278 | $51.02 | 30% |
| Greater Noida | 203 | $262 | $71.19 | 23% |