Mathura Airbnb Market Analysis 2026: Short Term Rental Data & Vacation Rental Statistics in Uttar Pradesh, India
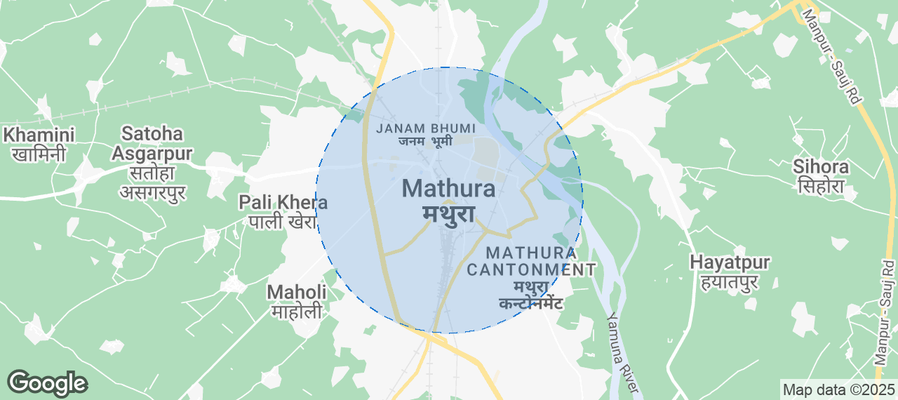
Is Airbnb profitable in Mathura in 2026? Explore comprehensive Airbnb analytics for Mathura, Uttar Pradesh, India to uncover income potential. This 2026 STR market report for Mathura, based on AirROI data from February 2025 to January 2026, reveals key trends in the niche market of 63 active listings.
Whether you're considering an Airbnb investment in Mathura, optimizing your existing vacation rental, or exploring rental arbitrage opportunities, understanding the Mathura Airbnb data is crucial. Leveraging the low regulation environment is key to maximizing your short term rental income potential. Let's dive into the specifics.
Key Mathura Airbnb Performance Metrics Overview
Monthly Airbnb Revenue Variations & Income Potential in Mathura (2026)
Understanding the monthly revenue variations for Airbnb listings in Mathura is key to maximizing your short term rental income potential. Seasonality significantly impacts earnings. Our analysis, based on data from the past 12 months, shows that the peak revenue month for STRs in Mathura is typically December, while May often presents the lowest earnings, highlighting opportunities for strategic pricing adjustments during shoulder and low seasons. Explore the typical Airbnb income in Mathura across different performance tiers:
- Best-in-class properties (Top 10%) achieve $880+ monthly, often utilizing dynamic pricing and superior guest experiences.
- Strong performing properties (Top 25%) earn $477 or more, indicating effective management and desirable locations/amenities.
- Typical properties (Median) generate around $237 per month, representing the average market performance.
- Entry-level properties (Bottom 25%) see earnings around $116, often with potential for optimization.
Average Monthly Airbnb Earnings Trend in Mathura
Mathura Airbnb Occupancy Rate Trends (2026)
Maximize your bookings by understanding the Mathura STR occupancy trends. Seasonal demand shifts significantly influence how often properties are booked. Typically, Marchsees the highest demand (peak season occupancy), while May experiences the lowest (low season). Effective strategies, like adjusting minimum stays or offering promotions, can boost occupancy during slower periods. Here's how different property tiers perform in Mathura:
- Best-in-class properties (Top 10%) achieve 66%+ occupancy, indicating high desirability and potentially optimized availability.
- Strong performing properties (Top 25%) maintain 48% or higher occupancy, suggesting good market fit and guest satisfaction.
- Typical properties (Median) have an occupancy rate around 28%.
- Entry-level properties (Bottom 25%) average 14% occupancy, potentially facing higher vacancy.
Average Monthly Occupancy Rate Trend in Mathura
Average Daily Rate (ADR) Airbnb Trends in Mathura (2026)
Effective short term rental pricing strategy in Mathura involves understanding monthly ADR fluctuations. The Average Daily Rate (ADR) for Airbnb in Mathura typically peaks in December and dips lowest during February. Leveraging Airbnb dynamic pricing tools or strategies based on this seasonality can significantly boost revenue. Here's a look at the typical nightly rates achieved:
- Best-in-class properties (Top 10%) command rates of $65+ per night, often due to premium features or locations.
- Strong performing properties (Top 25%) achieve nightly rates of $47 or more.
- Typical properties (Median) charge around $30 per night.
- Entry-level properties (Bottom 25%) earn around $22 per night.
Average Daily Rate (ADR) Trend by Month in Mathura
Get Live Mathura Market Intelligence 👇
Explore Real-time Analytics
Airbnb Seasonality Analysis & Trends in Mathura (2026)
Peak Season (December, March, October)
- Revenue averages $448 per month
- Occupancy rates average 40.4%
- Daily rates average $38
Shoulder Season
- Revenue averages $355 per month
- Occupancy maintains around 33.0%
- Daily rates hold near $37
Low Season (January, April, May)
- Revenue drops to average $262 per month
- Occupancy decreases to average 24.7%
- Daily rates adjust to average $37
Seasonality Insights for Mathura
- The Airbnb seasonality in Mathura shows highly seasonal trends requiring careful strategy. While the sections above show seasonal averages, it's also insightful to look at the extremes:
- During the high season, the absolute peak month showcases Mathura's highest earning potential, with monthly revenues capable of climbing to $481, occupancy reaching a high of 41.8%, and ADRs peaking at $39.
- Conversely, the slowest single month of the year, typically falling within the low season, marks the market's lowest point. In this month, revenue might dip to $191, occupancy could drop to 18.1%, and ADRs may adjust down to $36.
- Understanding both the seasonal averages and these monthly peaks and troughs in revenue, occupancy, and ADR is crucial for maximizing your Airbnb profit potential in Mathura.
Seasonal Strategies for Maximizing Profit
- Peak Season: Maximize revenue through premium pricing and potentially longer minimum stays. Ensure high availability.
- Low Season: Offer competitive pricing, special promotions (e.g., extended stay discounts), and flexible cancellation policies. Target off-season travelers like remote workers or budget-conscious guests.
- Shoulder Seasons: Implement dynamic pricing that balances peak and low rates. Target weekend travelers or specific events. Offer slightly more flexible terms than peak season.
- Regularly analyze your own performance against these Mathura seasonality benchmarks and adjust your pricing and availability strategy accordingly.
Best Areas for Airbnb Investment in Mathura (2026)
Exploring the top neighborhoods for short-term rentals in Mathura? This section highlights key areas, outlining why they are attractive for hosts and guests, along with notable local attractions. Consider these locations based on your target guest profile and investment strategy.
| Neighborhood / Area | Why Host Here? (Target Guests & Appeal) | Key Attractions & Landmarks |
|---|---|---|
| Krishna Janmabhoomi | The birthplace of Lord Krishna, this area is a major pilgrimage site attracting devout visitors year-round. Its spiritual significance ensures a steady stream of tourists seeking accommodation. | Krishna Janmabhoomi Temple, Dwarkadhish Temple, Vishram Ghat, Keshav Deo Temple, Rangji Temple |
| Vrindavan | Famous for its temples and gardens, Vrindavan is a vibrant town steeped in the culture of Lord Krishna. Its proximity to Mathura makes it an ideal locale for visitors wishing to explore both towns. | Banke Bihari Temple, Iskcon Vrindavan, Radha Vallabh Temple, Gita Mandir, Seva Kunj |
| Nandgaon | A quiet village that is part of the Krishna Circuit, known for its serene environment and connection to Krishna's childhood. It appeals to tourists looking for peaceful retreats. | Nand Baba Temple, Kradha Rani Temple, Nandgaon Ghat |
| Govardhan | Significant in Hindu mythology, this area attracts many pilgrims and tourists wishing to engage with religious traditions and the natural beauty of the Giriraj Hill. | Govardhan Hill, Radha Kund, Shri Govind Dev Ji Temple |
| Mathura Cantonment | An urban area with modern amenities, this locale is suitable for both leisure and business travelers, providing easy access to Mathura and its attractions. | Cantonment Park, Shree Radha Ras Bihari Ashtakshar Mandir, local markets |
| Chhatikara | A small town close to Vrindavan, popular for visitors who want to experience local culture while having access to the attractions of both Mathura and Vrindavan. | Chhatikara Market, local food stalls, cultural events |
| Shahjahanpur | A historical town with a rich heritage, drawing visitors interested in exploring the regional history alongside their religious journey in Mathura. | Shahjahanpur Fort, local temples, historical sites |
| Raja Suryanarayan Palace | An inviting area that combines history with modern accommodations, making it perfect for travelers interested in the cultural richness of Mathura while enjoying comfortable stays. | Raja Suryanarayan Palace, local art galleries, cultural festivals |
Understanding Airbnb License Requirements & STR Laws in Mathura (2026)
While Mathura, Uttar Pradesh, India currently shows low STR regulations, specific Airbnb license requirements might still exist or change. Always verify the latest short term rental regulations and Airbnb license requirements directly with local government authorities for Mathura to ensure full compliance before hosting.
(Source: AirROI data, 2026, based on 3% licensed listings)
Top Performing Airbnb Properties in Mathura (2026)
Benchmark your potential! Explore examples of top-performing Airbnb properties in Mathurabased on Trailing Twelve Month (TTM) revenue. Analyze their characteristics, revenue, occupancy rate, and ADR to understand what drives success in this market.
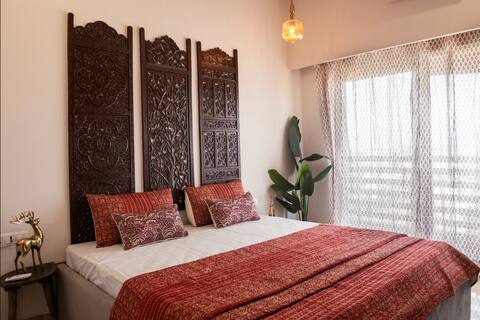
A Modern Family stay at highest point of Vrindavan
Entire Place • 2 bedrooms
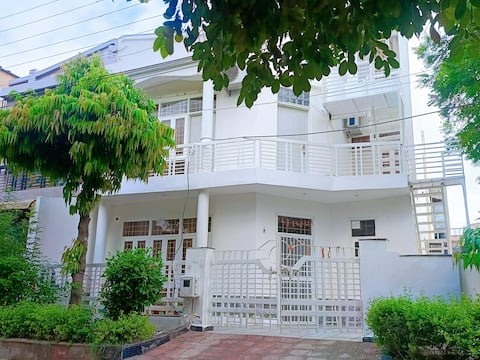
3 bedroom #Shared Hall #Grih Delight Vrindavan
Entire Place • 3 bedrooms
2 Bedroom #1stFloor #Shared Kitchen #Grih Delight
Private Room • 2 bedrooms

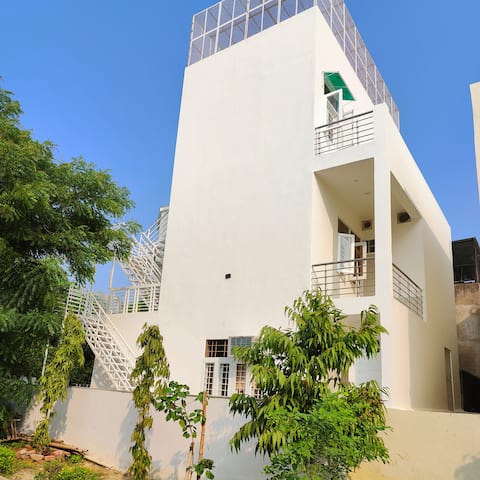
Namah 2BHK Resort Stay- Near Prem Mandir
Entire Place • 2 bedrooms

Artistic Haven: ShantiVan Retreat by Prime Temples
Entire Place • 1 bedroom
Namah 2BHK Resort Homestay-4 Mins from Prem mandir
Entire Place • 2 bedrooms
Note: Performance varies based on location, size, amenities, seasonality, and management quality. Data reflects the past 12 months.
Top Performing Airbnb Hosts in Mathura (2026)
Learn from the best! This table showcases top-performing Airbnb hosts in Mathura based on the number of properties managed and estimated total revenue over the past year. Analyze their scale and performance metrics.
| Host Name | Properties | Grossing Revenue | Stay Reviews | Avg Rating |
|---|---|---|---|---|
| Keshav | 3 | $29,441 | 134 | 4.98/5.0 |
| Madhuri | 5 | $27,345 | 154 | 4.87/5.0 |
| Saurabh | 2 | $15,879 | 91 | 4.53/5.0 |
| Tarun | 2 | $10,265 | 178 | 4.96/5.0 |
| Girdhari | 4 | $9,566 | 24 | 4.38/5.0 |
| Sweta | 1 | $6,690 | 64 | 4.67/5.0 |
| Shretima | 1 | $6,465 | 97 | 4.89/5.0 |
| Peeush | 1 | $5,183 | 39 | 4.92/5.0 |
| Pravan | 1 | $4,799 | 71 | 4.93/5.0 |
| Nitin | 1 | $4,119 | 27 | 4.70/5.0 |
Analyzing the strategies of top hosts, such as their property selection, pricing, and guest communication, can offer valuable lessons for optimizing your own Airbnb operations in Mathura.
Dive Deeper: Advanced Mathura STR Market Data (2026)
Ready to unlock more insights? AirROI provides access to advanced metrics and comprehensive Airbnb data for Mathura. Explore detailed analytics beyond this report to refine your investment strategy, optimize pricing, and maximize your vacation rental profits.
Explore Advanced MetricsMathura Short-Term Rental Market Composition (2026): Property & Room Types
Room Type Distribution
Property Type Distribution
Market Composition Insights for Mathura
- The Mathura Airbnb market composition is heavily skewed towards Entire Home/Apt listings, which make up 68.3% of the 63 active rentals. This indicates strong guest preference for privacy and space.
- However, a notable 31.7% share for Private Rooms suggests opportunities for budget-conscious travelers or hosts renting out spare rooms.
- Looking at the property type distribution in Mathura, Apartment/Condo properties are the most common (46%), reflecting the local real estate landscape.
- Houses represent a significant 41.3% portion, catering likely to families or larger groups.
- The presence of 7.9% Hotel/Boutique listings indicates integration with traditional hospitality.
- Smaller segments like unique stays, outdoor/unique (combined 4.8%) offer potential for unique stay experiences.
Mathura Airbnb Room Capacity Analysis (2026): Bedroom Distribution
Distribution of Listings by Number of Bedrooms
Room Capacity Insights for Mathura
- The dominant room capacity in Mathura is 1 bedroom listings, making up 50.8% of the market. This suggests a strong demand for properties suitable for couples or solo travelers.
- Together, 1 bedroom and 2 bedrooms properties represent 76.2% of the active Airbnb listings in Mathura, indicating a high concentration in these sizes.
- With over half the market (50.8%) consisting of studios or 1-bedroom units, Mathura is particularly well-suited for individuals or couples.
- Listings with 3+ bedrooms (6.4%) represent a smaller niche, potentially indicating an underserved market for larger group accommodations in Mathura.
Mathura Vacation Rental Guest Capacity Trends (2026)
Distribution of Listings by Guest Capacity
Guest Capacity Insights for Mathura
- The most common guest capacity trend in Mathura vacation rentals is listings accommodating 4 guests (23.8%). This suggests the primary traveler segment is likely small families or groups.
- Properties designed for 4 guests and 3 guests dominate the Mathura STR market, accounting for 39.7% of listings.
- 27.0% of properties accommodate 6+ guests, serving the market segment for larger families or group travel in Mathura.
- On average, properties in Mathura are equipped to host 3.6 guests.
Mathura Airbnb Booking Patterns (2026): Available vs. Booked Days
Available Days Distribution
Booked Days Distribution
Booking Pattern Insights for Mathura
- The most common availability pattern in Mathura falls within the 271-366 days range, representing 69.8% of listings. This suggests many properties have significant open periods on their calendars.
- Approximately 88.8% of listings show high availability (181+ days open annually), indicating potential for increased bookings or specific owner usage patterns.
- For booked days, the 1-30 days range is most frequent in Mathura (38.1%), reflecting common guest stay durations or potential owner blocking patterns.
- A notable 11.1% of properties secure long booking periods (181+ days booked per year), highlighting successful long-term rental strategies or significant owner usage.
Mathura Airbnb Minimum Stay Requirements Analysis
Distribution of Listings by Minimum Night Requirement
1 Night
60 listings
95.2% of total
2 Nights
1 listings
1.6% of total
7-29 Nights
1 listings
1.6% of total
30+ Nights
1 listings
1.6% of total
Key Insights
- The most prevalent minimum stay requirement in Mathura is 1 Night, adopted by 95.2% of listings. This highlights the market's preference for shorter, flexible bookings.
- A strong majority (96.8%) of the Mathura Airbnb data shows acceptance of very short stays (1-2 nights), indicating a dynamic, high-turnover market.
- Dedicated monthly rentals (30+ nights) represent a small niche (1.6%), possibly an untapped area for hosts.
Recommendations
- Align with the market by considering a 1 Night minimum stay, as 95.2% of Mathura hosts use this setting.
- Adjust minimum nights based on seasonality – potentially shorter during low season and longer during peak demand periods in Mathura.
Mathura Airbnb Cancellation Policy Trends Analysis (2026)
Limited
4 listings
6.3% of total
Flexible
28 listings
44.4% of total
Moderate
25 listings
39.7% of total
Firm
6 listings
9.5% of total
Cancellation Policy Insights for Mathura
- The prevailing Airbnb cancellation policy trend in Mathura is Flexible, used by 44.4% of listings.
- The market strongly favors guest-friendly terms, with 84.1% of listings offering Flexible or Moderate policies. This suggests guests in Mathura may expect booking flexibility.
Recommendations for Hosts
- Consider adopting a Flexible policy to align with the 44.4% market standard in Mathura.
- Regularly review your cancellation policy against competitors and market demand shifts in Mathura.
Mathura STR Booking Lead Time Analysis (2026)
Average Booking Lead Time by Month
Booking Lead Time Insights for Mathura
- The overall average booking lead time for vacation rentals in Mathura is 16 days.
- Guests book furthest in advance for stays during October (average 23 days), likely coinciding with peak travel demand or local events.
- The shortest booking windows occur for stays in July (average 9 days), indicating more last-minute travel plans during this time.
- Seasonally, Fall (19 days avg.) sees the longest lead times, while Winter (13 days avg.) has the shortest, reflecting typical travel planning cycles.
Recommendations for Hosts
- Use the overall average lead time (16 days) as a baseline for your pricing and availability strategy in Mathura.
- Target marketing efforts for the Fall season well in advance (at least 19 days) to capture early planners.
- Monitor your own booking lead times against these Mathura averages to identify opportunities for dynamic pricing adjustments.
Popular & Essential Airbnb Amenities in Mathura (2026)
Amenity Prevalence
Amenity Insights for Mathura
- Essential amenities in Mathura that guests expect include: Air conditioning. Lacking these (this) could significantly impact bookings.
- Popular amenities like Wifi, Free parking on premises, Hot water are common but not universal. Offering these can provide a competitive edge.
- Warning: Wifi is not universally provided but is considered essential globally. Ensure reliable Wifi is offered.
Recommendations for Hosts
- Ensure your listing includes all essential amenities for Mathura: Air conditioning.
- Prioritize adding missing essentials: Air conditioning.
- Consider adding popular differentiators like Wifi or Free parking on premises to increase appeal.
- Highlight unique or less common amenities you offer (e.g., hot tub, dedicated workspace, EV charger) in your listing description and photos.
- Regularly check competitor amenities in Mathura to stay competitive.
Mathura Airbnb Guest Demographics & Profile Analysis (2026)
Guest Profile Summary for Mathura
- The typical guest profile for Airbnb in Mathura consists of primarily domestic travelers (80%), often arriving from nearby New Delhi, typically belonging to the Post-2000s (Gen Z/Alpha) group (50%), primarily speaking English or Hindi.
- Domestic travelers account for 80.0% of guests.
- Key international markets include India (80%) and Canada (6%).
- Top languages spoken are English (42.2%) followed by Hindi (35.6%).
- A significant demographic segment is the Post-2000s (Gen Z/Alpha) group, representing 50% of guests.
Recommendations for Hosts
- Target domestic marketing efforts towards travelers from New Delhi and Noida.
- Tailor amenities and listing descriptions to appeal to the dominant Post-2000s (Gen Z/Alpha) demographic (e.g., highlight fast WiFi, smart home features, local guides).
- Highlight unique local experiences or amenities relevant to the primary guest profile.
- Consider seasonal promotions aligned with peak travel times for key origin markets.
Nearby Short-Term Rental Market Comparison
How does the Mathura Airbnb market stack up against its neighbors? Compare key performance metrics like average monthly revenue, ADR, and occupancy rates in surrounding areas to understand the broader regional STR landscape.
| Market | Active Properties | Monthly Revenue | Daily Rate | Avg. Occupancy |
|---|---|---|---|---|
| Bissar Akbarpur | 13 | $2,149 | $368.42 | 20% |
| Tauru | 14 | $565 | $159.68 | 15% |
| Bajidpur | 11 | $480 | $64.35 | 27% |
| New Delhi | 2,081 | $381 | $55.43 | 32% |
| libiza town | 11 | $380 | $132.31 | 21% |
| Sunrakh | 53 | $335 | $61.47 | 31% |
| Gurugram District | 405 | $289 | $73.78 | 24% |
| Gurugram | 1,252 | $287 | $63.42 | 23% |
| Dwarka | 50 | $278 | $51.02 | 30% |
| Greater Noida | 203 | $262 | $71.19 | 23% |