Greater Noida Airbnb Market Analysis 2026: Short Term Rental Data & Vacation Rental Statistics in Uttar Pradesh, India
Is Airbnb profitable in Greater Noida in 2026? Explore comprehensive Airbnb analytics for Greater Noida, Uttar Pradesh, India to uncover income potential. This 2026 STR market report for Greater Noida, based on AirROI data from February 2025 to January 2026, reveals key trends in the market of 203 active listings.
Whether you're considering an Airbnb investment in Greater Noida, optimizing your existing vacation rental, or exploring rental arbitrage opportunities, understanding the Greater Noida Airbnb data is crucial. Leveraging the low regulation environment is key to maximizing your short term rental income potential. Let's dive into the specifics.
Key Greater Noida Airbnb Performance Metrics Overview
Monthly Airbnb Revenue Variations & Income Potential in Greater Noida (2026)
Understanding the monthly revenue variations for Airbnb listings in Greater Noida is key to maximizing your short term rental income potential. Seasonality significantly impacts earnings. Our analysis, based on data from the past 12 months, shows that the peak revenue month for STRs in Greater Noida is typically November, while July often presents the lowest earnings, highlighting opportunities for strategic pricing adjustments during shoulder and low seasons. Explore the typical Airbnb income in Greater Noida across different performance tiers:
- Best-in-class properties (Top 10%) achieve $1,076+ monthly, often utilizing dynamic pricing and superior guest experiences.
- Strong performing properties (Top 25%) earn $540 or more, indicating effective management and desirable locations/amenities.
- Typical properties (Median) generate around $219 per month, representing the average market performance.
- Entry-level properties (Bottom 25%) see earnings around $93, often with potential for optimization.
Average Monthly Airbnb Earnings Trend in Greater Noida
Greater Noida Airbnb Occupancy Rate Trends (2026)
Maximize your bookings by understanding the Greater Noida STR occupancy trends. Seasonal demand shifts significantly influence how often properties are booked. Typically, Februarysees the highest demand (peak season occupancy), while January experiences the lowest (low season). Effective strategies, like adjusting minimum stays or offering promotions, can boost occupancy during slower periods. Here's how different property tiers perform in Greater Noida:
- Best-in-class properties (Top 10%) achieve 53%+ occupancy, indicating high desirability and potentially optimized availability.
- Strong performing properties (Top 25%) maintain 31% or higher occupancy, suggesting good market fit and guest satisfaction.
- Typical properties (Median) have an occupancy rate around 18%.
- Entry-level properties (Bottom 25%) average 9% occupancy, potentially facing higher vacancy.
Average Monthly Occupancy Rate Trend in Greater Noida
Average Daily Rate (ADR) Airbnb Trends in Greater Noida (2026)
Effective short term rental pricing strategy in Greater Noida involves understanding monthly ADR fluctuations. The Average Daily Rate (ADR) for Airbnb in Greater Noida typically peaks in September and dips lowest during June. Leveraging Airbnb dynamic pricing tools or strategies based on this seasonality can significantly boost revenue. Here's a look at the typical nightly rates achieved:
- Best-in-class properties (Top 10%) command rates of $164+ per night, often due to premium features or locations.
- Strong performing properties (Top 25%) achieve nightly rates of $65 or more.
- Typical properties (Median) charge around $30 per night.
- Entry-level properties (Bottom 25%) earn around $21 per night.
Average Daily Rate (ADR) Trend by Month in Greater Noida
Get Live Greater Noida Market Intelligence 👇

Explore Real-time Analytics
Airbnb Seasonality Analysis & Trends in Greater Noida (2026)
Peak Season (November, September, October)
- Revenue averages $745 per month
- Occupancy rates average 25.5%
- Daily rates average $80
Shoulder Season
- Revenue averages $505 per month
- Occupancy maintains around 25.3%
- Daily rates hold near $72
Low Season (March, June, July)
- Revenue drops to average $281 per month
- Occupancy decreases to average 20.0%
- Daily rates adjust to average $63
Seasonality Insights for Greater Noida
- The Airbnb seasonality in Greater Noida shows highly seasonal trends requiring careful strategy. While the sections above show seasonal averages, it's also insightful to look at the extremes:
- During the high season, the absolute peak month showcases Greater Noida's highest earning potential, with monthly revenues capable of climbing to $879, occupancy reaching a high of 36.2%, and ADRs peaking at $91.
- Conversely, the slowest single month of the year, typically falling within the low season, marks the market's lowest point. In this month, revenue might dip to $271, occupancy could drop to 19.1%, and ADRs may adjust down to $59.
- Understanding both the seasonal averages and these monthly peaks and troughs in revenue, occupancy, and ADR is crucial for maximizing your Airbnb profit potential in Greater Noida.
Seasonal Strategies for Maximizing Profit
- Peak Season: Maximize revenue through premium pricing and potentially longer minimum stays. Ensure high availability.
- Low Season: Offer competitive pricing, special promotions (e.g., extended stay discounts), and flexible cancellation policies. Target off-season travelers like remote workers or budget-conscious guests.
- Shoulder Seasons: Implement dynamic pricing that balances peak and low rates. Target weekend travelers or specific events. Offer slightly more flexible terms than peak season.
- Regularly analyze your own performance against these Greater Noida seasonality benchmarks and adjust your pricing and availability strategy accordingly.
Best Areas for Airbnb Investment in Greater Noida (2026)
Exploring the top neighborhoods for short-term rentals in Greater Noida? This section highlights key areas, outlining why they are attractive for hosts and guests, along with notable local attractions. Consider these locations based on your target guest profile and investment strategy.
| Neighborhood / Area | Why Host Here? (Target Guests & Appeal) | Key Attractions & Landmarks |
|---|---|---|
| Sector 18 | Commercial hub of Greater Noida with shopping malls, restaurants, and entertainment options. Popular among tourists and locals for shopping and dining, making it an attractive spot for Airbnb. | Great India Place, DLF Mall of Noida, Noida Golf Course, Wave Cinemas, Sector 18 Market |
| Alpha Commercial Belt | Major commercial and business center in Greater Noida with easy access to offices and corporate buildings. Ideal for business travelers and short-term stays. | India Exposition Mart, Baba Balaknath Temple, Knowledge Park, Crown Interiorz Mall, BSP Park |
| Jaypee Green | A premium residential area known for its golf course and luxury living. Attracts tourists for recreational activities and upscale accommodations. | Jaypee Green Golf Course, Jaypee Hospital, Surajpur Bird Sanctuary, Buddh International Circuit, Yamuna Expressway |
| Sector 150 | A well-planned sector with parks and green spaces, appealing to families and nature lovers. Good for those seeking a quiet stay near urban amenities. | Proposed Noida International Airport, Sector 150 Park, Golf Course, Shiv Nadar University, Expressway and Metro Connectivity |
| Knowledge Park | Educational and institutional hub, attracting students and professionals. Ideal for hosting short stays for visitors of nearby universities and colleges. | Galgotias University, Sharda University, IIMT College of Management, Sharda Hospital, Knowledge Park 1 |
| Surajpur | A growing area close to industrial zones and tech parks, catering to business travelers and industrial professionals. | Surajpur Wetland, Industrial Area, Beta II Market, Shiv Mandir, Tech Zone |
| Sector 1 | An emerging residential area with developing infrastructure. Attractive for guests looking for affordable stays in a peaceful neighborhood. | Sarai Industrial Area, Residential Parks, Local Markets, Parks and Recreation, Proximity to major roads |
| NEEDY Airport Road | New area gaining popularity due to the proposed international airport, making it a prime location for future tourist attracts and investors. | Proposed Airport, Educational Institutions, Shopping and Entertainment, Well-Planned Roads, Green Spaces |
Understanding Airbnb License Requirements & STR Laws in Greater Noida (2026)
While Greater Noida, Uttar Pradesh, India currently shows low STR regulations, specific Airbnb license requirements might still exist or change. Always verify the latest short term rental regulations and Airbnb license requirements directly with local government authorities for Greater Noida to ensure full compliance before hosting.
(Source: AirROI data, 2026, finding no licensed listings among those analyzed)
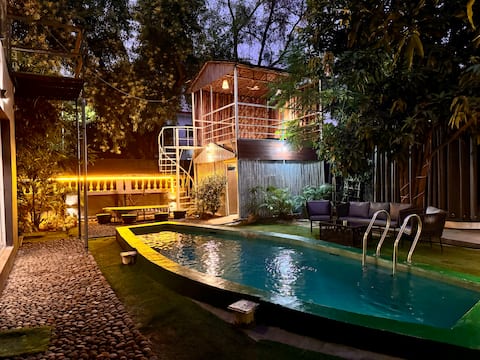
Top Performing Airbnb Properties in Greater Noida (2026)
Benchmark your potential! Explore examples of top-performing Airbnb properties in Greater Noidabased on Trailing Twelve Month (TTM) revenue. Analyze their characteristics, revenue, occupancy rate, and ADR to understand what drives success in this market.
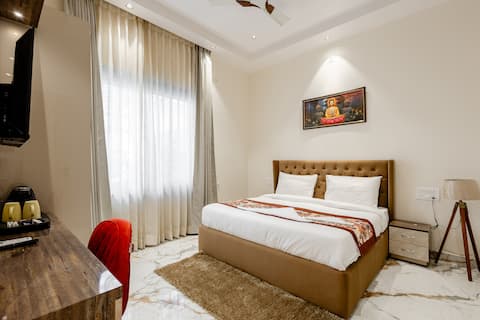
7Bhk Vista Villa With Pool In Greater Noida
Entire Place • 8 bedrooms
Chanda House by Aadhvika Resorts
Entire Place • 4 bedrooms

Deluxe King Room N/B Knowledge Park Metro
Private Room • 1 bedroom

Luxury Forest Villa (200 meters from Expo Mart)
Entire Place • 4 bedrooms

Luxury homestay room in greater noida
Private Room • 1 bedroom
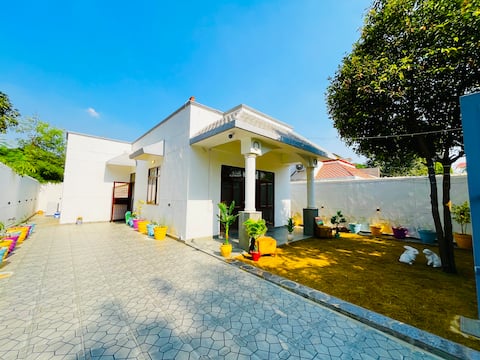
Garden Villa (200 meters from Expo Mart)
Entire Place • 3 bedrooms
Note: Performance varies based on location, size, amenities, seasonality, and management quality. Data reflects the past 12 months.
Top Performing Airbnb Hosts in Greater Noida (2026)
Learn from the best! This table showcases top-performing Airbnb hosts in Greater Noida based on the number of properties managed and estimated total revenue over the past year. Analyze their scale and performance metrics.
| Host Name | Properties | Grossing Revenue | Stay Reviews | Avg Rating |
|---|---|---|---|---|
| Sagar | 12 | $93,741 | 197 | 4.86/5.0 |
| Ram | 18 | $83,407 | 283 | 4.78/5.0 |
| Yamini | 2 | $79,532 | 5 | 3.50/5.0 |
| Srishti Gupta | 4 | $43,616 | 167 | 4.65/5.0 |
| Aman | 4 | $22,969 | 85 | 4.76/5.0 |
| Devika Dutta | 1 | $21,485 | 85 | 4.88/5.0 |
| Sachin | 4 | $14,045 | 187 | 4.91/5.0 |
| Harsh | 6 | $13,464 | 13 | 4.57/5.0 |
| Naina | 8 | $13,242 | 225 | 4.68/5.0 |
| Farid | 1 | $12,780 | 31 | 4.74/5.0 |
Analyzing the strategies of top hosts, such as their property selection, pricing, and guest communication, can offer valuable lessons for optimizing your own Airbnb operations in Greater Noida.
Dive Deeper: Advanced Greater Noida STR Market Data (2026)
Ready to unlock more insights? AirROI provides access to advanced metrics and comprehensive Airbnb data for Greater Noida. Explore detailed analytics beyond this report to refine your investment strategy, optimize pricing, and maximize your vacation rental profits.
Explore Advanced MetricsGreater Noida Short-Term Rental Market Composition (2026): Property & Room Types
Room Type Distribution
Property Type Distribution
Market Composition Insights for Greater Noida
- The Greater Noida Airbnb market composition is heavily skewed towards Entire Home/Apt listings, which make up 65.5% of the 203 active rentals. This indicates strong guest preference for privacy and space.
- However, a notable 34.5% share for Private Rooms suggests opportunities for budget-conscious travelers or hosts renting out spare rooms.
- Looking at the property type distribution in Greater Noida, Apartment/Condo properties are the most common (57.1%), reflecting the local real estate landscape.
- Houses represent a significant 18.2% portion, catering likely to families or larger groups.
- The presence of 22.7% Hotel/Boutique listings indicates integration with traditional hospitality.
- Smaller segments like outdoor/unique, others (combined 2.0%) offer potential for unique stay experiences.
Greater Noida Airbnb Room Capacity Analysis (2026): Bedroom Distribution
Distribution of Listings by Number of Bedrooms
Room Capacity Insights for Greater Noida
- The dominant room capacity in Greater Noida is 1 bedroom listings, making up 61.1% of the market. This suggests a strong demand for properties suitable for couples or solo travelers.
- Together, 1 bedroom and 2 bedrooms properties represent 74.9% of the active Airbnb listings in Greater Noida, indicating a high concentration in these sizes.
- With over half the market (61.1%) consisting of studios or 1-bedroom units, Greater Noida is particularly well-suited for individuals or couples.
Greater Noida Vacation Rental Guest Capacity Trends (2026)
Distribution of Listings by Guest Capacity
Guest Capacity Insights for Greater Noida
- The most common guest capacity trend in Greater Noida vacation rentals is listings accommodating 2 guests (34%). This suggests the primary traveler segment is likely couples or solo travelers.
- Properties designed for 2 guests and 3 guests dominate the Greater Noida STR market, accounting for 60.1% of listings.
- 18.8% of properties accommodate 6+ guests, serving the market segment for larger families or group travel in Greater Noida.
- On average, properties in Greater Noida are equipped to host 3.2 guests.
Greater Noida Airbnb Booking Patterns (2026): Available vs. Booked Days
Available Days Distribution
Booked Days Distribution
Booking Pattern Insights for Greater Noida
- The most common availability pattern in Greater Noida falls within the 271-366 days range, representing 88.7% of listings. This suggests many properties have significant open periods on their calendars.
- Approximately 99.0% of listings show high availability (181+ days open annually), indicating potential for increased bookings or specific owner usage patterns.
- For booked days, the 1-30 days range is most frequent in Greater Noida (54.7%), reflecting common guest stay durations or potential owner blocking patterns.
- A notable 1.0% of properties secure long booking periods (181+ days booked per year), highlighting successful long-term rental strategies or significant owner usage.
Greater Noida Airbnb Minimum Stay Requirements Analysis
Distribution of Listings by Minimum Night Requirement
1 Night
187 listings
92.1% of total
2 Nights
11 listings
5.4% of total
3 Nights
1 listings
0.5% of total
4-6 Nights
1 listings
0.5% of total
30+ Nights
3 listings
1.5% of total
Key Insights
- The most prevalent minimum stay requirement in Greater Noida is 1 Night, adopted by 92.1% of listings. This highlights the market's preference for shorter, flexible bookings.
- A strong majority (97.5%) of the Greater Noida Airbnb data shows acceptance of very short stays (1-2 nights), indicating a dynamic, high-turnover market.
- Dedicated monthly rentals (30+ nights) represent a small niche (1.5%), possibly an untapped area for hosts.
Recommendations
- Align with the market by considering a 1 Night minimum stay, as 92.1% of Greater Noida hosts use this setting.
- Adjust minimum nights based on seasonality – potentially shorter during low season and longer during peak demand periods in Greater Noida.
Greater Noida Airbnb Cancellation Policy Trends Analysis (2026)
Limited
2 listings
1% of total
Flexible
132 listings
66.3% of total
Moderate
32 listings
16.1% of total
Firm
20 listings
10.1% of total
Strict
13 listings
6.5% of total
Cancellation Policy Insights for Greater Noida
- The prevailing Airbnb cancellation policy trend in Greater Noida is Flexible, used by 66.3% of listings.
- The market strongly favors guest-friendly terms, with 82.4% of listings offering Flexible or Moderate policies. This suggests guests in Greater Noida may expect booking flexibility.
- Strict cancellation policies are quite rare (6.5%), potentially making listings with this policy less competitive unless justified by high demand or property type.
Recommendations for Hosts
- Consider adopting a Flexible policy to align with the 66.3% market standard in Greater Noida.
- Given the high prevalence of Flexible policies (66.3%), offering this can enhance booking appeal, especially during shoulder seasons.
- Using a Strict policy might deter some guests, as only 6.5% of listings use it. Evaluate if potential revenue protection outweighs possible lower booking rates.
- Regularly review your cancellation policy against competitors and market demand shifts in Greater Noida.
Greater Noida STR Booking Lead Time Analysis (2026)
Average Booking Lead Time by Month
Booking Lead Time Insights for Greater Noida
- The overall average booking lead time for vacation rentals in Greater Noida is 37 days.
- Guests book furthest in advance for stays during November (average 88 days), likely coinciding with peak travel demand or local events.
- The shortest booking windows occur for stays in September (average 10 days), indicating more last-minute travel plans during this time.
- Seasonally, Fall (40 days avg.) sees the longest lead times, while Summer (17 days avg.) has the shortest, reflecting typical travel planning cycles.
Recommendations for Hosts
- Use the overall average lead time (37 days) as a baseline for your pricing and availability strategy in Greater Noida.
- For November stays, consider implementing length-of-stay discounts or slightly higher rates for bookings made less than 88 days out to capitalize on advance planning.
- During September, focus on last-minute booking availability and promotions, as guests book with very short notice (10 days avg.).
- Target marketing efforts for the Fall season well in advance (at least 40 days) to capture early planners.
- Monitor your own booking lead times against these Greater Noida averages to identify opportunities for dynamic pricing adjustments.
Popular & Essential Airbnb Amenities in Greater Noida (2026)
Amenity Prevalence
Amenity Insights for Greater Noida
- Essential amenities in Greater Noida that guests expect include: Air conditioning, Wifi. Lacking these (any) could significantly impact bookings.
- Popular amenities like TV, Free parking on premises, Dedicated workspace are common but not universal. Offering these can provide a competitive edge.
Recommendations for Hosts
- Ensure your listing includes all essential amenities for Greater Noida: Air conditioning, Wifi.
- Prioritize adding missing essentials: Air conditioning, Wifi.
- Consider adding popular differentiators like TV or Free parking on premises to increase appeal.
- Highlight unique or less common amenities you offer (e.g., hot tub, dedicated workspace, EV charger) in your listing description and photos.
- Regularly check competitor amenities in Greater Noida to stay competitive.
Greater Noida Airbnb Guest Demographics & Profile Analysis (2026)
Guest Profile Summary for Greater Noida
- The typical guest profile for Airbnb in Greater Noida consists of primarily domestic travelers (88%), often arriving from nearby New Delhi, typically belonging to the Post-2000s (Gen Z/Alpha) group (50%), primarily speaking English or Hindi.
- Domestic travelers account for 87.8% of guests.
- Key international markets include India (87.8%) and United States (4.7%).
- Top languages spoken are English (45.2%) followed by Hindi (40.8%).
- A significant demographic segment is the Post-2000s (Gen Z/Alpha) group, representing 50% of guests.
Recommendations for Hosts
- Target domestic marketing efforts towards travelers from New Delhi and Delhi.
- Tailor amenities and listing descriptions to appeal to the dominant Post-2000s (Gen Z/Alpha) demographic (e.g., highlight fast WiFi, smart home features, local guides).
- Highlight unique local experiences or amenities relevant to the primary guest profile.
- Consider seasonal promotions aligned with peak travel times for key origin markets.
Nearby Short-Term Rental Market Comparison
How does the Greater Noida Airbnb market stack up against its neighbors? Compare key performance metrics like average monthly revenue, ADR, and occupancy rates in surrounding areas to understand the broader regional STR landscape.
| Market | Active Properties | Monthly Revenue | Daily Rate | Avg. Occupancy |
|---|---|---|---|---|
| Bissar Akbarpur | 13 | $2,149 | $368.42 | 20% |
| Tauru | 14 | $565 | $159.68 | 15% |
| Bajidpur | 11 | $480 | $64.35 | 27% |
| New Delhi | 2,081 | $381 | $55.43 | 32% |
| libiza town | 11 | $380 | $132.31 | 21% |
| Sunrakh | 53 | $335 | $61.47 | 31% |
| Gurugram District | 405 | $289 | $73.78 | 24% |
| Gurugram | 1,252 | $287 | $63.42 | 23% |
| Dwarka | 50 | $278 | $51.02 | 30% |
| Chhatikara | 14 | $241 | $42.28 | 32% |