Ghaziabad Airbnb Market Analysis 2026: Short Term Rental Data & Vacation Rental Statistics in Uttar Pradesh, India
Is Airbnb profitable in Ghaziabad in 2026? Explore comprehensive Airbnb analytics for Ghaziabad, Uttar Pradesh, India to uncover income potential. This 2026 STR market report for Ghaziabad, based on AirROI data from February 2025 to January 2026, reveals key trends in the niche market of 138 active listings.
Whether you're considering an Airbnb investment in Ghaziabad, optimizing your existing vacation rental, or exploring rental arbitrage opportunities, understanding the Ghaziabad Airbnb data is crucial. Leveraging the low regulation environment is key to maximizing your short term rental income potential. Let's dive into the specifics.
Key Ghaziabad Airbnb Performance Metrics Overview
Monthly Airbnb Revenue Variations & Income Potential in Ghaziabad (2026)
Understanding the monthly revenue variations for Airbnb listings in Ghaziabad is key to maximizing your short term rental income potential. Seasonality significantly impacts earnings. Our analysis, based on data from the past 12 months, shows that the peak revenue month for STRs in Ghaziabad is typically February, while June often presents the lowest earnings, highlighting opportunities for strategic pricing adjustments during shoulder and low seasons. Explore the typical Airbnb income in Ghaziabad across different performance tiers:
- Best-in-class properties (Top 10%) achieve $700+ monthly, often utilizing dynamic pricing and superior guest experiences.
- Strong performing properties (Top 25%) earn $389 or more, indicating effective management and desirable locations/amenities.
- Typical properties (Median) generate around $179 per month, representing the average market performance.
- Entry-level properties (Bottom 25%) see earnings around $86, often with potential for optimization.
Average Monthly Airbnb Earnings Trend in Ghaziabad
Ghaziabad Airbnb Occupancy Rate Trends (2026)
Maximize your bookings by understanding the Ghaziabad STR occupancy trends. Seasonal demand shifts significantly influence how often properties are booked. Typically, Februarysees the highest demand (peak season occupancy), while June experiences the lowest (low season). Effective strategies, like adjusting minimum stays or offering promotions, can boost occupancy during slower periods. Here's how different property tiers perform in Ghaziabad:
- Best-in-class properties (Top 10%) achieve 59%+ occupancy, indicating high desirability and potentially optimized availability.
- Strong performing properties (Top 25%) maintain 40% or higher occupancy, suggesting good market fit and guest satisfaction.
- Typical properties (Median) have an occupancy rate around 20%.
- Entry-level properties (Bottom 25%) average 9% occupancy, potentially facing higher vacancy.
Average Monthly Occupancy Rate Trend in Ghaziabad
Average Daily Rate (ADR) Airbnb Trends in Ghaziabad (2026)
Effective short term rental pricing strategy in Ghaziabad involves understanding monthly ADR fluctuations. The Average Daily Rate (ADR) for Airbnb in Ghaziabad typically peaks in February and dips lowest during January. Leveraging Airbnb dynamic pricing tools or strategies based on this seasonality can significantly boost revenue. Here's a look at the typical nightly rates achieved:
- Best-in-class properties (Top 10%) command rates of $52+ per night, often due to premium features or locations.
- Strong performing properties (Top 25%) achieve nightly rates of $36 or more.
- Typical properties (Median) charge around $28 per night.
- Entry-level properties (Bottom 25%) earn around $21 per night.
Average Daily Rate (ADR) Trend by Month in Ghaziabad
Get Live Ghaziabad Market Intelligence 👇

Explore Real-time Analytics
Airbnb Seasonality Analysis & Trends in Ghaziabad (2026)
Peak Season (February, November, December)
- Revenue averages $368 per month
- Occupancy rates average 33.4%
- Daily rates average $34
Shoulder Season
- Revenue averages $276 per month
- Occupancy maintains around 26.7%
- Daily rates hold near $33
Low Season (January, May, June)
- Revenue drops to average $212 per month
- Occupancy decreases to average 22.6%
- Daily rates adjust to average $32
Seasonality Insights for Ghaziabad
- The Airbnb seasonality in Ghaziabad shows highly seasonal trends requiring careful strategy. While the sections above show seasonal averages, it's also insightful to look at the extremes:
- During the high season, the absolute peak month showcases Ghaziabad's highest earning potential, with monthly revenues capable of climbing to $391, occupancy reaching a high of 37.9%, and ADRs peaking at $35.
- Conversely, the slowest single month of the year, typically falling within the low season, marks the market's lowest point. In this month, revenue might dip to $176, occupancy could drop to 20.4%, and ADRs may adjust down to $31.
- Understanding both the seasonal averages and these monthly peaks and troughs in revenue, occupancy, and ADR is crucial for maximizing your Airbnb profit potential in Ghaziabad.
Seasonal Strategies for Maximizing Profit
- Peak Season: Maximize revenue through premium pricing and potentially longer minimum stays. Ensure high availability.
- Low Season: Offer competitive pricing, special promotions (e.g., extended stay discounts), and flexible cancellation policies. Target off-season travelers like remote workers or budget-conscious guests.
- Shoulder Seasons: Implement dynamic pricing that balances peak and low rates. Target weekend travelers or specific events. Offer slightly more flexible terms than peak season.
- Regularly analyze your own performance against these Ghaziabad seasonality benchmarks and adjust your pricing and availability strategy accordingly.
Best Areas for Airbnb Investment in Ghaziabad (2026)
Exploring the top neighborhoods for short-term rentals in Ghaziabad? This section highlights key areas, outlining why they are attractive for hosts and guests, along with notable local attractions. Consider these locations based on your target guest profile and investment strategy.
| Neighborhood / Area | Why Host Here? (Target Guests & Appeal) | Key Attractions & Landmarks |
|---|---|---|
| Indirapuram | A rapidly developing suburb of Ghaziabad with modern amenities, shopping complexes, and proximity to Delhi. Attracts families and young professionals seeking a vibrant community atmosphere. | Shipra Mall, Kusum Nagar Park, Indirapuram Habitat Center, Fortis Hospital, SRS Mall |
| Raj Nagar Extension | Emerging area with affordable housing options and increasing interest from home buyers. Good for hosting Airbnb for long-term rentals due to its connectivity and local facilities. | Mahagun Mart, Lotus Valley International School, Local parks, Shopping centers, Cafes and restaurants |
| Vaishali | Established locality with excellent connectivity to the metro and other parts of Delhi-NCR. Popular with travelers for its proximity to major attractions and business hubs. | Vaishali Metro Station, Indraprashtha Apollo Hospital, East Delhi Mall, Cafes and restaurants, Local markets |
| Crossings Republik | Planned township known for its residential complexes, offering a range of housing options. Attractive to young families and professionals working in nearby Noida and Ghaziabad. | City Mall, GBCS International School, Local parks, Cafes and restaurants, Clubhouses |
| Siddharth Vihar | Newly developed area attracting buyers due to its accessibility to the national highway and Noida. Ideal for those looking for affordable but modern living options. | Siddharth International School, Local markets, Nearby parks, Shopping centers, Cafes |
| NH-24 | Strategically located along the National Highway 24, providing easy access to Delhi and surrounding areas. Good for both travelers and long-term rentals. | Nearby commercial complexes, Fast food joints, Highway access, Local markets, Shops |
| Paryavaran Complex | A unique area known for its greenery and peaceful environment. Attracts individuals looking for a nature-friendly stay while still being close to urban amenities. | Paryavaran Park, Local gardens, Cafes, Shopping centers, Community parks |
| Shastri Nagar | Well-established area with a mix of residential and commercial properties. Offers good rental yields and appeals to both families and business travelers. | Local markets, Cafes and restaurants, Parks, Nearby hospitals, Schools |
Understanding Airbnb License Requirements & STR Laws in Ghaziabad (2026)
While Ghaziabad, Uttar Pradesh, India currently shows low STR regulations, specific Airbnb license requirements might still exist or change. Always verify the latest short term rental regulations and Airbnb license requirements directly with local government authorities for Ghaziabad to ensure full compliance before hosting.
(Source: AirROI data, 2026, based on 1% licensed listings)
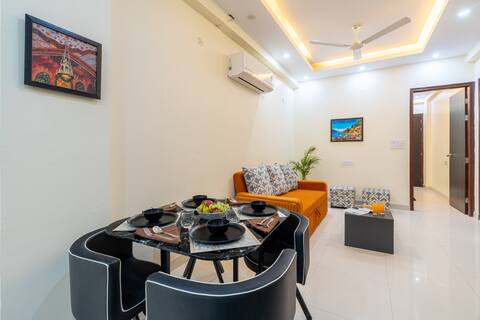
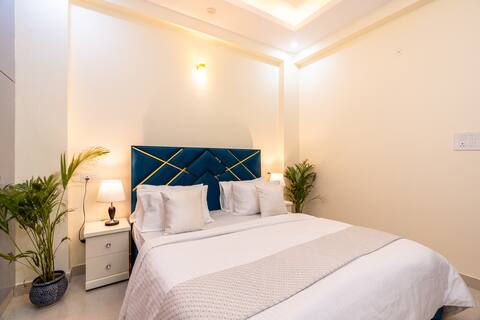
Top Performing Airbnb Properties in Ghaziabad (2026)
Benchmark your potential! Explore examples of top-performing Airbnb properties in Ghaziabadbased on Trailing Twelve Month (TTM) revenue. Analyze their characteristics, revenue, occupancy rate, and ADR to understand what drives success in this market.

Homlee-Gokul 4BHK Flat-Lift-Parking-Max Vaishali
Entire Place • 4 bedrooms

Homlee-Gokul 4BHK Flat-Lift-Parking-Max Vaishali
Entire Place • 4 bedrooms

Brand new, modern apartment in Vaishali, Ghaziabad
Entire Place • 3 bedrooms
Homlee-Vasundhara 3BHK Flat- kitchen-Parking-Lift
Entire Place • 3 bedrooms

Stylish Private Modern 2-Bedroom Retreat Delhi NCR
Entire Place • 2 bedrooms
Homlee-Vasundhara 3BHK Flat- kitchen-Parking-Lift
Entire Place • 3 bedrooms
Note: Performance varies based on location, size, amenities, seasonality, and management quality. Data reflects the past 12 months.
Top Performing Airbnb Hosts in Ghaziabad (2026)
Learn from the best! This table showcases top-performing Airbnb hosts in Ghaziabad based on the number of properties managed and estimated total revenue over the past year. Analyze their scale and performance metrics.
| Host Name | Properties | Grossing Revenue | Stay Reviews | Avg Rating |
|---|---|---|---|---|
| Homlee Enterprises Private | 14 | $88,725 | 1157 | 4.71/5.0 |
| Saurabh | 2 | $15,439 | 128 | 5.00/5.0 |
| Rajat | 6 | $11,360 | 122 | 4.84/5.0 |
| Amit | 2 | $10,984 | 137 | 4.97/5.0 |
| Monica | 1 | $10,077 | 6 | 4.83/5.0 |
| Vinit | 10 | $9,388 | 86 | 4.76/5.0 |
| Mohsin | 2 | $8,382 | 167 | 4.86/5.0 |
| V Sharma | 4 | $8,158 | 408 | 4.86/5.0 |
| Mithu | 1 | $7,442 | 150 | 4.91/5.0 |
| Rohit | 2 | $7,160 | 81 | 4.72/5.0 |
Analyzing the strategies of top hosts, such as their property selection, pricing, and guest communication, can offer valuable lessons for optimizing your own Airbnb operations in Ghaziabad.
Dive Deeper: Advanced Ghaziabad STR Market Data (2026)
Ready to unlock more insights? AirROI provides access to advanced metrics and comprehensive Airbnb data for Ghaziabad. Explore detailed analytics beyond this report to refine your investment strategy, optimize pricing, and maximize your vacation rental profits.
Explore Advanced MetricsGhaziabad Short-Term Rental Market Composition (2026): Property & Room Types
Room Type Distribution
Property Type Distribution
Market Composition Insights for Ghaziabad
- The Ghaziabad Airbnb market composition is heavily skewed towards Entire Home/Apt listings, which make up 86.2% of the 138 active rentals. This indicates strong guest preference for privacy and space.
- Looking at the property type distribution in Ghaziabad, Apartment/Condo properties are the most common (89.9%), reflecting the local real estate landscape.
- Smaller segments like hotel/boutique, outdoor/unique, others (combined 4.3%) offer potential for unique stay experiences.
Ghaziabad Airbnb Room Capacity Analysis (2026): Bedroom Distribution
Distribution of Listings by Number of Bedrooms
Room Capacity Insights for Ghaziabad
- The dominant room capacity in Ghaziabad is 1 bedroom listings, making up 55.1% of the market. This suggests a strong demand for properties suitable for couples or solo travelers.
- Together, 1 bedroom and 2 bedrooms properties represent 81.9% of the active Airbnb listings in Ghaziabad, indicating a high concentration in these sizes.
- With over half the market (55.1%) consisting of studios or 1-bedroom units, Ghaziabad is particularly well-suited for individuals or couples.
Ghaziabad Vacation Rental Guest Capacity Trends (2026)
Distribution of Listings by Guest Capacity
Guest Capacity Insights for Ghaziabad
- The most common guest capacity trend in Ghaziabad vacation rentals is listings accommodating 2 guests (39.1%). This suggests the primary traveler segment is likely couples or solo travelers.
- Properties designed for 2 guests and 8+ guests dominate the Ghaziabad STR market, accounting for 58.7% of listings.
- 26.1% of properties accommodate 6+ guests, serving the market segment for larger families or group travel in Ghaziabad.
- On average, properties in Ghaziabad are equipped to host 3.7 guests.
Ghaziabad Airbnb Booking Patterns (2026): Available vs. Booked Days
Available Days Distribution
Booked Days Distribution
Booking Pattern Insights for Ghaziabad
- The most common availability pattern in Ghaziabad falls within the 271-366 days range, representing 73.9% of listings. This suggests many properties have significant open periods on their calendars.
- Approximately 96.4% of listings show high availability (181+ days open annually), indicating potential for increased bookings or specific owner usage patterns.
- For booked days, the 1-30 days range is most frequent in Ghaziabad (45.7%), reflecting common guest stay durations or potential owner blocking patterns.
- A notable 4.3% of properties secure long booking periods (181+ days booked per year), highlighting successful long-term rental strategies or significant owner usage.
Ghaziabad Airbnb Minimum Stay Requirements Analysis
Distribution of Listings by Minimum Night Requirement
1 Night
127 listings
92% of total
2 Nights
1 listings
0.7% of total
3 Nights
4 listings
2.9% of total
4-6 Nights
2 listings
1.4% of total
7-29 Nights
2 listings
1.4% of total
30+ Nights
2 listings
1.4% of total
Key Insights
- The most prevalent minimum stay requirement in Ghaziabad is 1 Night, adopted by 92% of listings. This highlights the market's preference for shorter, flexible bookings.
- A strong majority (92.7%) of the Ghaziabad Airbnb data shows acceptance of very short stays (1-2 nights), indicating a dynamic, high-turnover market.
- Dedicated monthly rentals (30+ nights) represent a small niche (1.4%), possibly an untapped area for hosts.
Recommendations
- Align with the market by considering a 1 Night minimum stay, as 92% of Ghaziabad hosts use this setting.
- Adjust minimum nights based on seasonality – potentially shorter during low season and longer during peak demand periods in Ghaziabad.
Ghaziabad Airbnb Cancellation Policy Trends Analysis (2026)
Flexible
65 listings
47.1% of total
Moderate
52 listings
37.7% of total
Firm
18 listings
13% of total
Strict
3 listings
2.2% of total
Cancellation Policy Insights for Ghaziabad
- The prevailing Airbnb cancellation policy trend in Ghaziabad is Flexible, used by 47.1% of listings.
- The market strongly favors guest-friendly terms, with 84.8% of listings offering Flexible or Moderate policies. This suggests guests in Ghaziabad may expect booking flexibility.
- Strict cancellation policies are quite rare (2.2%), potentially making listings with this policy less competitive unless justified by high demand or property type.
Recommendations for Hosts
- Consider adopting a Flexible policy to align with the 47.1% market standard in Ghaziabad.
- Using a Strict policy might deter some guests, as only 2.2% of listings use it. Evaluate if potential revenue protection outweighs possible lower booking rates.
- Regularly review your cancellation policy against competitors and market demand shifts in Ghaziabad.
Ghaziabad STR Booking Lead Time Analysis (2026)
Average Booking Lead Time by Month
Booking Lead Time Insights for Ghaziabad
- The overall average booking lead time for vacation rentals in Ghaziabad is 12 days.
- Guests book furthest in advance for stays during November (average 36 days), likely coinciding with peak travel demand or local events.
- The shortest booking windows occur for stays in September (average 5 days), indicating more last-minute travel plans during this time.
- Seasonally, Fall (21 days avg.) sees the longest lead times, while Spring (8 days avg.) has the shortest, reflecting typical travel planning cycles.
Recommendations for Hosts
- Use the overall average lead time (12 days) as a baseline for your pricing and availability strategy in Ghaziabad.
- For November stays, consider implementing length-of-stay discounts or slightly higher rates for bookings made less than 36 days out to capitalize on advance planning.
- Target marketing efforts for the Fall season well in advance (at least 21 days) to capture early planners.
- Monitor your own booking lead times against these Ghaziabad averages to identify opportunities for dynamic pricing adjustments.
Popular & Essential Airbnb Amenities in Ghaziabad (2026)
Amenity Prevalence
Amenity Insights for Ghaziabad
- Essential amenities in Ghaziabad that guests expect include: Air conditioning, Wifi. Lacking these (any) could significantly impact bookings.
- Popular amenities like Kitchen, TV, Free parking on premises are common but not universal. Offering these can provide a competitive edge.
Recommendations for Hosts
- Ensure your listing includes all essential amenities for Ghaziabad: Air conditioning, Wifi.
- Prioritize adding missing essentials: Air conditioning, Wifi.
- Consider adding popular differentiators like Kitchen or TV to increase appeal.
- Highlight unique or less common amenities you offer (e.g., hot tub, dedicated workspace, EV charger) in your listing description and photos.
- Regularly check competitor amenities in Ghaziabad to stay competitive.
Ghaziabad Airbnb Guest Demographics & Profile Analysis (2026)
Guest Profile Summary for Ghaziabad
- The typical guest profile for Airbnb in Ghaziabad consists of primarily domestic travelers (81%), often arriving from nearby New Delhi, typically belonging to the Post-2000s (Gen Z/Alpha) group (50%), primarily speaking English or Hindi.
- Domestic travelers account for 81.2% of guests.
- Key international markets include India (81.2%) and United States (7.7%).
- Top languages spoken are English (43%) followed by Hindi (37.6%).
- A significant demographic segment is the Post-2000s (Gen Z/Alpha) group, representing 50% of guests.
Recommendations for Hosts
- Target domestic marketing efforts towards travelers from New Delhi and Bengaluru.
- Tailor amenities and listing descriptions to appeal to the dominant Post-2000s (Gen Z/Alpha) demographic (e.g., highlight fast WiFi, smart home features, local guides).
- Highlight unique local experiences or amenities relevant to the primary guest profile.
- Consider seasonal promotions aligned with peak travel times for key origin markets.
Nearby Short-Term Rental Market Comparison
How does the Ghaziabad Airbnb market stack up against its neighbors? Compare key performance metrics like average monthly revenue, ADR, and occupancy rates in surrounding areas to understand the broader regional STR landscape.
| Market | Active Properties | Monthly Revenue | Daily Rate | Avg. Occupancy |
|---|---|---|---|---|
| Bissar Akbarpur | 13 | $2,149 | $368.42 | 20% |
| Tauru | 14 | $565 | $159.68 | 15% |
| Bajidpur | 11 | $480 | $64.35 | 27% |
| New Delhi | 2,081 | $381 | $55.43 | 32% |
| libiza town | 11 | $380 | $132.31 | 21% |
| Sunrakh | 53 | $335 | $61.47 | 31% |
| Gurugram District | 405 | $289 | $73.78 | 24% |
| Gurugram | 1,252 | $287 | $63.42 | 23% |
| Dwarka | 50 | $278 | $51.02 | 30% |
| Greater Noida | 203 | $262 | $71.19 | 23% |