Garhi Airbnb Market Analysis 2026: Short Term Rental Data & Vacation Rental Statistics in Uttar Pradesh, India
Is Airbnb profitable in Garhi in 2026? Explore comprehensive Airbnb analytics for Garhi, Uttar Pradesh, India to uncover income potential. This 2026 STR market report for Garhi, based on AirROI data from February 2025 to January 2026, reveals key trends in the niche market of 81 active listings.
Whether you're considering an Airbnb investment in Garhi, optimizing your existing vacation rental, or exploring rental arbitrage opportunities, understanding the Garhi Airbnb data is crucial. Leveraging the low regulation environment is key to maximizing your short term rental income potential. Let's dive into the specifics.
Key Garhi Airbnb Performance Metrics Overview
Monthly Airbnb Revenue Variations & Income Potential in Garhi (2026)
Understanding the monthly revenue variations for Airbnb listings in Garhi is key to maximizing your short term rental income potential. Seasonality significantly impacts earnings. Our analysis, based on data from the past 12 months, shows that the peak revenue month for STRs in Garhi is typically February, while October often presents the lowest earnings, highlighting opportunities for strategic pricing adjustments during shoulder and low seasons. Explore the typical Airbnb income in Garhi across different performance tiers:
- Best-in-class properties (Top 10%) achieve $376+ monthly, often utilizing dynamic pricing and superior guest experiences.
- Strong performing properties (Top 25%) earn $210 or more, indicating effective management and desirable locations/amenities.
- Typical properties (Median) generate around $110 per month, representing the average market performance.
- Entry-level properties (Bottom 25%) see earnings around $65, often with potential for optimization.
Average Monthly Airbnb Earnings Trend in Garhi
Garhi Airbnb Occupancy Rate Trends (2026)
Maximize your bookings by understanding the Garhi STR occupancy trends. Seasonal demand shifts significantly influence how often properties are booked. Typically, Februarysees the highest demand (peak season occupancy), while October experiences the lowest (low season). Effective strategies, like adjusting minimum stays or offering promotions, can boost occupancy during slower periods. Here's how different property tiers perform in Garhi:
- Best-in-class properties (Top 10%) achieve 43%+ occupancy, indicating high desirability and potentially optimized availability.
- Strong performing properties (Top 25%) maintain 26% or higher occupancy, suggesting good market fit and guest satisfaction.
- Typical properties (Median) have an occupancy rate around 12%.
- Entry-level properties (Bottom 25%) average 7% occupancy, potentially facing higher vacancy.
Average Monthly Occupancy Rate Trend in Garhi
Average Daily Rate (ADR) Airbnb Trends in Garhi (2026)
Effective short term rental pricing strategy in Garhi involves understanding monthly ADR fluctuations. The Average Daily Rate (ADR) for Airbnb in Garhi typically peaks in November and dips lowest during March. Leveraging Airbnb dynamic pricing tools or strategies based on this seasonality can significantly boost revenue. Here's a look at the typical nightly rates achieved:
- Best-in-class properties (Top 10%) command rates of $40+ per night, often due to premium features or locations.
- Strong performing properties (Top 25%) achieve nightly rates of $35 or more.
- Typical properties (Median) charge around $28 per night.
- Entry-level properties (Bottom 25%) earn around $22 per night.
Average Daily Rate (ADR) Trend by Month in Garhi
Get Live Garhi Market Intelligence 👇
Explore Real-time Analytics
Airbnb Seasonality Analysis & Trends in Garhi (2026)
Peak Season (February, March, November)
- Revenue averages $231 per month
- Occupancy rates average 21.8%
- Daily rates average $34
Shoulder Season
- Revenue averages $169 per month
- Occupancy maintains around 20.2%
- Daily rates hold near $32
Low Season (April, August, October)
- Revenue drops to average $121 per month
- Occupancy decreases to average 15.1%
- Daily rates adjust to average $31
Seasonality Insights for Garhi
- The Airbnb seasonality in Garhi shows highly seasonal trends requiring careful strategy. While the sections above show seasonal averages, it's also insightful to look at the extremes:
- During the high season, the absolute peak month showcases Garhi's highest earning potential, with monthly revenues capable of climbing to $237, occupancy reaching a high of 26.0%, and ADRs peaking at $40.
- Conversely, the slowest single month of the year, typically falling within the low season, marks the market's lowest point. In this month, revenue might dip to $110, occupancy could drop to 13.4%, and ADRs may adjust down to $30.
- Understanding both the seasonal averages and these monthly peaks and troughs in revenue, occupancy, and ADR is crucial for maximizing your Airbnb profit potential in Garhi.
Seasonal Strategies for Maximizing Profit
- Peak Season: Maximize revenue through premium pricing and potentially longer minimum stays. Ensure high availability.
- Low Season: Offer competitive pricing, special promotions (e.g., extended stay discounts), and flexible cancellation policies. Target off-season travelers like remote workers or budget-conscious guests.
- Shoulder Seasons: Implement dynamic pricing that balances peak and low rates. Target weekend travelers or specific events. Offer slightly more flexible terms than peak season.
- Regularly analyze your own performance against these Garhi seasonality benchmarks and adjust your pricing and availability strategy accordingly.
Best Areas for Airbnb Investment in Garhi (2026)
Exploring the top neighborhoods for short-term rentals in Garhi? This section highlights key areas, outlining why they are attractive for hosts and guests, along with notable local attractions. Consider these locations based on your target guest profile and investment strategy.
| Neighborhood / Area | Why Host Here? (Target Guests & Appeal) | Key Attractions & Landmarks |
|---|---|---|
| Garhi Village | A serene village environment with traditional Indian lifestyle, appealing to tourists looking for an authentic cultural experience away from the urban hustle. | Local temples, Village markets, Cultural festivals, Nature walks, Historical sites |
| Nearby National Parks | Proximity to natural parks provides opportunities for eco-tourism and adventure activities, attracting nature lovers and outdoor enthusiasts. | Rajaji National Park, Bird watching, Trekking trails, Nature photography, Camping |
| Heritage Sites | Rich in heritage with several ancient temples and historical landmarks, attracting history buffs and tourists interested in culture. | Local historical temples, Ancient architecture, Cultural heritage sites, Pilgrimage spots, Art and crafts workshops |
| Educational Institutions | Presence of prominent educational institutions attracts students and parents visiting for educational purposes, thus providing a steady flow of visitors. | Local colleges, Hostels for students, Libraries, Student hangouts, Workshops |
| Market Area | The bustling market areas provide shopping opportunities for tourists, appealing to those interested in local crafts and souvenirs. | Local bazaars, Handicraft stores, Street food stalls, Cultural performances, Artisan workshops |
| Religious Sites | Visitations to various religious sites throughout the year draw pilgrims and tourists alike, especially during festivals and religious gatherings. | Pilgrim towns nearby, Temples and shrines, Annual fairs and festivals, Cultural events, Community feasts |
| Adventure Sports Areas | Attracts adventure seekers looking for activities like trekking, river rafting, and hiking in the surrounding hills and rivers. | Trekking routes, River activities, Adventure camps, Nature retreats, Outdoor fairs |
| Agricultural Experience Tours | Offers unique experiences related to local agriculture and farming, appealing to urban tourists looking for experiential learning and local food. | Farm visits, Organic food tasting, Agricultural workshops, Local produce markets, Nature explorations |
Understanding Airbnb License Requirements & STR Laws in Garhi (2026)
While Garhi, Uttar Pradesh, India currently shows low STR regulations, specific Airbnb license requirements might still exist or change. Always verify the latest short term rental regulations and Airbnb license requirements directly with local government authorities for Garhi to ensure full compliance before hosting.
(Source: AirROI data, 2026, based on 1% licensed listings)
Top Performing Airbnb Properties in Garhi (2026)
Benchmark your potential! Explore examples of top-performing Airbnb properties in Garhibased on Trailing Twelve Month (TTM) revenue. Analyze their characteristics, revenue, occupancy rate, and ADR to understand what drives success in this market.
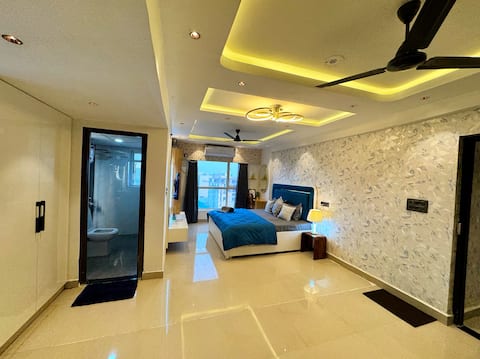
Indigo Oasis | Luxury Apartment in Noida
Entire Place • 1 bedroom

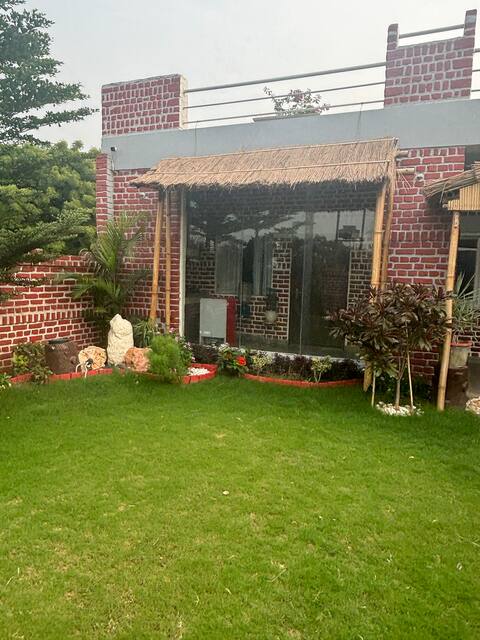
Nature View by JP Homestays
Entire Place • 1 bedroom
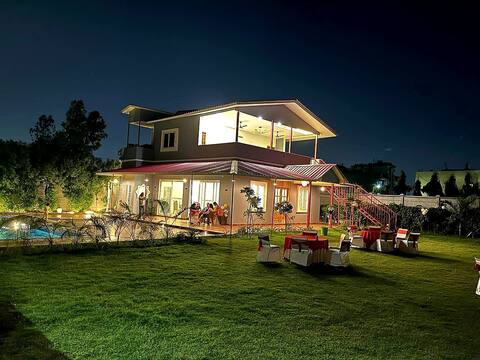
Farm house for party, swimming pool, Bone fire
Entire Place • 3 bedrooms

The Wine Door by NobleHomes
Entire Place • 1 bedroom
Shakun L UNIT(2)
Entire Place • 2 bedrooms

DarkWood- Classy & Chic 1BHK- by Karun&Ria
Entire Place • 1 bedroom
Note: Performance varies based on location, size, amenities, seasonality, and management quality. Data reflects the past 12 months.
Top Performing Airbnb Hosts in Garhi (2026)
Learn from the best! This table showcases top-performing Airbnb hosts in Garhi based on the number of properties managed and estimated total revenue over the past year. Analyze their scale and performance metrics.
| Host Name | Properties | Grossing Revenue | Stay Reviews | Avg Rating |
|---|---|---|---|---|
| Richa | 19 | $9,010 | 1064 | 4.60/5.0 |
| Anirudh | 2 | $8,898 | 286 | 4.92/5.0 |
| Karun | 5 | $6,236 | 721 | 4.61/5.0 |
| Anang Pal | 1 | $3,309 | 2 | Not Rated |
| SarthaK | 3 | $3,146 | 126 | 4.73/5.0 |
| Geet | 1 | $2,981 | 46 | 4.89/5.0 |
| Sidak | 2 | $2,885 | 112 | 4.89/5.0 |
| Danish | 3 | $2,327 | 208 | 4.83/5.0 |
| Ankit | 1 | $2,190 | 39 | 4.59/5.0 |
| Vikrant | 2 | $1,676 | 12 | 4.18/5.0 |
Analyzing the strategies of top hosts, such as their property selection, pricing, and guest communication, can offer valuable lessons for optimizing your own Airbnb operations in Garhi.
Dive Deeper: Advanced Garhi STR Market Data (2026)
Ready to unlock more insights? AirROI provides access to advanced metrics and comprehensive Airbnb data for Garhi. Explore detailed analytics beyond this report to refine your investment strategy, optimize pricing, and maximize your vacation rental profits.
Explore Advanced MetricsGarhi Short-Term Rental Market Composition (2026): Property & Room Types
Room Type Distribution
Property Type Distribution
Market Composition Insights for Garhi
- The Garhi Airbnb market composition is heavily skewed towards Entire Home/Apt listings, which make up 95.1% of the 81 active rentals. This indicates strong guest preference for privacy and space.
- Looking at the property type distribution in Garhi, Apartment/Condo properties are the most common (95.1%), reflecting the local real estate landscape.
- Smaller segments like house, outdoor/unique, hotel/boutique (combined 4.9%) offer potential for unique stay experiences.
Garhi Airbnb Room Capacity Analysis (2026): Bedroom Distribution
Distribution of Listings by Number of Bedrooms
Room Capacity Insights for Garhi
- The dominant room capacity in Garhi is 1 bedroom listings, making up 86.4% of the market. This suggests a strong demand for properties suitable for couples or solo travelers.
- Together, 1 bedroom and 2 bedrooms properties represent 90.1% of the active Airbnb listings in Garhi, indicating a high concentration in these sizes.
- With over half the market (86.4%) consisting of studios or 1-bedroom units, Garhi is particularly well-suited for individuals or couples.
- Listings with 3+ bedrooms (1.2%) represent a smaller niche, potentially indicating an underserved market for larger group accommodations in Garhi.
Garhi Vacation Rental Guest Capacity Trends (2026)
Distribution of Listings by Guest Capacity
Guest Capacity Insights for Garhi
- The most common guest capacity trend in Garhi vacation rentals is listings accommodating 3 guests (32.1%). This suggests the primary traveler segment is likely small families or groups.
- Properties designed for 3 guests and 4 guests dominate the Garhi STR market, accounting for 61.7% of listings.
- On average, properties in Garhi are equipped to host 3.3 guests.
Garhi Airbnb Booking Patterns (2026): Available vs. Booked Days
Available Days Distribution
Booked Days Distribution
Booking Pattern Insights for Garhi
- The most common availability pattern in Garhi falls within the 271-366 days range, representing 96.3% of listings. This suggests many properties have significant open periods on their calendars.
- Approximately 98.8% of listings show high availability (181+ days open annually), indicating potential for increased bookings or specific owner usage patterns.
- For booked days, the 1-30 days range is most frequent in Garhi (76.5%), reflecting common guest stay durations or potential owner blocking patterns.
- A notable 1.2% of properties secure long booking periods (181+ days booked per year), highlighting successful long-term rental strategies or significant owner usage.
Garhi Airbnb Minimum Stay Requirements Analysis
Distribution of Listings by Minimum Night Requirement
1 Night
81 listings
100% of total
Key Insights
- The most prevalent minimum stay requirement in Garhi is 1 Night, adopted by 100% of listings. This highlights the market's preference for shorter, flexible bookings.
- A strong majority (100.0%) of the Garhi Airbnb data shows acceptance of very short stays (1-2 nights), indicating a dynamic, high-turnover market.
Recommendations
- Align with the market by considering a 1 Night minimum stay, as 100% of Garhi hosts use this setting.
- Adjust minimum nights based on seasonality – potentially shorter during low season and longer during peak demand periods in Garhi.
Garhi Airbnb Cancellation Policy Trends Analysis (2026)
Flexible
54 listings
66.7% of total
Moderate
20 listings
24.7% of total
Firm
5 listings
6.2% of total
Strict
2 listings
2.5% of total
Cancellation Policy Insights for Garhi
- The prevailing Airbnb cancellation policy trend in Garhi is Flexible, used by 66.7% of listings.
- The market strongly favors guest-friendly terms, with 91.4% of listings offering Flexible or Moderate policies. This suggests guests in Garhi may expect booking flexibility.
- Strict cancellation policies are quite rare (2.5%), potentially making listings with this policy less competitive unless justified by high demand or property type.
Recommendations for Hosts
- Consider adopting a Flexible policy to align with the 66.7% market standard in Garhi.
- Given the high prevalence of Flexible policies (66.7%), offering this can enhance booking appeal, especially during shoulder seasons.
- Using a Strict policy might deter some guests, as only 2.5% of listings use it. Evaluate if potential revenue protection outweighs possible lower booking rates.
- Regularly review your cancellation policy against competitors and market demand shifts in Garhi.
Garhi STR Booking Lead Time Analysis (2026)
Average Booking Lead Time by Month
Booking Lead Time Insights for Garhi
- The overall average booking lead time for vacation rentals in Garhi is 29 days.
- Guests book furthest in advance for stays during November (average 146 days), likely coinciding with peak travel demand or local events.
- The shortest booking windows occur for stays in August (average 2 days), indicating more last-minute travel plans during this time.
- Seasonally, Fall (51 days avg.) sees the longest lead times, while Summer (4 days avg.) has the shortest, reflecting typical travel planning cycles.
Recommendations for Hosts
- Use the overall average lead time (29 days) as a baseline for your pricing and availability strategy in Garhi.
- For November stays, consider implementing length-of-stay discounts or slightly higher rates for bookings made less than 146 days out to capitalize on advance planning.
- During August, focus on last-minute booking availability and promotions, as guests book with very short notice (2 days avg.).
- Target marketing efforts for the Fall season well in advance (at least 51 days) to capture early planners.
- Monitor your own booking lead times against these Garhi averages to identify opportunities for dynamic pricing adjustments.
Popular & Essential Airbnb Amenities in Garhi (2026)
Amenity Prevalence
Amenity Insights for Garhi
- Essential amenities in Garhi that guests expect include: Wifi, Air conditioning, TV, Kitchen, Free parking on premises. Lacking these (any) could significantly impact bookings.
- Popular amenities like Dedicated workspace, Cooking basics, Fire extinguisher are common but not universal. Offering these can provide a competitive edge.
Recommendations for Hosts
- Ensure your listing includes all essential amenities for Garhi: Wifi, Air conditioning, TV, Kitchen, Free parking on premises.
- Prioritize adding missing essentials: Air conditioning, TV, Kitchen, Free parking on premises.
- Consider adding popular differentiators like Dedicated workspace or Cooking basics to increase appeal.
- Highlight unique or less common amenities you offer (e.g., hot tub, dedicated workspace, EV charger) in your listing description and photos.
- Regularly check competitor amenities in Garhi to stay competitive.
Garhi Airbnb Guest Demographics & Profile Analysis (2026)
Guest Profile Summary for Garhi
- The typical guest profile for Airbnb in Garhi consists of primarily domestic travelers (93%), often arriving from nearby Noida, typically belonging to the Post-2000s (Gen Z/Alpha) group (50%), primarily speaking English or Hindi.
- Domestic travelers account for 92.9% of guests.
- Key international markets include India (92.9%) and United States (2%).
- Top languages spoken are English (45%) followed by Hindi (44.4%).
- A significant demographic segment is the Post-2000s (Gen Z/Alpha) group, representing 50% of guests.
Recommendations for Hosts
- Target domestic marketing efforts towards travelers from Noida and New Delhi.
- Tailor amenities and listing descriptions to appeal to the dominant Post-2000s (Gen Z/Alpha) demographic (e.g., highlight fast WiFi, smart home features, local guides).
- Highlight unique local experiences or amenities relevant to the primary guest profile.
- Consider seasonal promotions aligned with peak travel times for key origin markets.
Nearby Short-Term Rental Market Comparison
How does the Garhi Airbnb market stack up against its neighbors? Compare key performance metrics like average monthly revenue, ADR, and occupancy rates in surrounding areas to understand the broader regional STR landscape.
| Market | Active Properties | Monthly Revenue | Daily Rate | Avg. Occupancy |
|---|---|---|---|---|
| Bissar Akbarpur | 13 | $2,149 | $368.42 | 20% |
| Tauru | 14 | $565 | $159.68 | 15% |
| Bajidpur | 11 | $480 | $64.35 | 27% |
| New Delhi | 2,081 | $381 | $55.43 | 32% |
| libiza town | 11 | $380 | $132.31 | 21% |
| Sunrakh | 53 | $335 | $61.47 | 31% |
| Gurugram District | 405 | $289 | $73.78 | 24% |
| Gurugram | 1,252 | $287 | $63.42 | 23% |
| Dwarka | 50 | $278 | $51.02 | 30% |
| Greater Noida | 203 | $262 | $71.19 | 23% |