Vellanki Agros Airbnb Market Analysis 2025: Short Term Rental Data & Vacation Rental Statistics in Telangana, India
Is Airbnb profitable in Vellanki Agros in 2025? Explore comprehensive Airbnb analytics for Vellanki Agros, Telangana, India to uncover income potential. This 2025 STR market report for Vellanki Agros, based on AirROI data from November 2024 to October 2025, reveals key trends in the niche market of 18 active listings.
Whether you're considering an Airbnb investment in Vellanki Agros, optimizing your existing vacation rental, or exploring rental arbitrage opportunities, understanding the Vellanki Agros Airbnb data is crucial. Leveraging the low regulation environment is key to maximizing your short term rental income potential. Let's dive into the specifics.
Key Vellanki Agros Airbnb Performance Metrics Overview
Monthly Airbnb Revenue Variations & Income Potential in Vellanki Agros (2025)
Understanding the monthly revenue variations for Airbnb listings in Vellanki Agros is key to maximizing your short term rental income potential. Seasonality significantly impacts earnings. Our analysis, based on data from the past 12 months, shows that the peak revenue month for STRs in Vellanki Agros is typically November, while September often presents the lowest earnings, highlighting opportunities for strategic pricing adjustments during shoulder and low seasons. Explore the typical Airbnb income in Vellanki Agros across different performance tiers:
- Best-in-class properties (Top 10%) achieve $1,498+ monthly, often utilizing dynamic pricing and superior guest experiences.
- Strong performing properties (Top 25%) earn $629 or more, indicating effective management and desirable locations/amenities.
- Typical properties (Median) generate around $248 per month, representing the average market performance.
- Entry-level properties (Bottom 25%) see earnings around $129, often with potential for optimization.
Average Monthly Airbnb Earnings Trend in Vellanki Agros
Vellanki Agros Airbnb Occupancy Rate Trends (2025)
Maximize your bookings by understanding the Vellanki Agros STR occupancy trends. Seasonal demand shifts significantly influence how often properties are booked. Typically, Novembersees the highest demand (peak season occupancy), while July experiences the lowest (low season). Effective strategies, like adjusting minimum stays or offering promotions, can boost occupancy during slower periods. Here's how different property tiers perform in Vellanki Agros:
- Best-in-class properties (Top 10%) achieve 36%+ occupancy, indicating high desirability and potentially optimized availability.
- Strong performing properties (Top 25%) maintain 21% or higher occupancy, suggesting good market fit and guest satisfaction.
- Typical properties (Median) have an occupancy rate around 13%.
- Entry-level properties (Bottom 25%) average 9% occupancy, potentially facing higher vacancy.
Average Monthly Occupancy Rate Trend in Vellanki Agros
Average Daily Rate (ADR) Airbnb Trends in Vellanki Agros (2025)
Effective short term rental pricing strategy in Vellanki Agros involves understanding monthly ADR fluctuations. The Average Daily Rate (ADR) for Airbnb in Vellanki Agros typically peaks in December and dips lowest during September. Leveraging Airbnb dynamic pricing tools or strategies based on this seasonality can significantly boost revenue. Here's a look at the typical nightly rates achieved:
- Best-in-class properties (Top 10%) command rates of $176+ per night, often due to premium features or locations.
- Strong performing properties (Top 25%) achieve nightly rates of $67 or more.
- Typical properties (Median) charge around $48 per night.
- Entry-level properties (Bottom 25%) earn around $38 per night.
Average Daily Rate (ADR) Trend by Month in Vellanki Agros
Get Live Vellanki Agros Market Intelligence 👇

Explore Real-time Analytics
Airbnb Seasonality Analysis & Trends in Vellanki Agros (2025)
Peak Season (November, December, January)
- Revenue averages $998 per month
- Occupancy rates average 27.8%
- Daily rates average $78
Shoulder Season
- Revenue averages $501 per month
- Occupancy maintains around 15.0%
- Daily rates hold near $71
Low Season (June, July, September)
- Revenue drops to average $249 per month
- Occupancy decreases to average 9.5%
- Daily rates adjust to average $65
Seasonality Insights for Vellanki Agros
- The Airbnb seasonality in Vellanki Agros shows highly seasonal trends requiring careful strategy. While the sections above show seasonal averages, it's also insightful to look at the extremes:
- During the high season, the absolute peak month showcases Vellanki Agros's highest earning potential, with monthly revenues capable of climbing to $1,216, occupancy reaching a high of 30.4%, and ADRs peaking at $79.
- Conversely, the slowest single month of the year, typically falling within the low season, marks the market's lowest point. In this month, revenue might dip to $208, occupancy could drop to 7.6%, and ADRs may adjust down to $63.
- Understanding both the seasonal averages and these monthly peaks and troughs in revenue, occupancy, and ADR is crucial for maximizing your Airbnb profit potential in Vellanki Agros.
Seasonal Strategies for Maximizing Profit
- Peak Season: Maximize revenue through premium pricing and potentially longer minimum stays. Ensure high availability.
- Low Season: Offer competitive pricing, special promotions (e.g., extended stay discounts), and flexible cancellation policies. Target off-season travelers like remote workers or budget-conscious guests.
- Shoulder Seasons: Implement dynamic pricing that balances peak and low rates. Target weekend travelers or specific events. Offer slightly more flexible terms than peak season.
- Regularly analyze your own performance against these Vellanki Agros seasonality benchmarks and adjust your pricing and availability strategy accordingly.
Best Areas for Airbnb Investment in Vellanki Agros (2025)
Exploring the top neighborhoods for short-term rentals in Vellanki Agros? This section highlights key areas, outlining why they are attractive for hosts and guests, along with notable local attractions. Consider these locations based on your target guest profile and investment strategy.
| Neighborhood / Area | Why Host Here? (Target Guests & Appeal) | Key Attractions & Landmarks |
|---|---|---|
| Vellanki Agros Main Area | Easily accessible area with good infrastructure and amenities, making it ideal for guests seeking a rural experience with the comforts of modern living. | Local farms, Organic produce markets, Nature trails, Community parks |
| Vellanki Agros Nature Reserve | This area offers a serene natural environment, attracting guests looking for relaxation, guided nature walks, and eco-friendly stays. | Nature trails, Bird watching, Local flora and fauna, Peaceful landscapes |
| Farm Stay Zone | Creates a unique experience for tourists interested in agritourism, allowing guests to engage with local farming activities and enjoy home-cooked meals from farm produce. | Interactive farming experiences, Home-cooked meals, Local artisan products |
| Cultural Hub Area | Serves as the center for local culture and traditions, attracting guests looking to immerse themselves in Telangana's rich heritage. | Local festivals, Cultural exhibitions, Handicraft markets |
| Adventure Sports Zone | Ideal for thrill-seekers, offering various adventure sports and activities, attracting a younger demographic and families. | Trekking, Cycling, Water sports, Outdoor recreational activities |
| Health and Wellness Retreats | Focus on wellness tourism, providing yoga, meditation, and farming workshops, catering to health-conscious travelers. | Yoga retreats, Wellness workshops, Meditation sessions |
| Foodie Trail Area | Famous for local cuisine, this area appeals to food lovers looking to experience authentic Telangana flavors. | Local eateries, Food festivals, Cooking classes |
| Festival Grounds Area | A popular spot during local festivals, providing accommodation to visitors who come to enjoy traditional events and celebrations. | Local festivals, Traditional performances, Craft fairs |
Understanding Airbnb License Requirements & STR Laws in Vellanki Agros (2025)
While Vellanki Agros, Telangana, India currently shows low STR regulations, specific Airbnb license requirements might still exist or change. Always verify the latest short term rental regulations and Airbnb license requirements directly with local government authorities for Vellanki Agros to ensure full compliance before hosting.
(Source: AirROI data, 2025, finding no licensed listings among those analyzed)
Top Performing Airbnb Properties in Vellanki Agros (2025)
Benchmark your potential! Explore examples of top-performing Airbnb properties in Vellanki Agrosbased on Trailing Twelve Month (TTM) revenue. Analyze their characteristics, revenue, occupancy rate, and ADR to understand what drives success in this market.
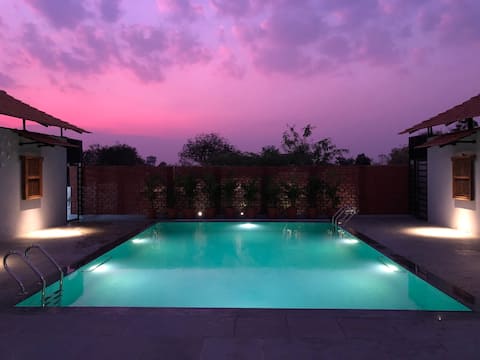
Serene by Palladium: Luxurious Farmhouse with Pool
Entire Place • 4 bedrooms

Experience Luxury: Rent Our 6 BedRoom Event Home.
Entire Place • 6 bedrooms

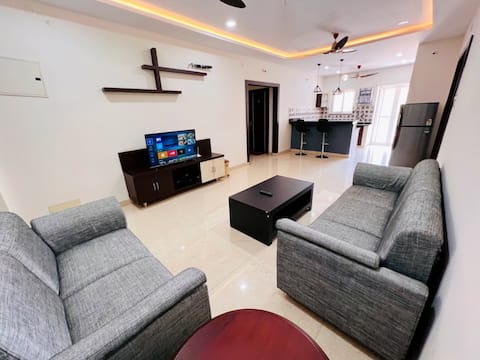
Luxurious Villa at Hyderabad-Close by RGIA Airport
Entire Place • 2 bedrooms
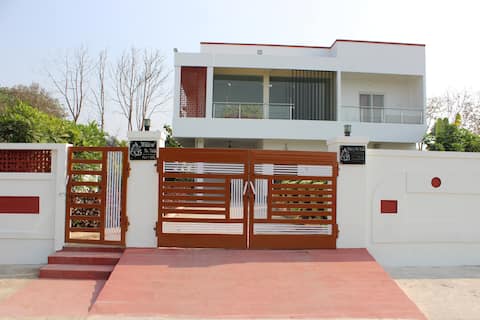
Willow - The Villa
Entire Place • 3 bedrooms
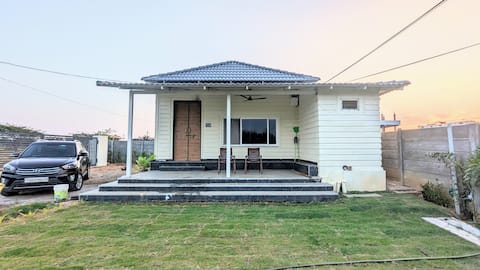
4BHK Aaria 10min from Airport Shamshabad(No partys
Entire Place • 4 bedrooms
Kaza's Nature Retreat
Entire Place • 1 bedroom
Note: Performance varies based on location, size, amenities, seasonality, and management quality. Data reflects the past 12 months.
Top Performing Airbnb Hosts in Vellanki Agros (2025)
Learn from the best! This table showcases top-performing Airbnb hosts in Vellanki Agros based on the number of properties managed and estimated total revenue over the past year. Analyze their scale and performance metrics.
| Host Name | Properties | Grossing Revenue | Stay Reviews | Avg Rating |
|---|---|---|---|---|
| Uttam | 1 | $17,497 | 75 | 4.83/5.0 |
| Sai Kawshik Reddy | 1 | $12,500 | 14 | 4.86/5.0 |
| Rama Krishna | 1 | $10,939 | 107 | 4.94/5.0 |
| Prakash Goud | 8 | $8,699 | 200 | 4.66/5.0 |
| Padmavathy | 1 | $8,399 | 58 | 4.86/5.0 |
| Kolan Puneeth | 2 | $2,044 | 3 | Not Rated |
| Sameera | 1 | $1,754 | 57 | 4.77/5.0 |
| Shubham | 1 | $1,236 | 29 | 4.62/5.0 |
| Kishore | 1 | $1,004 | 30 | 4.77/5.0 |
| Akthar | 1 | $235 | 2 | Not Rated |
Analyzing the strategies of top hosts, such as their property selection, pricing, and guest communication, can offer valuable lessons for optimizing your own Airbnb operations in Vellanki Agros.
Dive Deeper: Advanced Vellanki Agros STR Market Data (2025)
Ready to unlock more insights? AirROI provides access to advanced metrics and comprehensive Airbnb data for Vellanki Agros. Explore detailed analytics beyond this report to refine your investment strategy, optimize pricing, and maximize your vacation rental profits.
Explore Advanced MetricsVellanki Agros Short-Term Rental Market Composition (2025): Property & Room Types
Room Type Distribution
Property Type Distribution
Market Composition Insights for Vellanki Agros
- The Vellanki Agros Airbnb market composition is heavily skewed towards Entire Home/Apt listings, which make up 94.4% of the 18 active rentals. This indicates strong guest preference for privacy and space.
- Looking at the property type distribution in Vellanki Agros, Apartment/Condo properties are the most common (61.1%), reflecting the local real estate landscape.
Vellanki Agros Airbnb Room Capacity Analysis (2025): Bedroom Distribution
Distribution of Listings by Number of Bedrooms
Room Capacity Insights for Vellanki Agros
- The dominant room capacity in Vellanki Agros is 2 bedrooms listings, making up 38.9% of the market. This suggests a strong demand for properties suitable for couples or solo travelers.
- Together, 2 bedrooms and 4 bedrooms properties represent 66.7% of the active Airbnb listings in Vellanki Agros, indicating a high concentration in these sizes.
- A significant 44.5% of listings offer 3+ bedrooms, catering to larger groups and families seeking more space in Vellanki Agros.
Vellanki Agros Vacation Rental Guest Capacity Trends (2025)
Distribution of Listings by Guest Capacity
Guest Capacity Insights for Vellanki Agros
- The most common guest capacity trend in Vellanki Agros vacation rentals is listings accommodating 8+ guests (38.9%). This suggests the primary traveler segment is likely larger groups.
- Properties designed for 8+ guests and 4 guests dominate the Vellanki Agros STR market, accounting for 66.7% of listings.
- 55.6% of properties accommodate 6+ guests, serving the market segment for larger families or group travel in Vellanki Agros.
- On average, properties in Vellanki Agros are equipped to host 5.7 guests.
Vellanki Agros Airbnb Booking Patterns (2025): Available vs. Booked Days
Available Days Distribution
Booked Days Distribution
Booking Pattern Insights for Vellanki Agros
- The most common availability pattern in Vellanki Agros falls within the 271-366 days range, representing 94.4% of listings. This suggests many properties have significant open periods on their calendars.
- Approximately 100.0% of listings show high availability (181+ days open annually), indicating potential for increased bookings or specific owner usage patterns.
- For booked days, the 1-30 days range is most frequent in Vellanki Agros (66.7%), reflecting common guest stay durations or potential owner blocking patterns.
Vellanki Agros Airbnb Minimum Stay Requirements Analysis
Distribution of Listings by Minimum Night Requirement
1 Night
18 listings
100% of total
Key Insights
- The most prevalent minimum stay requirement in Vellanki Agros is 1 Night, adopted by 100% of listings. This highlights the market's preference for shorter, flexible bookings.
- A strong majority (100.0%) of the Vellanki Agros Airbnb data shows acceptance of very short stays (1-2 nights), indicating a dynamic, high-turnover market.
Recommendations
- Align with the market by considering a 1 Night minimum stay, as 100% of Vellanki Agros hosts use this setting.
- Adjust minimum nights based on seasonality – potentially shorter during low season and longer during peak demand periods in Vellanki Agros.
Vellanki Agros Airbnb Cancellation Policy Trends Analysis (2025)
Flexible
4 listings
22.2% of total
Moderate
10 listings
55.6% of total
Firm
2 listings
11.1% of total
Strict
2 listings
11.1% of total
Cancellation Policy Insights for Vellanki Agros
- The prevailing Airbnb cancellation policy trend in Vellanki Agros is Moderate, used by 55.6% of listings.
- The market strongly favors guest-friendly terms, with 77.8% of listings offering Flexible or Moderate policies. This suggests guests in Vellanki Agros may expect booking flexibility.
Recommendations for Hosts
- Consider adopting a Moderate policy to align with the 55.6% market standard in Vellanki Agros.
- Using a Strict policy might deter some guests, as only 11.1% of listings use it. Evaluate if potential revenue protection outweighs possible lower booking rates.
- Regularly review your cancellation policy against competitors and market demand shifts in Vellanki Agros.
Vellanki Agros STR Booking Lead Time Analysis (2025)
Average Booking Lead Time by Month
Booking Lead Time Insights for Vellanki Agros
- The overall average booking lead time for vacation rentals in Vellanki Agros is 9 days.
- Guests book furthest in advance for stays during April (average 14 days), likely coinciding with peak travel demand or local events.
- The shortest booking windows occur for stays in March (average 2 days), indicating more last-minute travel plans during this time.
- Seasonally, Winter (11 days avg.) sees the longest lead times, while Spring (8 days avg.) has the shortest, reflecting typical travel planning cycles.
Recommendations for Hosts
- Use the overall average lead time (9 days) as a baseline for your pricing and availability strategy in Vellanki Agros.
- Target marketing efforts for the Winter season well in advance (at least 11 days) to capture early planners.
- Monitor your own booking lead times against these Vellanki Agros averages to identify opportunities for dynamic pricing adjustments.
Popular & Essential Airbnb Amenities in Vellanki Agros (2025)
Amenity Prevalence
Amenity Insights for Vellanki Agros
- Essential amenities in Vellanki Agros that guests expect include: TV, Air conditioning. Lacking these (any) could significantly impact bookings.
- Popular amenities like Wifi, Free parking on premises, Refrigerator are common but not universal. Offering these can provide a competitive edge.
- Warning: Wifi is not universally provided but is considered essential globally. Ensure reliable Wifi is offered.
Recommendations for Hosts
- Ensure your listing includes all essential amenities for Vellanki Agros: TV, Air conditioning.
- Consider adding popular differentiators like Wifi or Free parking on premises to increase appeal.
- Highlight unique or less common amenities you offer (e.g., hot tub, dedicated workspace, EV charger) in your listing description and photos.
- Regularly check competitor amenities in Vellanki Agros to stay competitive.
Vellanki Agros Airbnb Guest Demographics & Profile Analysis (2025)
Guest Profile Summary for Vellanki Agros
- The typical guest profile for Airbnb in Vellanki Agros consists of primarily domestic travelers (69%), often arriving from nearby Hyderabad, typically belonging to the Post-2000s (Gen Z/Alpha) group (50%), primarily speaking English or Hindi.
- Domestic travelers account for 68.8% of guests.
- Key international markets include India (68.8%) and United States (15.6%).
- Top languages spoken are English (37.3%) followed by Hindi (33.3%).
- A significant demographic segment is the Post-2000s (Gen Z/Alpha) group, representing 50% of guests.
Recommendations for Hosts
- Target domestic marketing efforts towards travelers from Hyderabad and Bengaluru.
- Tailor amenities and listing descriptions to appeal to the dominant Post-2000s (Gen Z/Alpha) demographic (e.g., highlight fast WiFi, smart home features, local guides).
- Highlight unique local experiences or amenities relevant to the primary guest profile.
- Consider seasonal promotions aligned with peak travel times for key origin markets.
Nearby Short-Term Rental Market Comparison
How does the Vellanki Agros Airbnb market stack up against its neighbors? Compare key performance metrics like average monthly revenue, ADR, and occupancy rates in surrounding areas to understand the broader regional STR landscape.
| Market | Active Properties | Monthly Revenue | Daily Rate | Avg. Occupancy |
|---|---|---|---|---|
| Kanakamamidi | 25 | $858 | $123.41 | 25% |
| Shamirpet mandal | 12 | $509 | $124.39 | 17% |
| Hyderabad | 1,236 | $303 | $46.71 | 30% |
| Secunderabad | 21 | $175 | $28.05 | 32% |