Kanakamamidi Airbnb Market Analysis 2026: Short Term Rental Data & Vacation Rental Statistics in Telangana, India
Is Airbnb profitable in Kanakamamidi in 2026? Explore comprehensive Airbnb analytics for Kanakamamidi, Telangana, India to uncover income potential. This 2026 STR market report for Kanakamamidi, based on AirROI data from February 2025 to January 2026, reveals key trends in the niche market of 23 active listings.
Whether you're considering an Airbnb investment in Kanakamamidi, optimizing your existing vacation rental, or exploring rental arbitrage opportunities, understanding the Kanakamamidi Airbnb data is crucial. Leveraging the low regulation environment is key to maximizing your short term rental income potential. Let's dive into the specifics.
Key Kanakamamidi Airbnb Performance Metrics Overview
Monthly Airbnb Revenue Variations & Income Potential in Kanakamamidi (2026)
Understanding the monthly revenue variations for Airbnb listings in Kanakamamidi is key to maximizing your short term rental income potential. Seasonality significantly impacts earnings. Our analysis, based on data from the past 12 months, shows that the peak revenue month for STRs in Kanakamamidi is typically March, while September often presents the lowest earnings, highlighting opportunities for strategic pricing adjustments during shoulder and low seasons. Explore the typical Airbnb income in Kanakamamidi across different performance tiers:
- Best-in-class properties (Top 10%) achieve $1,513+ monthly, often utilizing dynamic pricing and superior guest experiences.
- Strong performing properties (Top 25%) earn $1,175 or more, indicating effective management and desirable locations/amenities.
- Typical properties (Median) generate around $823 per month, representing the average market performance.
- Entry-level properties (Bottom 25%) see earnings around $510, often with potential for optimization.
Average Monthly Airbnb Earnings Trend in Kanakamamidi
Kanakamamidi Airbnb Occupancy Rate Trends (2026)
Maximize your bookings by understanding the Kanakamamidi STR occupancy trends. Seasonal demand shifts significantly influence how often properties are booked. Typically, Novembersees the highest demand (peak season occupancy), while September experiences the lowest (low season). Effective strategies, like adjusting minimum stays or offering promotions, can boost occupancy during slower periods. Here's how different property tiers perform in Kanakamamidi:
- Best-in-class properties (Top 10%) achieve 46%+ occupancy, indicating high desirability and potentially optimized availability.
- Strong performing properties (Top 25%) maintain 37% or higher occupancy, suggesting good market fit and guest satisfaction.
- Typical properties (Median) have an occupancy rate around 25%.
- Entry-level properties (Bottom 25%) average 16% occupancy, potentially facing higher vacancy.
Average Monthly Occupancy Rate Trend in Kanakamamidi
Average Daily Rate (ADR) Airbnb Trends in Kanakamamidi (2026)
Effective short term rental pricing strategy in Kanakamamidi involves understanding monthly ADR fluctuations. The Average Daily Rate (ADR) for Airbnb in Kanakamamidi typically peaks in December and dips lowest during August. Leveraging Airbnb dynamic pricing tools or strategies based on this seasonality can significantly boost revenue. Here's a look at the typical nightly rates achieved:
- Best-in-class properties (Top 10%) command rates of $179+ per night, often due to premium features or locations.
- Strong performing properties (Top 25%) achieve nightly rates of $132 or more.
- Typical properties (Median) charge around $101 per night.
- Entry-level properties (Bottom 25%) earn around $89 per night.
Average Daily Rate (ADR) Trend by Month in Kanakamamidi
Get Live Kanakamamidi Market Intelligence 👇

Explore Real-time Analytics
Airbnb Seasonality Analysis & Trends in Kanakamamidi (2026)
Peak Season (March, August, November)
- Revenue averages $1,045 per month
- Occupancy rates average 32.0%
- Daily rates average $116
Shoulder Season
- Revenue averages $901 per month
- Occupancy maintains around 26.9%
- Daily rates hold near $117
Low Season (January, September, October)
- Revenue drops to average $670 per month
- Occupancy decreases to average 22.2%
- Daily rates adjust to average $115
Seasonality Insights for Kanakamamidi
- The Airbnb seasonality in Kanakamamidi shows moderate seasonality with distinct peak and low periods. While the sections above show seasonal averages, it's also insightful to look at the extremes:
- During the high season, the absolute peak month showcases Kanakamamidi's highest earning potential, with monthly revenues capable of climbing to $1,116, occupancy reaching a high of 32.1%, and ADRs peaking at $123.
- Conversely, the slowest single month of the year, typically falling within the low season, marks the market's lowest point. In this month, revenue might dip to $533, occupancy could drop to 17.7%, and ADRs may adjust down to $113.
- Understanding both the seasonal averages and these monthly peaks and troughs in revenue, occupancy, and ADR is crucial for maximizing your Airbnb profit potential in Kanakamamidi.
Seasonal Strategies for Maximizing Profit
- Peak Season: Maximize revenue through premium pricing and potentially longer minimum stays. Ensure high availability.
- Low Season: Offer competitive pricing, special promotions (e.g., extended stay discounts), and flexible cancellation policies. Target off-season travelers like remote workers or budget-conscious guests.
- Shoulder Seasons: Implement dynamic pricing that balances peak and low rates. Target weekend travelers or specific events. Offer slightly more flexible terms than peak season.
- Regularly analyze your own performance against these Kanakamamidi seasonality benchmarks and adjust your pricing and availability strategy accordingly.
Best Areas for Airbnb Investment in Kanakamamidi (2026)
Exploring the top neighborhoods for short-term rentals in Kanakamamidi? This section highlights key areas, outlining why they are attractive for hosts and guests, along with notable local attractions. Consider these locations based on your target guest profile and investment strategy.
| Neighborhood / Area | Why Host Here? (Target Guests & Appeal) | Key Attractions & Landmarks |
|---|---|---|
| Madhapur | A bustling IT hub and popular area for tech professionals visiting for work. Madhapur is known for its proximity to major tech companies and has a variety of restaurants, cafes, and entertainment options. | Hitech City, Cyber Towers, Shilparamam, Inorbit Mall, Mindspace IT Park |
| Banjara Hills | An upscale residential and commercial area known for its luxurious lifestyle, shopping malls, and fine dining. Banjara Hills attracts affluent travelers looking for a premium experience in Hyderabad. | Hyderabad Times Square, Banjara Hills Park, KBR National Park, Gachibowli Football Stadium, Shilparamam |
| Gachibowli | A key financial and business district that is home to many startups and established companies. Gachibowli is ideal for business travelers and offers several hotels and accommodations suited for working professionals. | Waverock, Kakatiya Hills, Gachibowli Stadium, ICICI Bank HQ, Infosys Campus |
| Hitech City | A major technology and business hub, Hitech City attracts a lot of tech-savvy tourists. It has numerous dining and entertainment options, making it suitable for both leisure and business stays. | Inorbit Mall, Ecospace, Cyberabad Police Commissionerate, Raheja Mindspace, Durgam Cheruvu Park |
| Sikandrabad | A well-developed suburb with a mix of residential and commercial spaces, Sikandrabad caters to visitors seeking both comfort and accessibility to Hyderabad's main attractions. | Sanjivaiah Park, Sikandrabad Railway Station, Shopping malls, Restaurants, Cultural Centers |
| Kondapur | A vibrant suburban area popular with families and young professionals. It is known for its community feel, local markets, and proximity to tech parks and educational institutions. | Kondapur Lake, Shilpa Layout Park, Kondapur Markets, Nearby IT Parks, Restaurants |
| Jubilee Hills | A prestigious neighborhood that is home to celebrities and affluent individuals. Jubilee Hills has luxurious accommodations and provides an exclusive stay experience for high-end tourists. | Jubilee Hills Check Post, Restaurants and Lounges, Parks, Temples, Shops |
| Secunderabad | A historic area with a blend of traditional and modern influences. Secunderabad is well-connected and has a range of attractions making it suitable for different types of visitors. | Secunderabad Lake, St. Mary's Church, Shopping Centers, Cultural Institutions, Various Gardens |
Understanding Airbnb License Requirements & STR Laws in Kanakamamidi (2026)
While Kanakamamidi, Telangana, India currently shows low STR regulations, specific Airbnb license requirements might still exist or change. Always verify the latest short term rental regulations and Airbnb license requirements directly with local government authorities for Kanakamamidi to ensure full compliance before hosting.
(Source: AirROI data, 2026, finding no licensed listings among those analyzed)
Top Performing Airbnb Properties in Kanakamamidi (2026)
Benchmark your potential! Explore examples of top-performing Airbnb properties in Kanakamamidibased on Trailing Twelve Month (TTM) revenue. Analyze their characteristics, revenue, occupancy rate, and ADR to understand what drives success in this market.

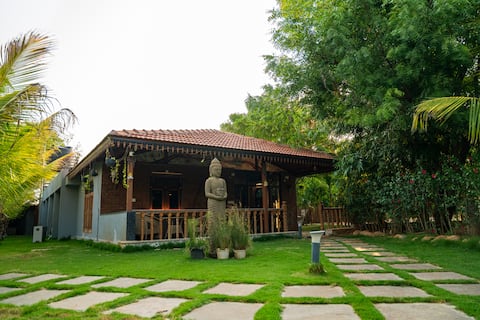
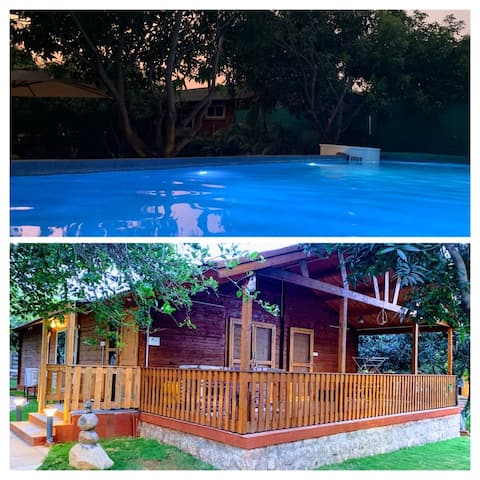
Mangowoods Retreat with Private Pool
Entire Place • 3 bedrooms
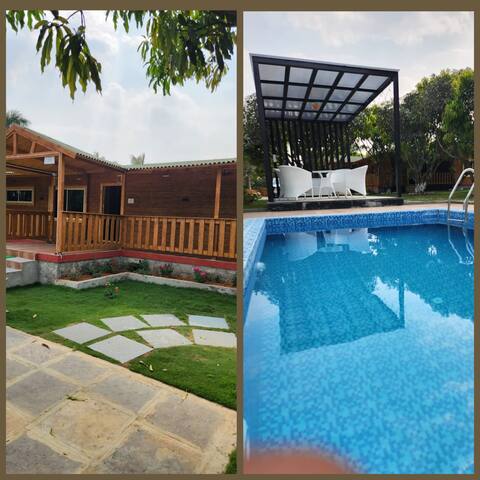
"Mango Mist: Villa 8" Farm House with Private Pool
Entire Place • 3 bedrooms
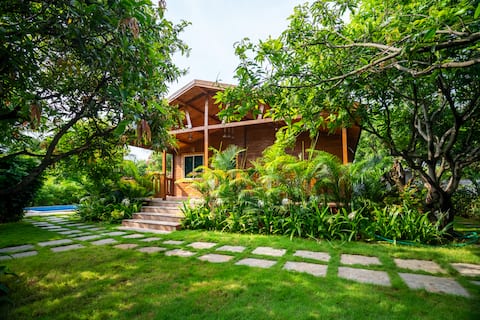
"Serenity: Villa 5" Farm House with Private Pool
Entire Place • 2 bedrooms
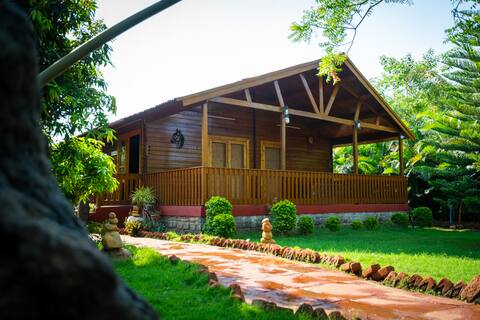
Euphoria Wooden Farmhouse with Private Pool
Entire Place • 3 bedrooms
"WoodCounty:Villa 17" Farm House with Private Pool
Entire Place • 2 bedrooms
Mangowoods Eternity: Cottage with Private Pool
Entire Place • 2 bedrooms
Note: Performance varies based on location, size, amenities, seasonality, and management quality. Data reflects the past 12 months.
Top Performing Airbnb Hosts in Kanakamamidi (2026)
Learn from the best! This table showcases top-performing Airbnb hosts in Kanakamamidi based on the number of properties managed and estimated total revenue over the past year. Analyze their scale and performance metrics.
| Host Name | Properties | Grossing Revenue | Stay Reviews | Avg Rating |
|---|---|---|---|---|
| Pavan Kumar Reddy | 6 | $72,317 | 382 | 4.85/5.0 |
| Jeevan | 3 | $27,703 | 153 | 4.88/5.0 |
| Naresh Kumar Reddy | 2 | $18,889 | 66 | 4.92/5.0 |
| Mangowoods | 1 | $18,481 | 22 | 4.86/5.0 |
| Chaitanya | 1 | $13,362 | 124 | 4.77/5.0 |
| Naresh Kumar Reddy | 1 | $12,169 | 120 | 4.80/5.0 |
| Ayaan Hospitality Services | 1 | $12,018 | 33 | 4.91/5.0 |
| Chirag N Raval | 1 | $9,952 | 14 | 4.86/5.0 |
| Swamy Naidu | 1 | $8,235 | 26 | 4.65/5.0 |
| Kavitha | 1 | $6,665 | 76 | 4.88/5.0 |
Analyzing the strategies of top hosts, such as their property selection, pricing, and guest communication, can offer valuable lessons for optimizing your own Airbnb operations in Kanakamamidi.
Dive Deeper: Advanced Kanakamamidi STR Market Data (2026)
Ready to unlock more insights? AirROI provides access to advanced metrics and comprehensive Airbnb data for Kanakamamidi. Explore detailed analytics beyond this report to refine your investment strategy, optimize pricing, and maximize your vacation rental profits.
Explore Advanced MetricsKanakamamidi Short-Term Rental Market Composition (2026): Property & Room Types
Room Type Distribution
Property Type Distribution
Market Composition Insights for Kanakamamidi
- The Kanakamamidi Airbnb market composition is heavily skewed towards Entire Home/Apt listings, which make up 100% of the 23 active rentals. This indicates strong guest preference for privacy and space.
- Looking at the property type distribution in Kanakamamidi, Outdoor/Unique properties are the most common (60.9%), reflecting the local real estate landscape.
- Houses represent a significant 30.4% portion, catering likely to families or larger groups.
- Smaller segments like unique stays, others (combined 8.6%) offer potential for unique stay experiences.
Kanakamamidi Airbnb Room Capacity Analysis (2026): Bedroom Distribution
Distribution of Listings by Number of Bedrooms
Room Capacity Insights for Kanakamamidi
- The dominant room capacity in Kanakamamidi is 2 bedrooms listings, making up 56.5% of the market. This suggests a strong demand for properties suitable for couples or solo travelers.
- Together, 2 bedrooms and 3 bedrooms properties represent 95.6% of the active Airbnb listings in Kanakamamidi, indicating a high concentration in these sizes.
- A significant 43.4% of listings offer 3+ bedrooms, catering to larger groups and families seeking more space in Kanakamamidi.
Kanakamamidi Vacation Rental Guest Capacity Trends (2026)
Distribution of Listings by Guest Capacity
Guest Capacity Insights for Kanakamamidi
- The most common guest capacity trend in Kanakamamidi vacation rentals is listings accommodating 8+ guests (91.3%). This suggests the primary traveler segment is likely larger groups.
- Properties designed for 8+ guests and 6 guests dominate the Kanakamamidi STR market, accounting for 100.0% of listings.
- 100.0% of properties accommodate 6+ guests, serving the market segment for larger families or group travel in Kanakamamidi.
- On average, properties in Kanakamamidi are equipped to host 7.8 guests.
Kanakamamidi Airbnb Booking Patterns (2026): Available vs. Booked Days
Available Days Distribution
Booked Days Distribution
Booking Pattern Insights for Kanakamamidi
- The most common availability pattern in Kanakamamidi falls within the 181-270 days range, representing 52.2% of listings. This suggests many properties have significant open periods on their calendars.
- Approximately 100.0% of listings show high availability (181+ days open annually), indicating potential for increased bookings or specific owner usage patterns.
- For booked days, the 91-180 days range is most frequent in Kanakamamidi (56.5%), reflecting common guest stay durations or potential owner blocking patterns.
Kanakamamidi Airbnb Minimum Stay Requirements Analysis
Distribution of Listings by Minimum Night Requirement
1 Night
23 listings
100% of total
Key Insights
- The most prevalent minimum stay requirement in Kanakamamidi is 1 Night, adopted by 100% of listings. This highlights the market's preference for shorter, flexible bookings.
- A strong majority (100.0%) of the Kanakamamidi Airbnb data shows acceptance of very short stays (1-2 nights), indicating a dynamic, high-turnover market.
Recommendations
- Align with the market by considering a 1 Night minimum stay, as 100% of Kanakamamidi hosts use this setting.
- Adjust minimum nights based on seasonality – potentially shorter during low season and longer during peak demand periods in Kanakamamidi.
Kanakamamidi Airbnb Cancellation Policy Trends Analysis (2026)
Limited
1 listings
4.3% of total
Flexible
9 listings
39.1% of total
Moderate
9 listings
39.1% of total
Firm
4 listings
17.4% of total
Cancellation Policy Insights for Kanakamamidi
- The prevailing Airbnb cancellation policy trend in Kanakamamidi is Flexible, used by 39.1% of listings.
- The market strongly favors guest-friendly terms, with 78.2% of listings offering Flexible or Moderate policies. This suggests guests in Kanakamamidi may expect booking flexibility.
Recommendations for Hosts
- Consider adopting a Flexible policy to align with the 39.1% market standard in Kanakamamidi.
- Regularly review your cancellation policy against competitors and market demand shifts in Kanakamamidi.
Kanakamamidi STR Booking Lead Time Analysis (2026)
Average Booking Lead Time by Month
Booking Lead Time Insights for Kanakamamidi
- The overall average booking lead time for vacation rentals in Kanakamamidi is 30 days.
- Guests book furthest in advance for stays during November (average 49 days), likely coinciding with peak travel demand or local events.
- The shortest booking windows occur for stays in June (average 16 days), indicating more last-minute travel plans during this time.
- Seasonally, Fall (37 days avg.) sees the longest lead times, while Spring (17 days avg.) has the shortest, reflecting typical travel planning cycles.
Recommendations for Hosts
- Use the overall average lead time (30 days) as a baseline for your pricing and availability strategy in Kanakamamidi.
- For November stays, consider implementing length-of-stay discounts or slightly higher rates for bookings made less than 49 days out to capitalize on advance planning.
- Target marketing efforts for the Fall season well in advance (at least 37 days) to capture early planners.
- Monitor your own booking lead times against these Kanakamamidi averages to identify opportunities for dynamic pricing adjustments.
Popular & Essential Airbnb Amenities in Kanakamamidi (2026)
Amenity Prevalence
Amenity Insights for Kanakamamidi
- Essential amenities in Kanakamamidi that guests expect include: Wifi, Air conditioning, Pool. Lacking these (any) could significantly impact bookings.
- Popular amenities like Kitchen, Free parking on premises, BBQ grill are common but not universal. Offering these can provide a competitive edge.
Recommendations for Hosts
- Ensure your listing includes all essential amenities for Kanakamamidi: Wifi, Air conditioning, Pool.
- Prioritize adding missing essentials: Pool.
- Consider adding popular differentiators like Kitchen or Free parking on premises to increase appeal.
- Highlight unique or less common amenities you offer (e.g., hot tub, dedicated workspace, EV charger) in your listing description and photos.
- Regularly check competitor amenities in Kanakamamidi to stay competitive.
Kanakamamidi Airbnb Guest Demographics & Profile Analysis (2026)
Guest Profile Summary for Kanakamamidi
- The typical guest profile for Airbnb in Kanakamamidi consists of primarily domestic travelers (90%), often arriving from nearby Hyderabad, typically belonging to the Post-2000s (Gen Z/Alpha) group (50%), primarily speaking English or Hindi.
- Domestic travelers account for 89.6% of guests.
- Key international markets include India (89.6%) and United States (6%).
- Top languages spoken are English (39.4%) followed by Hindi (34%).
- A significant demographic segment is the Post-2000s (Gen Z/Alpha) group, representing 50% of guests.
Recommendations for Hosts
- Target domestic marketing efforts towards travelers from Hyderabad and Bengaluru.
- Tailor amenities and listing descriptions to appeal to the dominant Post-2000s (Gen Z/Alpha) demographic (e.g., highlight fast WiFi, smart home features, local guides).
- Highlight unique local experiences or amenities relevant to the primary guest profile.
- Consider seasonal promotions aligned with peak travel times for key origin markets.
Nearby Short-Term Rental Market Comparison
How does the Kanakamamidi Airbnb market stack up against its neighbors? Compare key performance metrics like average monthly revenue, ADR, and occupancy rates in surrounding areas to understand the broader regional STR landscape.
| Market | Active Properties | Monthly Revenue | Daily Rate | Avg. Occupancy |
|---|---|---|---|---|
| Shamirpet mandal | 12 | $614 | $117.44 | 20% |
| Nānakrāmguda | 12 | $300 | $71.33 | 29% |
| Hyderabad | 1,333 | $265 | $44.12 | 29% |
| Vellanki Agros | 18 | $211 | $74.76 | 13% |
| Kondapur | 31 | $188 | $40.76 | 30% |
| Secunderabad | 27 | $147 | $28.27 | 30% |
| Serilingampalle (M) | 36 | $100 | $17.43 | 29% |