Yelagiri Airbnb Market Analysis 2026: Short Term Rental Data & Vacation Rental Statistics in Tamil Nadu, India
Is Airbnb profitable in Yelagiri in 2026? Explore comprehensive Airbnb analytics for Yelagiri, Tamil Nadu, India to uncover income potential. This 2026 STR market report for Yelagiri, based on AirROI data from February 2025 to January 2026, reveals key trends in the niche market of 25 active listings.
Whether you're considering an Airbnb investment in Yelagiri, optimizing your existing vacation rental, or exploring rental arbitrage opportunities, understanding the Yelagiri Airbnb data is crucial. Leveraging the low regulation environment is key to maximizing your short term rental income potential. Let's dive into the specifics.
Key Yelagiri Airbnb Performance Metrics Overview
Monthly Airbnb Revenue Variations & Income Potential in Yelagiri (2026)
Understanding the monthly revenue variations for Airbnb listings in Yelagiri is key to maximizing your short term rental income potential. Seasonality significantly impacts earnings. Our analysis, based on data from the past 12 months, shows that the peak revenue month for STRs in Yelagiri is typically December, while February often presents the lowest earnings, highlighting opportunities for strategic pricing adjustments during shoulder and low seasons. Explore the typical Airbnb income in Yelagiri across different performance tiers:
- Best-in-class properties (Top 10%) achieve $930+ monthly, often utilizing dynamic pricing and superior guest experiences.
- Strong performing properties (Top 25%) earn $545 or more, indicating effective management and desirable locations/amenities.
- Typical properties (Median) generate around $320 per month, representing the average market performance.
- Entry-level properties (Bottom 25%) see earnings around $161, often with potential for optimization.
Average Monthly Airbnb Earnings Trend in Yelagiri
Yelagiri Airbnb Occupancy Rate Trends (2026)
Maximize your bookings by understanding the Yelagiri STR occupancy trends. Seasonal demand shifts significantly influence how often properties are booked. Typically, Decembersees the highest demand (peak season occupancy), while April experiences the lowest (low season). Effective strategies, like adjusting minimum stays or offering promotions, can boost occupancy during slower periods. Here's how different property tiers perform in Yelagiri:
- Best-in-class properties (Top 10%) achieve 43%+ occupancy, indicating high desirability and potentially optimized availability.
- Strong performing properties (Top 25%) maintain 27% or higher occupancy, suggesting good market fit and guest satisfaction.
- Typical properties (Median) have an occupancy rate around 14%.
- Entry-level properties (Bottom 25%) average 7% occupancy, potentially facing higher vacancy.
Average Monthly Occupancy Rate Trend in Yelagiri
Average Daily Rate (ADR) Airbnb Trends in Yelagiri (2026)
Effective short term rental pricing strategy in Yelagiri involves understanding monthly ADR fluctuations. The Average Daily Rate (ADR) for Airbnb in Yelagiri typically peaks in December and dips lowest during July. Leveraging Airbnb dynamic pricing tools or strategies based on this seasonality can significantly boost revenue. Here's a look at the typical nightly rates achieved:
- Best-in-class properties (Top 10%) command rates of $180+ per night, often due to premium features or locations.
- Strong performing properties (Top 25%) achieve nightly rates of $98 or more.
- Typical properties (Median) charge around $62 per night.
- Entry-level properties (Bottom 25%) earn around $47 per night.
Average Daily Rate (ADR) Trend by Month in Yelagiri
Get Live Yelagiri Market Intelligence 👇

Explore Real-time Analytics
Airbnb Seasonality Analysis & Trends in Yelagiri (2026)
Peak Season (December, September, August)
- Revenue averages $598 per month
- Occupancy rates average 24.3%
- Daily rates average $89
Shoulder Season
- Revenue averages $418 per month
- Occupancy maintains around 18.2%
- Daily rates hold near $89
Low Season (February, March, June)
- Revenue drops to average $330 per month
- Occupancy decreases to average 17.1%
- Daily rates adjust to average $88
Seasonality Insights for Yelagiri
- The Airbnb seasonality in Yelagiri shows highly seasonal trends requiring careful strategy. While the sections above show seasonal averages, it's also insightful to look at the extremes:
- During the high season, the absolute peak month showcases Yelagiri's highest earning potential, with monthly revenues capable of climbing to $823, occupancy reaching a high of 27.7%, and ADRs peaking at $93.
- Conversely, the slowest single month of the year, typically falling within the low season, marks the market's lowest point. In this month, revenue might dip to $250, occupancy could drop to 13.1%, and ADRs may adjust down to $85.
- Understanding both the seasonal averages and these monthly peaks and troughs in revenue, occupancy, and ADR is crucial for maximizing your Airbnb profit potential in Yelagiri.
Seasonal Strategies for Maximizing Profit
- Peak Season: Maximize revenue through premium pricing and potentially longer minimum stays. Ensure high availability.
- Low Season: Offer competitive pricing, special promotions (e.g., extended stay discounts), and flexible cancellation policies. Target off-season travelers like remote workers or budget-conscious guests.
- Shoulder Seasons: Implement dynamic pricing that balances peak and low rates. Target weekend travelers or specific events. Offer slightly more flexible terms than peak season.
- Regularly analyze your own performance against these Yelagiri seasonality benchmarks and adjust your pricing and availability strategy accordingly.
Best Areas for Airbnb Investment in Yelagiri (2026)
Exploring the top neighborhoods for short-term rentals in Yelagiri? This section highlights key areas, outlining why they are attractive for hosts and guests, along with notable local attractions. Consider these locations based on your target guest profile and investment strategy.
| Neighborhood / Area | Why Host Here? (Target Guests & Appeal) | Key Attractions & Landmarks |
|---|---|---|
| Yelagiri Hill | A popular hill station known for its pleasant climate, lush green landscapes, and adventure activities. Ideal for families and nature lovers looking for a retreat. | Jalakandeswarar Temple, Yelagiri Lake, Nature Park, Wind Farm, Pongal Festival celebrations |
| Athanavur | A quaint village near Yelagiri known for its scenic views and tranquility. Attracts tourists wishing to escape the hustle and bustle of city life. | Athanavur Hill, local temples, scenic trekking trails, cultural heritage |
| Vellore | Nearby city with historical significance and quick access to Yelagiri. Perfect for tourists who want to explore fortresses and temples along with hill station experience. | Vellore Fort, Sripuram Golden Temple, CMC Hospital, Amirthi Zoological Park |
| Kavalur | Known for its astronomy observatory and vivid landscapes, it's a great spot for nature enthusiasts and educational tourism. | Kavalur Observatory, scenic viewpoints, trekking in hill trails, local flora and fauna |
| Nilavoor | A peaceful area with a serene atmosphere, offering a chance to enjoy the beauty of nature away from crowded areas. | Nilavoor Lake, local farms, silence and tranquility, nature walks |
| Punganoor Lake | A picturesque area surrounding the lake, an attraction for picnics and boating, suitable for family visits. | Punganoor Lake, boating activities, nearby parks, scenic picnic spots |
| Mangalam | Another serene village offering beautiful views and heritage sites, perfect for those wanting a blend of cultural and nature experiences. | Mangalam Temple, heritage sites, local handicrafts, nature trails |
| Yelagiri Nature Park | A beautifully maintained park that serves as a major attraction for tourists, ideal for family trips and recreational activities. | botanical garden, play area, aviary, picnic spots |
Understanding Airbnb License Requirements & STR Laws in Yelagiri (2026)
While Yelagiri, Tamil Nadu, India currently shows low STR regulations, specific Airbnb license requirements might still exist or change. Always verify the latest short term rental regulations and Airbnb license requirements directly with local government authorities for Yelagiri to ensure full compliance before hosting.
(Source: AirROI data, 2026, finding no licensed listings among those analyzed)
Top Performing Airbnb Properties in Yelagiri (2026)
Benchmark your potential! Explore examples of top-performing Airbnb properties in Yelagiribased on Trailing Twelve Month (TTM) revenue. Analyze their characteristics, revenue, occupancy rate, and ADR to understand what drives success in this market.

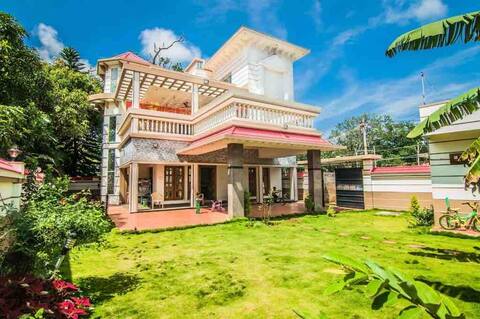
Eco Village: Premium 3-Bedroom AC villa w/ Pool
Entire Place • 3 bedrooms

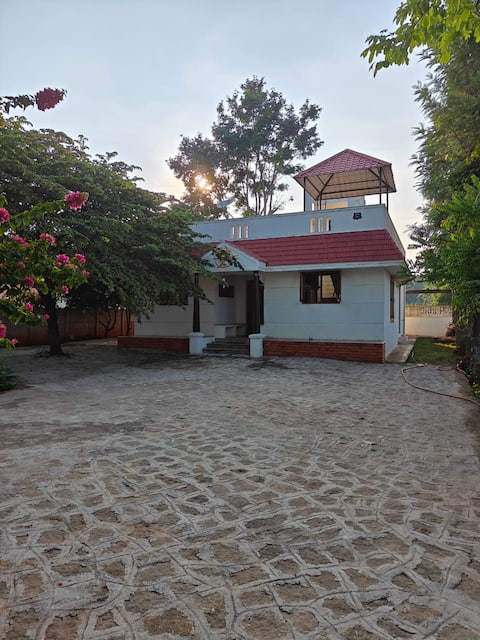
Pine Tree Garden: Luxury 6-Bedroom Villa Retreat
Entire Place • 6 bedrooms

Bamboo House in a Lush Forest
Entire Place • 3 bedrooms
Playhouse Yelagiri 5bhk swings, lawn, Prime area.
Entire Place • 5 bedrooms

Tree house - Spectacular sky views
Entire Place • 1 bedroom
Sundar's Sanctuary
Entire Place • 1 bedroom
Note: Performance varies based on location, size, amenities, seasonality, and management quality. Data reflects the past 12 months.
Top Performing Airbnb Hosts in Yelagiri (2026)
Learn from the best! This table showcases top-performing Airbnb hosts in Yelagiri based on the number of properties managed and estimated total revenue over the past year. Analyze their scale and performance metrics.
| Host Name | Properties | Grossing Revenue | Stay Reviews | Avg Rating |
|---|---|---|---|---|
| Manifold Hospitalities | 6 | $31,924 | 57 | 4.69/5.0 |
| Ganesh | 2 | $15,050 | 479 | 4.71/5.0 |
| Jaaveed | 1 | $7,228 | 4 | 5.00/5.0 |
| Sundar | 1 | $6,607 | 70 | 4.94/5.0 |
| Subramaniam | 5 | $6,214 | 77 | 4.14/5.0 |
| Jeremy | 1 | $4,317 | 85 | 4.79/5.0 |
| Raghu | 1 | $3,393 | 65 | 4.40/5.0 |
| Vasanth | 1 | $3,210 | 32 | 4.84/5.0 |
| Sundar | 1 | $2,744 | 194 | 4.47/5.0 |
| Kashif | 1 | $2,691 | 1 | Not Rated |
Analyzing the strategies of top hosts, such as their property selection, pricing, and guest communication, can offer valuable lessons for optimizing your own Airbnb operations in Yelagiri.
Dive Deeper: Advanced Yelagiri STR Market Data (2026)
Ready to unlock more insights? AirROI provides access to advanced metrics and comprehensive Airbnb data for Yelagiri. Explore detailed analytics beyond this report to refine your investment strategy, optimize pricing, and maximize your vacation rental profits.
Explore Advanced MetricsYelagiri Short-Term Rental Market Composition (2026): Property & Room Types
Room Type Distribution
Property Type Distribution
Market Composition Insights for Yelagiri
- The Yelagiri Airbnb market composition is heavily skewed towards Entire Home/Apt listings, which make up 100% of the 25 active rentals. This indicates strong guest preference for privacy and space.
- Looking at the property type distribution in Yelagiri, House properties are the most common (72%), reflecting the local real estate landscape.
- Houses represent a significant 72% portion, catering likely to families or larger groups.
- Smaller segments like hotel/boutique, apartment/condo, unique stays (combined 12.0%) offer potential for unique stay experiences.
Yelagiri Airbnb Room Capacity Analysis (2026): Bedroom Distribution
Distribution of Listings by Number of Bedrooms
Room Capacity Insights for Yelagiri
- The dominant room capacity in Yelagiri is 2 bedrooms listings, making up 28% of the market. This suggests a strong demand for properties suitable for couples or solo travelers.
- Together, 2 bedrooms and 1 bedroom properties represent 56.0% of the active Airbnb listings in Yelagiri, indicating a high concentration in these sizes.
- A significant 40.0% of listings offer 3+ bedrooms, catering to larger groups and families seeking more space in Yelagiri.
Yelagiri Vacation Rental Guest Capacity Trends (2026)
Distribution of Listings by Guest Capacity
Guest Capacity Insights for Yelagiri
- The most common guest capacity trend in Yelagiri vacation rentals is listings accommodating 8+ guests (64%). This suggests the primary traveler segment is likely larger groups.
- Properties designed for 8+ guests and 4 guests dominate the Yelagiri STR market, accounting for 76.0% of listings.
- 68.0% of properties accommodate 6+ guests, serving the market segment for larger families or group travel in Yelagiri.
- On average, properties in Yelagiri are equipped to host 6.7 guests.
Yelagiri Airbnb Booking Patterns (2026): Available vs. Booked Days
Available Days Distribution
Booked Days Distribution
Booking Pattern Insights for Yelagiri
- The most common availability pattern in Yelagiri falls within the 271-366 days range, representing 76% of listings. This suggests many properties have significant open periods on their calendars.
- Approximately 100.0% of listings show high availability (181+ days open annually), indicating potential for increased bookings or specific owner usage patterns.
- For booked days, the 31-90 days range is most frequent in Yelagiri (36%), reflecting common guest stay durations or potential owner blocking patterns.
Yelagiri Airbnb Minimum Stay Requirements Analysis
Distribution of Listings by Minimum Night Requirement
1 Night
24 listings
96% of total
30+ Nights
1 listings
4% of total
Key Insights
- The most prevalent minimum stay requirement in Yelagiri is 1 Night, adopted by 96% of listings. This highlights the market's preference for shorter, flexible bookings.
- A strong majority (96.0%) of the Yelagiri Airbnb data shows acceptance of very short stays (1-2 nights), indicating a dynamic, high-turnover market.
Recommendations
- Align with the market by considering a 1 Night minimum stay, as 96% of Yelagiri hosts use this setting.
- Adjust minimum nights based on seasonality – potentially shorter during low season and longer during peak demand periods in Yelagiri.
Yelagiri Airbnb Cancellation Policy Trends Analysis (2026)
Flexible
11 listings
44% of total
Moderate
5 listings
20% of total
Firm
3 listings
12% of total
Strict
6 listings
24% of total
Cancellation Policy Insights for Yelagiri
- The prevailing Airbnb cancellation policy trend in Yelagiri is Flexible, used by 44% of listings.
- There's a relatively balanced mix between guest-friendly (64.0%) and stricter (36.0%) policies, offering choices for different guest needs.
Recommendations for Hosts
- Consider adopting a Flexible policy to align with the 44% market standard in Yelagiri.
- Regularly review your cancellation policy against competitors and market demand shifts in Yelagiri.
Yelagiri STR Booking Lead Time Analysis (2026)
Average Booking Lead Time by Month
Booking Lead Time Insights for Yelagiri
- The overall average booking lead time for vacation rentals in Yelagiri is 15 days.
- Guests book furthest in advance for stays during November (average 30 days), likely coinciding with peak travel demand or local events.
- The shortest booking windows occur for stays in February (average 8 days), indicating more last-minute travel plans during this time.
- Seasonally, Fall (22 days avg.) sees the longest lead times, while Spring (11 days avg.) has the shortest, reflecting typical travel planning cycles.
Recommendations for Hosts
- Use the overall average lead time (15 days) as a baseline for your pricing and availability strategy in Yelagiri.
- For November stays, consider implementing length-of-stay discounts or slightly higher rates for bookings made less than 30 days out to capitalize on advance planning.
- Target marketing efforts for the Fall season well in advance (at least 22 days) to capture early planners.
- Monitor your own booking lead times against these Yelagiri averages to identify opportunities for dynamic pricing adjustments.
Popular & Essential Airbnb Amenities in Yelagiri (2026)
Amenity Prevalence
Amenity Insights for Yelagiri
- Popular amenities like Free parking on premises, Backyard, Essentials are common but not universal. Offering these can provide a competitive edge.
Recommendations for Hosts
- Consider adding popular differentiators like Free parking on premises or Backyard to increase appeal.
- Highlight unique or less common amenities you offer (e.g., hot tub, dedicated workspace, EV charger) in your listing description and photos.
- Regularly check competitor amenities in Yelagiri to stay competitive.
Yelagiri Airbnb Guest Demographics & Profile Analysis (2026)
Guest Profile Summary for Yelagiri
- The typical guest profile for Airbnb in Yelagiri consists of primarily domestic travelers (85%), often arriving from nearby Chennai, typically belonging to the Post-2000s (Gen Z/Alpha) group (50%), primarily speaking English or Hindi.
- Domestic travelers account for 85.4% of guests.
- Key international markets include India (85.4%) and United Kingdom (4.2%).
- Top languages spoken are English (36.9%) followed by Hindi (23.1%).
- A significant demographic segment is the Post-2000s (Gen Z/Alpha) group, representing 50% of guests.
Recommendations for Hosts
- Target domestic marketing efforts towards travelers from Chennai and Bengaluru.
- Tailor amenities and listing descriptions to appeal to the dominant Post-2000s (Gen Z/Alpha) demographic (e.g., highlight fast WiFi, smart home features, local guides).
- Highlight unique local experiences or amenities relevant to the primary guest profile.
- Consider seasonal promotions aligned with peak travel times for key origin markets.
Nearby Short-Term Rental Market Comparison
How does the Yelagiri Airbnb market stack up against its neighbors? Compare key performance metrics like average monthly revenue, ADR, and occupancy rates in surrounding areas to understand the broader regional STR landscape.
| Market | Active Properties | Monthly Revenue | Daily Rate | Avg. Occupancy |
|---|---|---|---|---|
| Kadirenahalli | 12 | $1,153 | $108.45 | 36% |
| Chikkabidarakallu | 10 | $794 | $491.62 | 28% |
| Thandiriyan Kuppam | 31 | $686 | $68.11 | 30% |
| Kalapet | 15 | $478 | $87.44 | 18% |
| Yercaud | 79 | $472 | $110.48 | 20% |
| Bommayapalayam | 22 | $466 | $102.17 | 18% |
| Edayanchavadi | 33 | $445 | $61.71 | 27% |
| Puducherry | 522 | $414 | $60.07 | 29% |
| Hosur | 26 | $363 | $100.98 | 19% |
| Suradenapura | 10 | $359 | $103.49 | 13% |