Mahabalipuram Airbnb Market Analysis 2026: Short Term Rental Data & Vacation Rental Statistics in Tamil Nadu, India
Is Airbnb profitable in Mahabalipuram in 2026? Explore comprehensive Airbnb analytics for Mahabalipuram, Tamil Nadu, India to uncover income potential. This 2026 STR market report for Mahabalipuram, based on AirROI data from February 2025 to January 2026, reveals key trends in the niche market of 24 active listings.
Whether you're considering an Airbnb investment in Mahabalipuram, optimizing your existing vacation rental, or exploring rental arbitrage opportunities, understanding the Mahabalipuram Airbnb data is crucial. Leveraging the low regulation environment is key to maximizing your short term rental income potential. Let's dive into the specifics.
Key Mahabalipuram Airbnb Performance Metrics Overview
Monthly Airbnb Revenue Variations & Income Potential in Mahabalipuram (2026)
Understanding the monthly revenue variations for Airbnb listings in Mahabalipuram is key to maximizing your short term rental income potential. Seasonality significantly impacts earnings. Our analysis, based on data from the past 12 months, shows that the peak revenue month for STRs in Mahabalipuram is typically December, while May often presents the lowest earnings, highlighting opportunities for strategic pricing adjustments during shoulder and low seasons. Explore the typical Airbnb income in Mahabalipuram across different performance tiers:
- Best-in-class properties (Top 10%) achieve $2,073+ monthly, often utilizing dynamic pricing and superior guest experiences.
- Strong performing properties (Top 25%) earn $873 or more, indicating effective management and desirable locations/amenities.
- Typical properties (Median) generate around $334 per month, representing the average market performance.
- Entry-level properties (Bottom 25%) see earnings around $157, often with potential for optimization.
Average Monthly Airbnb Earnings Trend in Mahabalipuram
Mahabalipuram Airbnb Occupancy Rate Trends (2026)
Maximize your bookings by understanding the Mahabalipuram STR occupancy trends. Seasonal demand shifts significantly influence how often properties are booked. Typically, Decembersees the highest demand (peak season occupancy), while September experiences the lowest (low season). Effective strategies, like adjusting minimum stays or offering promotions, can boost occupancy during slower periods. Here's how different property tiers perform in Mahabalipuram:
- Best-in-class properties (Top 10%) achieve 45%+ occupancy, indicating high desirability and potentially optimized availability.
- Strong performing properties (Top 25%) maintain 27% or higher occupancy, suggesting good market fit and guest satisfaction.
- Typical properties (Median) have an occupancy rate around 13%.
- Entry-level properties (Bottom 25%) average 8% occupancy, potentially facing higher vacancy.
Average Monthly Occupancy Rate Trend in Mahabalipuram
Average Daily Rate (ADR) Airbnb Trends in Mahabalipuram (2026)
Effective short term rental pricing strategy in Mahabalipuram involves understanding monthly ADR fluctuations. The Average Daily Rate (ADR) for Airbnb in Mahabalipuram typically peaks in December and dips lowest during March. Leveraging Airbnb dynamic pricing tools or strategies based on this seasonality can significantly boost revenue. Here's a look at the typical nightly rates achieved:
- Best-in-class properties (Top 10%) command rates of $228+ per night, often due to premium features or locations.
- Strong performing properties (Top 25%) achieve nightly rates of $144 or more.
- Typical properties (Median) charge around $34 per night.
- Entry-level properties (Bottom 25%) earn around $24 per night.
Average Daily Rate (ADR) Trend by Month in Mahabalipuram
Get Live Mahabalipuram Market Intelligence 👇
Explore Real-time Analytics
Airbnb Seasonality Analysis & Trends in Mahabalipuram (2026)
Peak Season (December, January, October)
- Revenue averages $1,100 per month
- Occupancy rates average 25.8%
- Daily rates average $102
Shoulder Season
- Revenue averages $691 per month
- Occupancy maintains around 20.6%
- Daily rates hold near $89
Low Season (May, June, July)
- Revenue drops to average $467 per month
- Occupancy decreases to average 15.4%
- Daily rates adjust to average $88
Seasonality Insights for Mahabalipuram
- The Airbnb seasonality in Mahabalipuram shows highly seasonal trends requiring careful strategy. While the sections above show seasonal averages, it's also insightful to look at the extremes:
- During the high season, the absolute peak month showcases Mahabalipuram's highest earning potential, with monthly revenues capable of climbing to $1,275, occupancy reaching a high of 29.6%, and ADRs peaking at $103.
- Conversely, the slowest single month of the year, typically falling within the low season, marks the market's lowest point. In this month, revenue might dip to $445, occupancy could drop to 10.5%, and ADRs may adjust down to $84.
- Understanding both the seasonal averages and these monthly peaks and troughs in revenue, occupancy, and ADR is crucial for maximizing your Airbnb profit potential in Mahabalipuram.
Seasonal Strategies for Maximizing Profit
- Peak Season: Maximize revenue through premium pricing and potentially longer minimum stays. Ensure high availability.
- Low Season: Offer competitive pricing, special promotions (e.g., extended stay discounts), and flexible cancellation policies. Target off-season travelers like remote workers or budget-conscious guests.
- Shoulder Seasons: Implement dynamic pricing that balances peak and low rates. Target weekend travelers or specific events. Offer slightly more flexible terms than peak season.
- Regularly analyze your own performance against these Mahabalipuram seasonality benchmarks and adjust your pricing and availability strategy accordingly.
Best Areas for Airbnb Investment in Mahabalipuram (2026)
Exploring the top neighborhoods for short-term rentals in Mahabalipuram? This section highlights key areas, outlining why they are attractive for hosts and guests, along with notable local attractions. Consider these locations based on your target guest profile and investment strategy.
| Neighborhood / Area | Why Host Here? (Target Guests & Appeal) | Key Attractions & Landmarks |
|---|---|---|
| Mahabalipuram Beach | A picturesque beachfront area famous for its scenic beauty and tranquil environment. Ideal for tourists looking to relax by the sea and explore the beachside attractions. | Shore Temple, Pancha Rathas, Mahabalipuram Beach, Krishna's Butterball, Mandapas, Mahabalipuram Lighthouse |
| Descent of the Ganges | An incredible UNESCO World Heritage site that attracts many visitors. It is famous for its rock carvings and historical significance, making it a top destination for culture enthusiasts. | Descent of the Ganges, Arjuna’s Penance, Five Rathas, Ganesh Mandapa, Chariots |
| Auroville | A unique township located a short drive from Mahabalipuram, attracting visitors interested in spirituality, community living, and sustainable development. | Matrimandir, Auroville Beach, Shopping at Auroville, Visitors Center, Bamboo products, Cultural workshops |
| East Coast Road | A scenic highway that runs along the coastline, popular with tourists who want to explore nearby attractions and enjoy the beautiful views while traveling. | ECR Beach, Resorts along ECR, Cafes and eateries, Kottakuppam Beach, Vallakottai Murugan Temple |
| Mamalla Heritage Site | Home to many ancient temples and monuments, this area is rich in history and culture, perfect for visitors interested in heritage tourism. | Tiger Cave, Shore Temple Complex, Ancient carvings, Local handicraft shops, Cultural performances |
| Cenotaphs of Mahabalipuram | Located near the beach, these cenotaphs are a historical site that attracts tourists interested in history and architecture. | Cenotaphs, Rock-cut sculptures, Walking paths, Nearby eateries |
| Mahabalipuram Village | A traditional fishing village that offers a glimpse into local life, perfect for travelers looking for a more authentic experience. | Fishing activities, Local markets, Traditional cuisine, Village walks, Artisan workshops |
| Nemmeli Beach | A less crowded beach destination near Mahabalipuram, known for its tranquility, making it an ideal spot for relaxation and peace away from busy tourist areas. | Nemmeli Beach, Beachfront resorts, Water sports, Local seafood shacks, Sunset views |
Understanding Airbnb License Requirements & STR Laws in Mahabalipuram (2026)
While Mahabalipuram, Tamil Nadu, India currently shows low STR regulations, specific Airbnb license requirements might still exist or change. Always verify the latest short term rental regulations and Airbnb license requirements directly with local government authorities for Mahabalipuram to ensure full compliance before hosting.
(Source: AirROI data, 2026, finding no licensed listings among those analyzed)
Top Performing Airbnb Properties in Mahabalipuram (2026)
Benchmark your potential! Explore examples of top-performing Airbnb properties in Mahabalipurambased on Trailing Twelve Month (TTM) revenue. Analyze their characteristics, revenue, occupancy rate, and ADR to understand what drives success in this market.

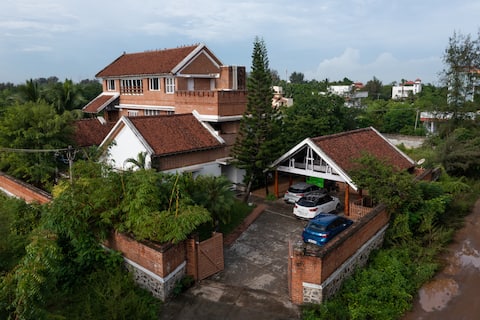
Beach House in Mahabalipuram-154 PearlBeach Annex
Entire Place • 4 bedrooms
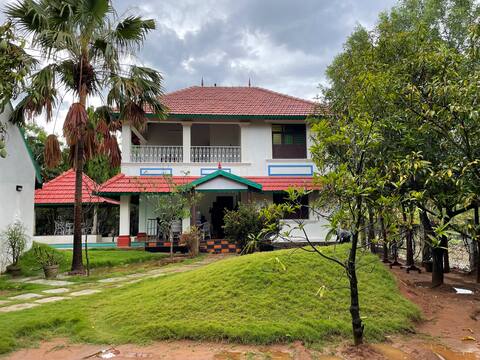
Coast Away- Palatial Heritage Villa Mahabalipuram
Entire Place • 4 bedrooms

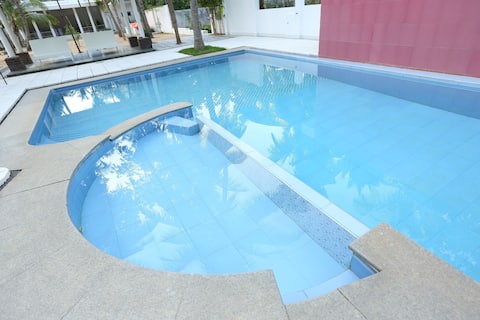
Alamparai Villa W/ Pool&Kayak, 45 Mins From Mahabs
Entire Place • 4 bedrooms
Bangla at Mahabalipuram
Entire Place • 3 bedrooms
Lune Villa: Luxury 3-BHK W/ Pool Mahabalipuram ECR
Entire Place • 3 bedrooms
Tazal Beach House - Grand 3BHK With Pool On ECR
Entire Place • 3 bedrooms
Note: Performance varies based on location, size, amenities, seasonality, and management quality. Data reflects the past 12 months.
Top Performing Airbnb Hosts in Mahabalipuram (2026)
Learn from the best! This table showcases top-performing Airbnb hosts in Mahabalipuram based on the number of properties managed and estimated total revenue over the past year. Analyze their scale and performance metrics.
| Host Name | Properties | Grossing Revenue | Stay Reviews | Avg Rating |
|---|---|---|---|---|
| Venkat | 1 | $38,437 | 15 | 4.93/5.0 |
| Radha | 1 | $33,258 | 152 | 4.81/5.0 |
| Senthur | 4 | $18,387 | 89 | 4.79/5.0 |
| Priya | 1 | $5,333 | 8 | 4.88/5.0 |
| Dessappan | 1 | $3,456 | 15 | 4.87/5.0 |
| V Thangaraj | 2 | $3,074 | 30 | 4.92/5.0 |
| Karthikeyan | 3 | $2,814 | 7 | 4.83/5.0 |
| Prakash | 1 | $2,568 | 7 | 4.71/5.0 |
| Gowtham | 1 | $2,296 | 15 | 4.53/5.0 |
| Logeswaran | 1 | $1,672 | 23 | 4.83/5.0 |
Analyzing the strategies of top hosts, such as their property selection, pricing, and guest communication, can offer valuable lessons for optimizing your own Airbnb operations in Mahabalipuram.
Dive Deeper: Advanced Mahabalipuram STR Market Data (2026)
Ready to unlock more insights? AirROI provides access to advanced metrics and comprehensive Airbnb data for Mahabalipuram. Explore detailed analytics beyond this report to refine your investment strategy, optimize pricing, and maximize your vacation rental profits.
Explore Advanced MetricsMahabalipuram Short-Term Rental Market Composition (2026): Property & Room Types
Room Type Distribution
Property Type Distribution
Market Composition Insights for Mahabalipuram
- The Mahabalipuram Airbnb market composition is heavily skewed towards Entire Home/Apt listings, which make up 54.2% of the 24 active rentals. This indicates strong guest preference for privacy and space.
- However, a notable 45.8% share for Private Rooms suggests opportunities for budget-conscious travelers or hosts renting out spare rooms.
- Looking at the property type distribution in Mahabalipuram, House properties are the most common (66.7%), reflecting the local real estate landscape.
- Houses represent a significant 66.7% portion, catering likely to families or larger groups.
- The presence of 20.8% Hotel/Boutique listings indicates integration with traditional hospitality.
- Smaller segments like others (combined 4.2%) offer potential for unique stay experiences.
Mahabalipuram Airbnb Room Capacity Analysis (2026): Bedroom Distribution
Distribution of Listings by Number of Bedrooms
Room Capacity Insights for Mahabalipuram
- The dominant room capacity in Mahabalipuram is 1 bedroom listings, making up 37.5% of the market. This suggests a strong demand for properties suitable for couples or solo travelers.
- Together, 1 bedroom and 3 bedrooms properties represent 54.2% of the active Airbnb listings in Mahabalipuram, indicating a high concentration in these sizes.
- A significant 29.2% of listings offer 3+ bedrooms, catering to larger groups and families seeking more space in Mahabalipuram.
Mahabalipuram Vacation Rental Guest Capacity Trends (2026)
Distribution of Listings by Guest Capacity
Guest Capacity Insights for Mahabalipuram
- The most common guest capacity trend in Mahabalipuram vacation rentals is listings accommodating 8+ guests (29.2%). This suggests the primary traveler segment is likely larger groups.
- Properties designed for 8+ guests and 2 guests dominate the Mahabalipuram STR market, accounting for 54.2% of listings.
- 41.7% of properties accommodate 6+ guests, serving the market segment for larger families or group travel in Mahabalipuram.
- On average, properties in Mahabalipuram are equipped to host 3.9 guests.
Mahabalipuram Airbnb Booking Patterns (2026): Available vs. Booked Days
Available Days Distribution
Booked Days Distribution
Booking Pattern Insights for Mahabalipuram
- The most common availability pattern in Mahabalipuram falls within the 271-366 days range, representing 87.5% of listings. This suggests many properties have significant open periods on their calendars.
- Approximately 100.0% of listings show high availability (181+ days open annually), indicating potential for increased bookings or specific owner usage patterns.
- For booked days, the 1-30 days range is most frequent in Mahabalipuram (62.5%), reflecting common guest stay durations or potential owner blocking patterns.
Mahabalipuram Airbnb Minimum Stay Requirements Analysis
Distribution of Listings by Minimum Night Requirement
1 Night
21 listings
87.5% of total
2 Nights
2 listings
8.3% of total
30+ Nights
1 listings
4.2% of total
Key Insights
- The most prevalent minimum stay requirement in Mahabalipuram is 1 Night, adopted by 87.5% of listings. This highlights the market's preference for shorter, flexible bookings.
- A strong majority (95.8%) of the Mahabalipuram Airbnb data shows acceptance of very short stays (1-2 nights), indicating a dynamic, high-turnover market.
Recommendations
- Align with the market by considering a 1 Night minimum stay, as 87.5% of Mahabalipuram hosts use this setting.
- Adjust minimum nights based on seasonality – potentially shorter during low season and longer during peak demand periods in Mahabalipuram.
Mahabalipuram Airbnb Cancellation Policy Trends Analysis (2026)
Flexible
16 listings
69.6% of total
Moderate
2 listings
8.7% of total
Firm
4 listings
17.4% of total
Strict
1 listings
4.3% of total
Cancellation Policy Insights for Mahabalipuram
- The prevailing Airbnb cancellation policy trend in Mahabalipuram is Flexible, used by 69.6% of listings.
- The market strongly favors guest-friendly terms, with 78.3% of listings offering Flexible or Moderate policies. This suggests guests in Mahabalipuram may expect booking flexibility.
- Strict cancellation policies are quite rare (4.3%), potentially making listings with this policy less competitive unless justified by high demand or property type.
Recommendations for Hosts
- Consider adopting a Flexible policy to align with the 69.6% market standard in Mahabalipuram.
- Given the high prevalence of Flexible policies (69.6%), offering this can enhance booking appeal, especially during shoulder seasons.
- Using a Strict policy might deter some guests, as only 4.3% of listings use it. Evaluate if potential revenue protection outweighs possible lower booking rates.
- Regularly review your cancellation policy against competitors and market demand shifts in Mahabalipuram.
Mahabalipuram STR Booking Lead Time Analysis (2026)
Average Booking Lead Time by Month
Booking Lead Time Insights for Mahabalipuram
- The overall average booking lead time for vacation rentals in Mahabalipuram is 20 days.
- Guests book furthest in advance for stays during November (average 46 days), likely coinciding with peak travel demand or local events.
- The shortest booking windows occur for stays in June (average 9 days), indicating more last-minute travel plans during this time.
- Seasonally, Fall (30 days avg.) sees the longest lead times, while Spring (10 days avg.) has the shortest, reflecting typical travel planning cycles.
Recommendations for Hosts
- Use the overall average lead time (20 days) as a baseline for your pricing and availability strategy in Mahabalipuram.
- For November stays, consider implementing length-of-stay discounts or slightly higher rates for bookings made less than 46 days out to capitalize on advance planning.
- During June, focus on last-minute booking availability and promotions, as guests book with very short notice (9 days avg.).
- Target marketing efforts for the Fall season well in advance (at least 30 days) to capture early planners.
- Monitor your own booking lead times against these Mahabalipuram averages to identify opportunities for dynamic pricing adjustments.
Popular & Essential Airbnb Amenities in Mahabalipuram (2026)
Amenity Prevalence
Amenity Insights for Mahabalipuram
- Essential amenities in Mahabalipuram that guests expect include: Wifi. Lacking these (this) could significantly impact bookings.
- Popular amenities like Air conditioning, TV, Beach access are common but not universal. Offering these can provide a competitive edge.
Recommendations for Hosts
- Ensure your listing includes all essential amenities for Mahabalipuram: Wifi.
- Consider adding popular differentiators like Air conditioning or TV to increase appeal.
- Highlight unique or less common amenities you offer (e.g., hot tub, dedicated workspace, EV charger) in your listing description and photos.
- Regularly check competitor amenities in Mahabalipuram to stay competitive.
Mahabalipuram Airbnb Guest Demographics & Profile Analysis (2026)
Guest Profile Summary for Mahabalipuram
- The typical guest profile for Airbnb in Mahabalipuram consists of a mix of domestic (55%) and international guests, often arriving from nearby Chennai, typically belonging to the Post-2000s (Gen Z/Alpha) group (50%), primarily speaking English or Hindi.
- Domestic travelers account for 55.2% of guests.
- Key international markets include India (55.2%) and United States (19%).
- Top languages spoken are English (42%) followed by Hindi (26%).
- A significant demographic segment is the Post-2000s (Gen Z/Alpha) group, representing 50% of guests.
Recommendations for Hosts
- Balance marketing efforts between domestic and international channels based on the guest mix.
- Tailor amenities and listing descriptions to appeal to the dominant Post-2000s (Gen Z/Alpha) demographic (e.g., highlight fast WiFi, smart home features, local guides).
- Highlight unique local experiences or amenities relevant to the primary guest profile.
- Consider seasonal promotions aligned with peak travel times for key origin markets.
Nearby Short-Term Rental Market Comparison
How does the Mahabalipuram Airbnb market stack up against its neighbors? Compare key performance metrics like average monthly revenue, ADR, and occupancy rates in surrounding areas to understand the broader regional STR landscape.
| Market | Active Properties | Monthly Revenue | Daily Rate | Avg. Occupancy |
|---|---|---|---|---|
| Tiruporur | 139 | $735 | $129.32 | 24% |
| Thandiriyan Kuppam | 31 | $686 | $68.11 | 30% |
| Ayanambakkam | 20 | $497 | $43.42 | 42% |
| Kalapet | 15 | $478 | $87.44 | 18% |
| Bommayapalayam | 22 | $466 | $102.17 | 18% |
| Edayanchavadi | 33 | $445 | $61.71 | 27% |
| Puducherry | 522 | $414 | $60.07 | 29% |
| Chennai | 941 | $361 | $52.72 | 33% |
| Periya Mudaliar Chavadi | 54 | $324 | $58.87 | 27% |
| Morattandi | 13 | $318 | $84.27 | 22% |