Madurai Airbnb Market Analysis 2026: Short Term Rental Data & Vacation Rental Statistics in Tamil Nadu, India
Is Airbnb profitable in Madurai in 2026? Explore comprehensive Airbnb analytics for Madurai, Tamil Nadu, India to uncover income potential. This 2026 STR market report for Madurai, based on AirROI data from February 2025 to January 2026, reveals key trends in the niche market of 53 active listings.
Whether you're considering an Airbnb investment in Madurai, optimizing your existing vacation rental, or exploring rental arbitrage opportunities, understanding the Madurai Airbnb data is crucial. Leveraging the low regulation environment is key to maximizing your short term rental income potential. Let's dive into the specifics.
Key Madurai Airbnb Performance Metrics Overview
Monthly Airbnb Revenue Variations & Income Potential in Madurai (2026)
Understanding the monthly revenue variations for Airbnb listings in Madurai is key to maximizing your short term rental income potential. Seasonality significantly impacts earnings. Our analysis, based on data from the past 12 months, shows that the peak revenue month for STRs in Madurai is typically December, while April often presents the lowest earnings, highlighting opportunities for strategic pricing adjustments during shoulder and low seasons. Explore the typical Airbnb income in Madurai across different performance tiers:
- Best-in-class properties (Top 10%) achieve $946+ monthly, often utilizing dynamic pricing and superior guest experiences.
- Strong performing properties (Top 25%) earn $621 or more, indicating effective management and desirable locations/amenities.
- Typical properties (Median) generate around $366 per month, representing the average market performance.
- Entry-level properties (Bottom 25%) see earnings around $206, often with potential for optimization.
Average Monthly Airbnb Earnings Trend in Madurai
Madurai Airbnb Occupancy Rate Trends (2026)
Maximize your bookings by understanding the Madurai STR occupancy trends. Seasonal demand shifts significantly influence how often properties are booked. Typically, Decembersees the highest demand (peak season occupancy), while April experiences the lowest (low season). Effective strategies, like adjusting minimum stays or offering promotions, can boost occupancy during slower periods. Here's how different property tiers perform in Madurai:
- Best-in-class properties (Top 10%) achieve 79%+ occupancy, indicating high desirability and potentially optimized availability.
- Strong performing properties (Top 25%) maintain 62% or higher occupancy, suggesting good market fit and guest satisfaction.
- Typical properties (Median) have an occupancy rate around 38%.
- Entry-level properties (Bottom 25%) average 18% occupancy, potentially facing higher vacancy.
Average Monthly Occupancy Rate Trend in Madurai
Average Daily Rate (ADR) Airbnb Trends in Madurai (2026)
Effective short term rental pricing strategy in Madurai involves understanding monthly ADR fluctuations. The Average Daily Rate (ADR) for Airbnb in Madurai typically peaks in October and dips lowest during April. Leveraging Airbnb dynamic pricing tools or strategies based on this seasonality can significantly boost revenue. Here's a look at the typical nightly rates achieved:
- Best-in-class properties (Top 10%) command rates of $81+ per night, often due to premium features or locations.
- Strong performing properties (Top 25%) achieve nightly rates of $53 or more.
- Typical properties (Median) charge around $36 per night.
- Entry-level properties (Bottom 25%) earn around $23 per night.
Average Daily Rate (ADR) Trend by Month in Madurai
Get Live Madurai Market Intelligence 👇

Explore Real-time Analytics
Airbnb Seasonality Analysis & Trends in Madurai (2026)
Peak Season (December, August, July)
- Revenue averages $572 per month
- Occupancy rates average 48.8%
- Daily rates average $45
Shoulder Season
- Revenue averages $472 per month
- Occupancy maintains around 39.5%
- Daily rates hold near $46
Low Season (March, April, May)
- Revenue drops to average $371 per month
- Occupancy decreases to average 36.4%
- Daily rates adjust to average $44
Seasonality Insights for Madurai
- The Airbnb seasonality in Madurai shows moderate seasonality with distinct peak and low periods. While the sections above show seasonal averages, it's also insightful to look at the extremes:
- During the high season, the absolute peak month showcases Madurai's highest earning potential, with monthly revenues capable of climbing to $660, occupancy reaching a high of 52.3%, and ADRs peaking at $46.
- Conversely, the slowest single month of the year, typically falling within the low season, marks the market's lowest point. In this month, revenue might dip to $338, occupancy could drop to 32.9%, and ADRs may adjust down to $44.
- Understanding both the seasonal averages and these monthly peaks and troughs in revenue, occupancy, and ADR is crucial for maximizing your Airbnb profit potential in Madurai.
Seasonal Strategies for Maximizing Profit
- Peak Season: Maximize revenue through premium pricing and potentially longer minimum stays. Ensure high availability.
- Low Season: Offer competitive pricing, special promotions (e.g., extended stay discounts), and flexible cancellation policies. Target off-season travelers like remote workers or budget-conscious guests.
- Shoulder Seasons: Implement dynamic pricing that balances peak and low rates. Target weekend travelers or specific events. Offer slightly more flexible terms than peak season.
- Regularly analyze your own performance against these Madurai seasonality benchmarks and adjust your pricing and availability strategy accordingly.
Best Areas for Airbnb Investment in Madurai (2026)
Exploring the top neighborhoods for short-term rentals in Madurai? This section highlights key areas, outlining why they are attractive for hosts and guests, along with notable local attractions. Consider these locations based on your target guest profile and investment strategy.
| Neighborhood / Area | Why Host Here? (Target Guests & Appeal) | Key Attractions & Landmarks |
|---|---|---|
| Gandhi Museum Road | A cultural hotspot that attracts tourists interested in history and Gandhi's legacy. Hosts visitors to the Gandhi Memorial Museum and surrounding historical sites. | Gandhi Memorial Museum, Thirumalai Nayakkar Palace, Koodal Azhagar Temple, Alagar Kovil, Meenakshi Amman Temple |
| Meenakshi Amman Temple | One of the most important temples in India with stunning architecture and rich traditions. A major pilgrimage site that draws visitors from all over the world. | Meenakshi Amman Temple, Therkuth Thalaiyil Sivan Temple, Vandiyur Mariamman Teppakulam, Koodal Azhagar Temple |
| Mariamman Teppakulam | A picturesque tank located near famous temples that is popular among visitors for its scenic beauty and cultural significance. | Mariamman Teppakulam, Vandiyur Mariamman Temple, Azhagar Kovil, Vaigai Dam |
| Madurai City Centre | The bustling heart of Madurai featuring shops, restaurants, and street food. Perfect for travelers looking to experience local life and culture. | Meenakshi Amman Temple, Madurai Thirumalai Nayakkar Palace, Local markets, Street food stalls |
| Vandiyur | Known for its scenic water tank and temple, this area is great for families and tourists looking for quiet surroundings near the city. | Vandiyur Mariamman Teppakulam, Vandiyur Azhagar Kovil, Local parks, Cultural events |
| Palani | Famous for the Palani Murugan Temple, it's a popular pilgrimage site that attracts both devotees and tourists, offering a unique cultural experience. | Palani Murugan Temple, Palani Hill, Palani Hills Wildlife Sanctuary |
| Thirumalai Nayakkar Palace | An example of Indo-Saracenic architecture, this palace attracts history and architecture enthusiasts, providing insights into Madurai's royal history. | Thirumalai Nayakkar Palace, Historic architecture, Cultural shows |
| Azhagar Kovil | A serene temple town popular for its tranquil atmosphere and beautiful temples, appealing to spiritual seekers and those looking for peaceful retreats. | Azhagar Kovil Temple, Surrounding hills, Nature trails |
Understanding Airbnb License Requirements & STR Laws in Madurai (2026)
While Madurai, Tamil Nadu, India currently shows low STR regulations, specific Airbnb license requirements might still exist or change. Always verify the latest short term rental regulations and Airbnb license requirements directly with local government authorities for Madurai to ensure full compliance before hosting.
(Source: AirROI data, 2026, finding no licensed listings among those analyzed)
Top Performing Airbnb Properties in Madurai (2026)
Benchmark your potential! Explore examples of top-performing Airbnb properties in Maduraibased on Trailing Twelve Month (TTM) revenue. Analyze their characteristics, revenue, occupancy rate, and ADR to understand what drives success in this market.

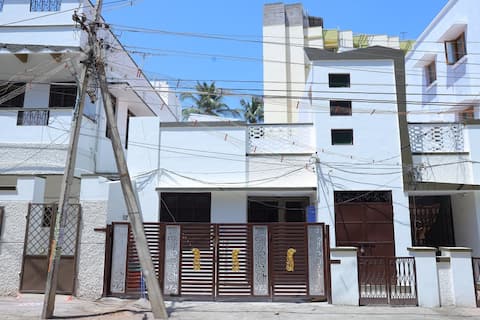
The Blessing Villa Madurai
Entire Place • 3 bedrooms

(a5) 4Br King Suite Condo Luxury (family) No Stags
Entire Place • 4 bedrooms

Cheerful 3 AC bedroom villa with free parking
Entire Place • 3 bedrooms

PlushStays Service Apartment
Entire Place • 3 bedrooms
Heritage home 3bed in a residential neighborhood.
Entire Place • 3 bedrooms
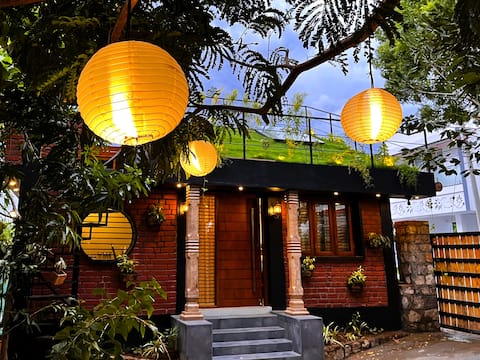
Pinewood Cottage - Stargaze Villa with roof garden
Entire Place • 1 bedroom
Note: Performance varies based on location, size, amenities, seasonality, and management quality. Data reflects the past 12 months.
Top Performing Airbnb Hosts in Madurai (2026)
Learn from the best! This table showcases top-performing Airbnb hosts in Madurai based on the number of properties managed and estimated total revenue over the past year. Analyze their scale and performance metrics.
| Host Name | Properties | Grossing Revenue | Stay Reviews | Avg Rating |
|---|---|---|---|---|
| Zaid | 4 | $37,607 | 314 | 4.90/5.0 |
| Sam | 3 | $19,598 | 430 | 4.81/5.0 |
| Shanthi | 1 | $18,333 | 196 | 4.71/5.0 |
| Vijay | 3 | $17,339 | 102 | 4.64/5.0 |
| Nirmala | 1 | $11,877 | 79 | 4.61/5.0 |
| Ayyanar | 3 | $11,554 | 169 | 4.83/5.0 |
| Surya | 2 | $11,214 | 261 | 4.84/5.0 |
| Hamsa | 1 | $11,046 | 28 | 4.89/5.0 |
| Augustus Samuel | 1 | $9,492 | 216 | 4.85/5.0 |
| Balaji | 2 | $8,758 | 6 | 4.20/5.0 |
Analyzing the strategies of top hosts, such as their property selection, pricing, and guest communication, can offer valuable lessons for optimizing your own Airbnb operations in Madurai.
Dive Deeper: Advanced Madurai STR Market Data (2026)
Ready to unlock more insights? AirROI provides access to advanced metrics and comprehensive Airbnb data for Madurai. Explore detailed analytics beyond this report to refine your investment strategy, optimize pricing, and maximize your vacation rental profits.
Explore Advanced MetricsMadurai Short-Term Rental Market Composition (2026): Property & Room Types
Room Type Distribution
Property Type Distribution
Market Composition Insights for Madurai
- The Madurai Airbnb market composition is heavily skewed towards Entire Home/Apt listings, which make up 75.5% of the 53 active rentals. This indicates strong guest preference for privacy and space.
- Looking at the property type distribution in Madurai, House properties are the most common (52.8%), reflecting the local real estate landscape.
- Houses represent a significant 52.8% portion, catering likely to families or larger groups.
- The presence of 15.1% Hotel/Boutique listings indicates integration with traditional hospitality.
Madurai Airbnb Room Capacity Analysis (2026): Bedroom Distribution
Distribution of Listings by Number of Bedrooms
Room Capacity Insights for Madurai
- The dominant room capacity in Madurai is 1 bedroom listings, making up 34% of the market. This suggests a strong demand for properties suitable for couples or solo travelers.
- Together, 1 bedroom and 2 bedrooms properties represent 64.2% of the active Airbnb listings in Madurai, indicating a high concentration in these sizes.
- A significant 24.5% of listings offer 3+ bedrooms, catering to larger groups and families seeking more space in Madurai.
Madurai Vacation Rental Guest Capacity Trends (2026)
Distribution of Listings by Guest Capacity
Guest Capacity Insights for Madurai
- The most common guest capacity trend in Madurai vacation rentals is listings accommodating 4 guests (24.5%). This suggests the primary traveler segment is likely small families or groups.
- Properties designed for 4 guests and 8+ guests dominate the Madurai STR market, accounting for 43.4% of listings.
- 43.4% of properties accommodate 6+ guests, serving the market segment for larger families or group travel in Madurai.
- On average, properties in Madurai are equipped to host 4.6 guests.
Madurai Airbnb Booking Patterns (2026): Available vs. Booked Days
Available Days Distribution
Booked Days Distribution
Booking Pattern Insights for Madurai
- The most common availability pattern in Madurai falls within the 271-366 days range, representing 50.9% of listings. This suggests many properties have significant open periods on their calendars.
- Approximately 67.9% of listings show high availability (181+ days open annually), indicating potential for increased bookings or specific owner usage patterns.
- For booked days, the 1-30 days range is most frequent in Madurai (30.2%), reflecting common guest stay durations or potential owner blocking patterns.
- A notable 32.1% of properties secure long booking periods (181+ days booked per year), highlighting successful long-term rental strategies or significant owner usage.
Madurai Airbnb Minimum Stay Requirements Analysis
Distribution of Listings by Minimum Night Requirement
1 Night
52 listings
98.1% of total
30+ Nights
1 listings
1.9% of total
Key Insights
- The most prevalent minimum stay requirement in Madurai is 1 Night, adopted by 98.1% of listings. This highlights the market's preference for shorter, flexible bookings.
- A strong majority (98.1%) of the Madurai Airbnb data shows acceptance of very short stays (1-2 nights), indicating a dynamic, high-turnover market.
- Dedicated monthly rentals (30+ nights) represent a small niche (1.9%), possibly an untapped area for hosts.
Recommendations
- Align with the market by considering a 1 Night minimum stay, as 98.1% of Madurai hosts use this setting.
- Adjust minimum nights based on seasonality – potentially shorter during low season and longer during peak demand periods in Madurai.
Madurai Airbnb Cancellation Policy Trends Analysis (2026)
Limited
1 listings
1.9% of total
Flexible
25 listings
47.2% of total
Moderate
16 listings
30.2% of total
Firm
10 listings
18.9% of total
Strict
1 listings
1.9% of total
Cancellation Policy Insights for Madurai
- The prevailing Airbnb cancellation policy trend in Madurai is Flexible, used by 47.2% of listings.
- The market strongly favors guest-friendly terms, with 77.4% of listings offering Flexible or Moderate policies. This suggests guests in Madurai may expect booking flexibility.
- Strict cancellation policies are quite rare (1.9%), potentially making listings with this policy less competitive unless justified by high demand or property type.
Recommendations for Hosts
- Consider adopting a Flexible policy to align with the 47.2% market standard in Madurai.
- Using a Strict policy might deter some guests, as only 1.9% of listings use it. Evaluate if potential revenue protection outweighs possible lower booking rates.
- Regularly review your cancellation policy against competitors and market demand shifts in Madurai.
Madurai STR Booking Lead Time Analysis (2026)
Average Booking Lead Time by Month
Booking Lead Time Insights for Madurai
- The overall average booking lead time for vacation rentals in Madurai is 22 days.
- Guests book furthest in advance for stays during November (average 36 days), likely coinciding with peak travel demand or local events.
- The shortest booking windows occur for stays in July (average 14 days), indicating more last-minute travel plans during this time.
- Seasonally, Fall (28 days avg.) sees the longest lead times, while Spring (21 days avg.) has the shortest, reflecting typical travel planning cycles.
Recommendations for Hosts
- Use the overall average lead time (22 days) as a baseline for your pricing and availability strategy in Madurai.
- For November stays, consider implementing length-of-stay discounts or slightly higher rates for bookings made less than 36 days out to capitalize on advance planning.
- During July, focus on last-minute booking availability and promotions, as guests book with very short notice (14 days avg.).
- Target marketing efforts for the Fall season well in advance (at least 28 days) to capture early planners.
- Monitor your own booking lead times against these Madurai averages to identify opportunities for dynamic pricing adjustments.
Popular & Essential Airbnb Amenities in Madurai (2026)
Amenity Prevalence
Amenity Insights for Madurai
- Essential amenities in Madurai that guests expect include: Air conditioning, Wifi. Lacking these (any) could significantly impact bookings.
- Popular amenities like TV, Free parking on premises, Hot water are common but not universal. Offering these can provide a competitive edge.
Recommendations for Hosts
- Ensure your listing includes all essential amenities for Madurai: Air conditioning, Wifi.
- Prioritize adding missing essentials: Air conditioning, Wifi.
- Consider adding popular differentiators like TV or Free parking on premises to increase appeal.
- Highlight unique or less common amenities you offer (e.g., hot tub, dedicated workspace, EV charger) in your listing description and photos.
- Regularly check competitor amenities in Madurai to stay competitive.
Madurai Airbnb Guest Demographics & Profile Analysis (2026)
Guest Profile Summary for Madurai
- The typical guest profile for Airbnb in Madurai consists of primarily domestic travelers (67%), often arriving from nearby Bengaluru, typically belonging to the Post-2000s (Gen Z/Alpha) group (50%), primarily speaking English or Hindi.
- Domestic travelers account for 67.0% of guests.
- Key international markets include India (67%) and United States (12.3%).
- Top languages spoken are English (42%) followed by Hindi (24.5%).
- A significant demographic segment is the Post-2000s (Gen Z/Alpha) group, representing 50% of guests.
Recommendations for Hosts
- Target domestic marketing efforts towards travelers from Bengaluru and Chennai.
- Tailor amenities and listing descriptions to appeal to the dominant Post-2000s (Gen Z/Alpha) demographic (e.g., highlight fast WiFi, smart home features, local guides).
- Highlight unique local experiences or amenities relevant to the primary guest profile.
- Consider seasonal promotions aligned with peak travel times for key origin markets.
Nearby Short-Term Rental Market Comparison
How does the Madurai Airbnb market stack up against its neighbors? Compare key performance metrics like average monthly revenue, ADR, and occupancy rates in surrounding areas to understand the broader regional STR landscape.
| Market | Active Properties | Monthly Revenue | Daily Rate | Avg. Occupancy |
|---|---|---|---|---|
| Pothamedu | 13 | $920 | $128.46 | 26% |
| Vilpatti | 42 | $721 | $102.89 | 28% |
| Gandhi Nagar B. L. Shed | 10 | $495 | $68.51 | 30% |
| Kodaikanal | 308 | $463 | $103.92 | 23% |
| Munnar | 40 | $451 | $78.67 | 24% |
| Anachal | 49 | $352 | $53.78 | 28% |
| Thanjavur | 13 | $347 | $54.62 | 23% |
| Bison Valley | 14 | $345 | $82.27 | 19% |
| Chithirapuram | 15 | $316 | $67.55 | 30% |
| Tirunelveli | 10 | $292 | $48.08 | 25% |