Kolapakkam Airbnb Market Analysis 2026: Short Term Rental Data & Vacation Rental Statistics in Tamil Nadu, India
Is Airbnb profitable in Kolapakkam in 2026? Explore comprehensive Airbnb analytics for Kolapakkam, Tamil Nadu, India to uncover income potential. This 2026 STR market report for Kolapakkam, based on AirROI data from February 2025 to January 2026, reveals key trends in the niche market of 20 active listings.
Whether you're considering an Airbnb investment in Kolapakkam, optimizing your existing vacation rental, or exploring rental arbitrage opportunities, understanding the Kolapakkam Airbnb data is crucial. Leveraging the low regulation environment is key to maximizing your short term rental income potential. Let's dive into the specifics.
Key Kolapakkam Airbnb Performance Metrics Overview
Monthly Airbnb Revenue Variations & Income Potential in Kolapakkam (2026)
Understanding the monthly revenue variations for Airbnb listings in Kolapakkam is key to maximizing your short term rental income potential. Seasonality significantly impacts earnings. Our analysis, based on data from the past 12 months, shows that the peak revenue month for STRs in Kolapakkam is typically March, while December often presents the lowest earnings, highlighting opportunities for strategic pricing adjustments during shoulder and low seasons. Explore the typical Airbnb income in Kolapakkam across different performance tiers:
- Best-in-class properties (Top 10%) achieve $316+ monthly, often utilizing dynamic pricing and superior guest experiences.
- Strong performing properties (Top 25%) earn $163 or more, indicating effective management and desirable locations/amenities.
- Typical properties (Median) generate around $87 per month, representing the average market performance.
- Entry-level properties (Bottom 25%) see earnings around $45, often with potential for optimization.
Average Monthly Airbnb Earnings Trend in Kolapakkam
Kolapakkam Airbnb Occupancy Rate Trends (2026)
Maximize your bookings by understanding the Kolapakkam STR occupancy trends. Seasonal demand shifts significantly influence how often properties are booked. Typically, Marchsees the highest demand (peak season occupancy), while December experiences the lowest (low season). Effective strategies, like adjusting minimum stays or offering promotions, can boost occupancy during slower periods. Here's how different property tiers perform in Kolapakkam:
- Best-in-class properties (Top 10%) achieve 34%+ occupancy, indicating high desirability and potentially optimized availability.
- Strong performing properties (Top 25%) maintain 24% or higher occupancy, suggesting good market fit and guest satisfaction.
- Typical properties (Median) have an occupancy rate around 13%.
- Entry-level properties (Bottom 25%) average 5% occupancy, potentially facing higher vacancy.
Average Monthly Occupancy Rate Trend in Kolapakkam
Average Daily Rate (ADR) Airbnb Trends in Kolapakkam (2026)
Effective short term rental pricing strategy in Kolapakkam involves understanding monthly ADR fluctuations. The Average Daily Rate (ADR) for Airbnb in Kolapakkam typically peaks in August and dips lowest during March. Leveraging Airbnb dynamic pricing tools or strategies based on this seasonality can significantly boost revenue. Here's a look at the typical nightly rates achieved:
- Best-in-class properties (Top 10%) command rates of $32+ per night, often due to premium features or locations.
- Strong performing properties (Top 25%) achieve nightly rates of $29 or more.
- Typical properties (Median) charge around $23 per night.
- Entry-level properties (Bottom 25%) earn around $19 per night.
Average Daily Rate (ADR) Trend by Month in Kolapakkam
Get Live Kolapakkam Market Intelligence 👇

Explore Real-time Analytics
Airbnb Seasonality Analysis & Trends in Kolapakkam (2026)
Peak Season (March, February, April)
- Revenue averages $190 per month
- Occupancy rates average 24.3%
- Daily rates average $25
Shoulder Season
- Revenue averages $137 per month
- Occupancy maintains around 16.8%
- Daily rates hold near $26
Low Season (May, August, December)
- Revenue drops to average $84 per month
- Occupancy decreases to average 11.6%
- Daily rates adjust to average $26
Seasonality Insights for Kolapakkam
- The Airbnb seasonality in Kolapakkam shows highly seasonal trends requiring careful strategy. While the sections above show seasonal averages, it's also insightful to look at the extremes:
- During the high season, the absolute peak month showcases Kolapakkam's highest earning potential, with monthly revenues capable of climbing to $229, occupancy reaching a high of 31.3%, and ADRs peaking at $28.
- Conversely, the slowest single month of the year, typically falling within the low season, marks the market's lowest point. In this month, revenue might dip to $72, occupancy could drop to 10.2%, and ADRs may adjust down to $24.
- Understanding both the seasonal averages and these monthly peaks and troughs in revenue, occupancy, and ADR is crucial for maximizing your Airbnb profit potential in Kolapakkam.
Seasonal Strategies for Maximizing Profit
- Peak Season: Maximize revenue through premium pricing and potentially longer minimum stays. Ensure high availability.
- Low Season: Offer competitive pricing, special promotions (e.g., extended stay discounts), and flexible cancellation policies. Target off-season travelers like remote workers or budget-conscious guests.
- Shoulder Seasons: Implement dynamic pricing that balances peak and low rates. Target weekend travelers or specific events. Offer slightly more flexible terms than peak season.
- Regularly analyze your own performance against these Kolapakkam seasonality benchmarks and adjust your pricing and availability strategy accordingly.
Best Areas for Airbnb Investment in Kolapakkam (2026)
Exploring the top neighborhoods for short-term rentals in Kolapakkam? This section highlights key areas, outlining why they are attractive for hosts and guests, along with notable local attractions. Consider these locations based on your target guest profile and investment strategy.
| Neighborhood / Area | Why Host Here? (Target Guests & Appeal) | Key Attractions & Landmarks |
|---|---|---|
| Kolapakkam Main Road | Busy main road with easy access to major transportation routes. Ideal for guests looking for convenience and connectivity to nearby attractions and employment zones. | Local restaurants, Shopping areas, Public transport access, Proximity to schools and colleges, Parks nearby |
| Madhya Kailash Temple Area | A religious and cultural hub, attracting visitors for the serene temple environment and local festivals. Great for guests looking for spiritual experiences and local culture. | Madhya Kailash Temple, Cultural sites, Local markets, Festivals, Temples and ashrams |
| Sholinganallur | Close to IT parks and tech companies, making it a prime location for business travelers and tech employees. Provides easy access to urban conveniences. | IT parks, Shops and restaurants, Public parks, Nearby beaches, Entertainment options |
| Chennai Bypass Road | Strategically located for guests traveling to Chennai or nearby suburbs. Appeals to those needing quick access to main roads and highways. | Commercial centers, Local eateries, Motorway access, Public transport connections, Fuel stations |
| Meenakshi Amman Nagar | Residential area close to local amenities and community services; perfect for families and longer stays. Offers a homely atmosphere. | Local schools, Parks, Community centers, Shopping facilities, Quiet neighborhoods |
| Perungalathur | Residential suburb with a growing infrastructure; attractive to families and travelers seeking longer-term accommodations in a peaceful setting. | Local markets, Schools, Parks, Public transport options, Residential amenities |
| Kotturpuram | An upscale neighborhood known for its spacious surroundings and proximity to nature. Draws in guests looking for luxury and tranquility. | Parks and gardens, Cultural spots, Fine dining, Residences of affluent locals, Excellent connectivity |
| Thoraipakkam | A busy locality with commercial establishments and access to OMR. Popular for its mix of city life and suburban charm, attracting diverse guests. | Shopping malls, Restaurants and cafes, Entertainment options, Public transport links, Green spaces |
Understanding Airbnb License Requirements & STR Laws in Kolapakkam (2026)
While Kolapakkam, Tamil Nadu, India currently shows low STR regulations, specific Airbnb license requirements might still exist or change. Always verify the latest short term rental regulations and Airbnb license requirements directly with local government authorities for Kolapakkam to ensure full compliance before hosting.
(Source: AirROI data, 2026, finding no licensed listings among those analyzed)
Top Performing Airbnb Properties in Kolapakkam (2026)
Benchmark your potential! Explore examples of top-performing Airbnb properties in Kolapakkambased on Trailing Twelve Month (TTM) revenue. Analyze their characteristics, revenue, occupancy rate, and ADR to understand what drives success in this market.
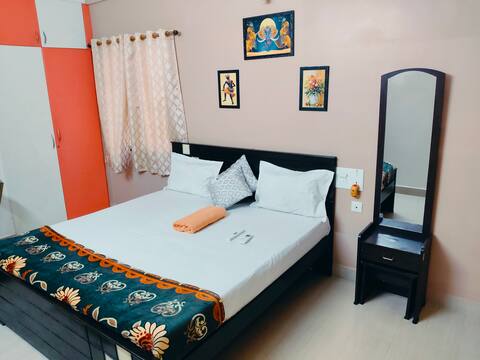
3 Bedroom house for Family stay with all facility
Entire Place • 3 bedrooms
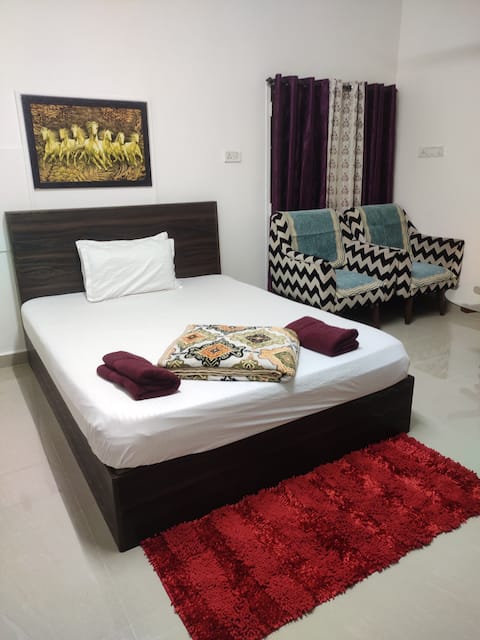
Friendlystay Elite - Studio Room with Kitchen
Entire Place • 1 bedroom
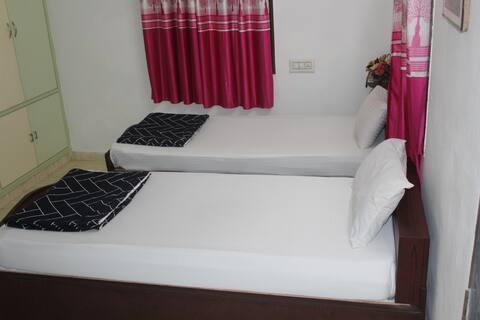
Private Room/Near DLF Porur
Private Room • N/A
Budget Room/ Near Porur
Private Room • 1 bedroom
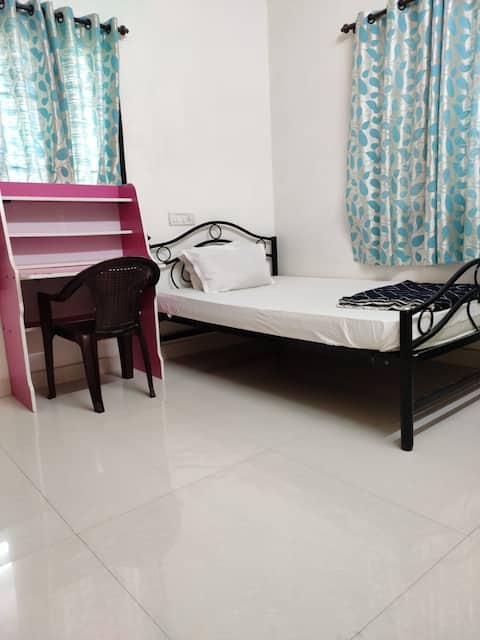
Friendlystay Elite - Private Room
Private Room • N/A

Studio Room with Kitchen / Near Porur
Private Room • N/A
Note: Performance varies based on location, size, amenities, seasonality, and management quality. Data reflects the past 12 months.
Top Performing Airbnb Hosts in Kolapakkam (2026)
Learn from the best! This table showcases top-performing Airbnb hosts in Kolapakkam based on the number of properties managed and estimated total revenue over the past year. Analyze their scale and performance metrics.
| Host Name | Properties | Grossing Revenue | Stay Reviews | Avg Rating |
|---|---|---|---|---|
| Friendlystay | 13 | $10,167 | 257 | 4.74/5.0 |
| Appaji | 3 | $6,635 | 75 | 4.80/5.0 |
| Gurunathan | 3 | $1,579 | 25 | 4.58/5.0 |
| Rowther | 1 | $276 | 5 | 4.40/5.0 |
Analyzing the strategies of top hosts, such as their property selection, pricing, and guest communication, can offer valuable lessons for optimizing your own Airbnb operations in Kolapakkam.
Dive Deeper: Advanced Kolapakkam STR Market Data (2026)
Ready to unlock more insights? AirROI provides access to advanced metrics and comprehensive Airbnb data for Kolapakkam. Explore detailed analytics beyond this report to refine your investment strategy, optimize pricing, and maximize your vacation rental profits.
Explore Advanced MetricsKolapakkam Short-Term Rental Market Composition (2026): Property & Room Types
Room Type Distribution
Property Type Distribution
Market Composition Insights for Kolapakkam
- The Kolapakkam Airbnb market composition is heavily skewed towards Private Room listings, which make up 75% of the 20 active rentals. This indicates strong guest preference for privacy and space.
- Looking at the property type distribution in Kolapakkam, House properties are the most common (65%), reflecting the local real estate landscape.
- Houses represent a significant 65% portion, catering likely to families or larger groups.
Kolapakkam Airbnb Room Capacity Analysis (2026): Bedroom Distribution
Distribution of Listings by Number of Bedrooms
Room Capacity Insights for Kolapakkam
- The dominant room capacity in Kolapakkam is 2 bedrooms listings, making up 20% of the market. This suggests a strong demand for properties suitable for couples or solo travelers.
- Together, 2 bedrooms and 1 bedroom properties represent 30.0% of the active Airbnb listings in Kolapakkam, indicating a high concentration in these sizes.
Kolapakkam Vacation Rental Guest Capacity Trends (2026)
Distribution of Listings by Guest Capacity
Guest Capacity Insights for Kolapakkam
- The most common guest capacity trend in Kolapakkam vacation rentals is listings accommodating 6 guests (15%). This suggests the primary traveler segment is likely larger groups.
- Properties designed for 6 guests and 5 guests dominate the Kolapakkam STR market, accounting for 20.0% of listings.
- 20.0% of properties accommodate 6+ guests, serving the market segment for larger families or group travel in Kolapakkam.
- On average, properties in Kolapakkam are equipped to host 1.7 guests.
Kolapakkam Airbnb Booking Patterns (2026): Available vs. Booked Days
Available Days Distribution
Booked Days Distribution
Booking Pattern Insights for Kolapakkam
- The most common availability pattern in Kolapakkam falls within the 271-366 days range, representing 90% of listings. This suggests many properties have significant open periods on their calendars.
- Approximately 100.0% of listings show high availability (181+ days open annually), indicating potential for increased bookings or specific owner usage patterns.
- For booked days, the 1-30 days range is most frequent in Kolapakkam (60%), reflecting common guest stay durations or potential owner blocking patterns.
Kolapakkam Airbnb Minimum Stay Requirements Analysis
Distribution of Listings by Minimum Night Requirement
1 Night
20 listings
100% of total
Key Insights
- The most prevalent minimum stay requirement in Kolapakkam is 1 Night, adopted by 100% of listings. This highlights the market's preference for shorter, flexible bookings.
- A strong majority (100.0%) of the Kolapakkam Airbnb data shows acceptance of very short stays (1-2 nights), indicating a dynamic, high-turnover market.
Recommendations
- Align with the market by considering a 1 Night minimum stay, as 100% of Kolapakkam hosts use this setting.
- Adjust minimum nights based on seasonality – potentially shorter during low season and longer during peak demand periods in Kolapakkam.
Kolapakkam Airbnb Cancellation Policy Trends Analysis (2026)
Flexible
20 listings
100% of total
Cancellation Policy Insights for Kolapakkam
- The prevailing Airbnb cancellation policy trend in Kolapakkam is Flexible, used by 100% of listings.
- The market strongly favors guest-friendly terms, with 100.0% of listings offering Flexible or Moderate policies. This suggests guests in Kolapakkam may expect booking flexibility.
Recommendations for Hosts
- Consider adopting a Flexible policy to align with the 100% market standard in Kolapakkam.
- Given the high prevalence of Flexible policies (100%), offering this can enhance booking appeal, especially during shoulder seasons.
- Regularly review your cancellation policy against competitors and market demand shifts in Kolapakkam.
Kolapakkam STR Booking Lead Time Analysis (2026)
Average Booking Lead Time by Month
Booking Lead Time Insights for Kolapakkam
- The overall average booking lead time for vacation rentals in Kolapakkam is 25 days.
- Guests book furthest in advance for stays during May (average 33 days), likely coinciding with peak travel demand or local events.
- The shortest booking windows occur for stays in October (average 11 days), indicating more last-minute travel plans during this time.
- Seasonally, Spring (24 days avg.) sees the longest lead times, while Winter (19 days avg.) has the shortest, reflecting typical travel planning cycles.
Recommendations for Hosts
- Use the overall average lead time (25 days) as a baseline for your pricing and availability strategy in Kolapakkam.
- During October, focus on last-minute booking availability and promotions, as guests book with very short notice (11 days avg.).
- Target marketing efforts for the Spring season well in advance (at least 24 days) to capture early planners.
- Monitor your own booking lead times against these Kolapakkam averages to identify opportunities for dynamic pricing adjustments.
Popular & Essential Airbnb Amenities in Kolapakkam (2026)
Amenity Prevalence
Amenity Insights for Kolapakkam
- Essential amenities in Kolapakkam that guests expect include: Air conditioning, Hot water, Essentials, Clothing storage, Ceiling fan, Free street parking, Wifi, Washer, TV. Lacking these (any) could significantly impact bookings.
- Popular amenities like Hangers are common but not universal. Offering these can provide a competitive edge.
Recommendations for Hosts
- Ensure your listing includes all essential amenities for Kolapakkam: Air conditioning, Hot water, Essentials, Clothing storage, Ceiling fan, Free street parking, Wifi, Washer, TV.
- Prioritize adding missing essentials: Hot water, Essentials, Clothing storage, Ceiling fan, Free street parking, Wifi, Washer, TV.
- Consider adding popular differentiators like Hangers to increase appeal.
- Highlight unique or less common amenities you offer (e.g., hot tub, dedicated workspace, EV charger) in your listing description and photos.
- Regularly check competitor amenities in Kolapakkam to stay competitive.
Kolapakkam Airbnb Guest Demographics & Profile Analysis (2026)
Guest Profile Summary for Kolapakkam
- The typical guest profile for Airbnb in Kolapakkam consists of a mix of domestic (60%) and international guests, often arriving from nearby Guduvancheri, typically belonging to the 1990s (Older Gen Z) group (50%), primarily speaking English or Telugu.
- Domestic travelers account for 60.0% of guests.
- Key international markets include India (60%) and Netherlands (20%).
- Top languages spoken are English (41.7%) followed by Telugu (16.7%).
- A significant demographic segment is the Post-2000s (Gen Z/Alpha) group, representing 50% of guests.
Recommendations for Hosts
- Balance marketing efforts between domestic and international channels based on the guest mix.
- Tailor amenities and listing descriptions to appeal to the dominant 1990s (Older Gen Z) demographic (e.g., highlight fast WiFi, smart home features, local guides).
- Highlight unique local experiences or amenities relevant to the primary guest profile.
- Consider seasonal promotions aligned with peak travel times for key origin markets.
Nearby Short-Term Rental Market Comparison
How does the Kolapakkam Airbnb market stack up against its neighbors? Compare key performance metrics like average monthly revenue, ADR, and occupancy rates in surrounding areas to understand the broader regional STR landscape.
| Market | Active Properties | Monthly Revenue | Daily Rate | Avg. Occupancy |
|---|---|---|---|---|
| Tiruporur | 139 | $735 | $129.32 | 24% |
| Ayanambakkam | 20 | $497 | $43.42 | 42% |
| Kalapet | 15 | $478 | $87.44 | 18% |
| Mahabalipuram | 24 | $397 | $90.58 | 22% |
| Chennai | 941 | $361 | $52.72 | 33% |
| Vellore | 37 | $246 | $26.22 | 38% |
| Thoraipakkam | 11 | $243 | $34.53 | 32% |
| Auroville | 32 | $232 | $38.08 | 30% |
| Tambaram | 22 | $191 | $24.06 | 35% |
| Mugalivakkam | 14 | $177 | $28.64 | 25% |