Hosur Airbnb Market Analysis 2026: Short Term Rental Data & Vacation Rental Statistics in Tamil Nadu, India
Is Airbnb profitable in Hosur in 2026? Explore comprehensive Airbnb analytics for Hosur, Tamil Nadu, India to uncover income potential. This 2026 STR market report for Hosur, based on AirROI data from February 2025 to January 2026, reveals key trends in the niche market of 26 active listings.
Whether you're considering an Airbnb investment in Hosur, optimizing your existing vacation rental, or exploring rental arbitrage opportunities, understanding the Hosur Airbnb data is crucial. Leveraging the low regulation environment is key to maximizing your short term rental income potential. Let's dive into the specifics.
Key Hosur Airbnb Performance Metrics Overview
Monthly Airbnb Revenue Variations & Income Potential in Hosur (2026)
Understanding the monthly revenue variations for Airbnb listings in Hosur is key to maximizing your short term rental income potential. Seasonality significantly impacts earnings. Our analysis, based on data from the past 12 months, shows that the peak revenue month for STRs in Hosur is typically December, while September often presents the lowest earnings, highlighting opportunities for strategic pricing adjustments during shoulder and low seasons. Explore the typical Airbnb income in Hosur across different performance tiers:
- Best-in-class properties (Top 10%) achieve $1,521+ monthly, often utilizing dynamic pricing and superior guest experiences.
- Strong performing properties (Top 25%) earn $782 or more, indicating effective management and desirable locations/amenities.
- Typical properties (Median) generate around $400 per month, representing the average market performance.
- Entry-level properties (Bottom 25%) see earnings around $192, often with potential for optimization.
Average Monthly Airbnb Earnings Trend in Hosur
Hosur Airbnb Occupancy Rate Trends (2026)
Maximize your bookings by understanding the Hosur STR occupancy trends. Seasonal demand shifts significantly influence how often properties are booked. Typically, Decembersees the highest demand (peak season occupancy), while June experiences the lowest (low season). Effective strategies, like adjusting minimum stays or offering promotions, can boost occupancy during slower periods. Here's how different property tiers perform in Hosur:
- Best-in-class properties (Top 10%) achieve 46%+ occupancy, indicating high desirability and potentially optimized availability.
- Strong performing properties (Top 25%) maintain 25% or higher occupancy, suggesting good market fit and guest satisfaction.
- Typical properties (Median) have an occupancy rate around 15%.
- Entry-level properties (Bottom 25%) average 9% occupancy, potentially facing higher vacancy.
Average Monthly Occupancy Rate Trend in Hosur
Average Daily Rate (ADR) Airbnb Trends in Hosur (2026)
Effective short term rental pricing strategy in Hosur involves understanding monthly ADR fluctuations. The Average Daily Rate (ADR) for Airbnb in Hosur typically peaks in February and dips lowest during September. Leveraging Airbnb dynamic pricing tools or strategies based on this seasonality can significantly boost revenue. Here's a look at the typical nightly rates achieved:
- Best-in-class properties (Top 10%) command rates of $196+ per night, often due to premium features or locations.
- Strong performing properties (Top 25%) achieve nightly rates of $142 or more.
- Typical properties (Median) charge around $79 per night.
- Entry-level properties (Bottom 25%) earn around $60 per night.
Average Daily Rate (ADR) Trend by Month in Hosur
Get Live Hosur Market Intelligence 👇

Explore Real-time Analytics
Airbnb Seasonality Analysis & Trends in Hosur (2026)
Peak Season (December, June, January)
- Revenue averages $875 per month
- Occupancy rates average 22.5%
- Daily rates average $108
Shoulder Season
- Revenue averages $598 per month
- Occupancy maintains around 23.0%
- Daily rates hold near $107
Low Season (February, September, October)
- Revenue drops to average $390 per month
- Occupancy decreases to average 14.3%
- Daily rates adjust to average $106
Seasonality Insights for Hosur
- The Airbnb seasonality in Hosur shows highly seasonal trends requiring careful strategy. While the sections above show seasonal averages, it's also insightful to look at the extremes:
- During the high season, the absolute peak month showcases Hosur's highest earning potential, with monthly revenues capable of climbing to $1,039, occupancy reaching a high of 32.4%, and ADRs peaking at $111.
- Conversely, the slowest single month of the year, typically falling within the low season, marks the market's lowest point. In this month, revenue might dip to $331, occupancy could drop to 8.8%, and ADRs may adjust down to $102.
- Understanding both the seasonal averages and these monthly peaks and troughs in revenue, occupancy, and ADR is crucial for maximizing your Airbnb profit potential in Hosur.
Seasonal Strategies for Maximizing Profit
- Peak Season: Maximize revenue through premium pricing and potentially longer minimum stays. Ensure high availability.
- Low Season: Offer competitive pricing, special promotions (e.g., extended stay discounts), and flexible cancellation policies. Target off-season travelers like remote workers or budget-conscious guests.
- Shoulder Seasons: Implement dynamic pricing that balances peak and low rates. Target weekend travelers or specific events. Offer slightly more flexible terms than peak season.
- Regularly analyze your own performance against these Hosur seasonality benchmarks and adjust your pricing and availability strategy accordingly.
Best Areas for Airbnb Investment in Hosur (2026)
Exploring the top neighborhoods for short-term rentals in Hosur? This section highlights key areas, outlining why they are attractive for hosts and guests, along with notable local attractions. Consider these locations based on your target guest profile and investment strategy.
| Neighborhood / Area | Why Host Here? (Target Guests & Appeal) | Key Attractions & Landmarks |
|---|---|---|
| Hosur Main Town | The bustling heart of Hosur, known for its accessibility and central location. Ideal for travelers looking for convenience with a range of eateries and shops nearby. | Hosur Bus Stand, Shree Parshwa Padmavathi Jain Temple, Hosur Lake, Shree Jain Mandir, Murugan Temple |
| Sipcot | A major industrial area that attracts business travelers looking for proximity to tech and manufacturing companies. Great for those visiting the multiple IT parks and factories in the region. | Sipcot IT Park, Hyundai Motor Company, Ashok Leyland, Karnataka Bank, Hosur Industrial Association |
| Kothagiri Road | A growing locale with a mix of residential and commercial properties, popular among families and travelers wanting a quieter stay yet close to tourist attractions. | Kothagiri Nagaraja Temple, Local Markets, Green Fields, Hill View Park, Cafes and Eateries |
| Anekal | Immediate vicinity to Hosur, offering a more suburban feel with easy access to Hosur's attractions. Attracts families and nature lovers looking for a peaceful retreat. | Anekal Fort, Nandi Hills, Vallakottai Murugan Temple, Local Farms, Nature Trails |
| Kaveripattinam | A nearby town with historical significance and cultural heritage, ideal for travelers interested in history and local traditions. | Brahmadesam Temple, Agricultural Fields, Local Craft Markets, Gods Own Village, Historic Homes |
| Krishnagiri | Located slightly further, yet attracting tourists and business travelers alike. Offers scenic landscapes and quieter environments. | Krishnagiri Fort, Ramadevara Betta Hill, Krishnagiri Lake, Local Temples, Nature Walks |
| Bangalore Highway | The route connecting Hosur to Bangalore is bustling with traffic and quick access, making it an ideal spot for quick business trips and stopovers. | Restaurants and Dhabas along the highway, Lodging Facilities, Parks and Recreational Areas, Service Stations, Quick Access to Bangalore |
| Thally Road | Known for its green landscapes and proximity to various farms and outdoor activities. Great for nature-centric tourism and stays. | Thally Lake, Local Farms, Nature Walks, Campsites, Scenic Drives |
Understanding Airbnb License Requirements & STR Laws in Hosur (2026)
While Hosur, Tamil Nadu, India currently shows low STR regulations, specific Airbnb license requirements might still exist or change. Always verify the latest short term rental regulations and Airbnb license requirements directly with local government authorities for Hosur to ensure full compliance before hosting.
(Source: AirROI data, 2026, finding no licensed listings among those analyzed)
Top Performing Airbnb Properties in Hosur (2026)
Benchmark your potential! Explore examples of top-performing Airbnb properties in Hosurbased on Trailing Twelve Month (TTM) revenue. Analyze their characteristics, revenue, occupancy rate, and ADR to understand what drives success in this market.

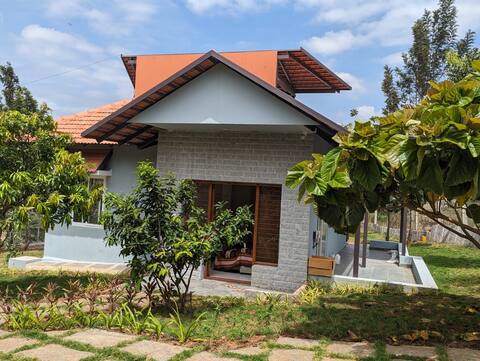
Little England Villas Farmville
Entire Place • 3 bedrooms

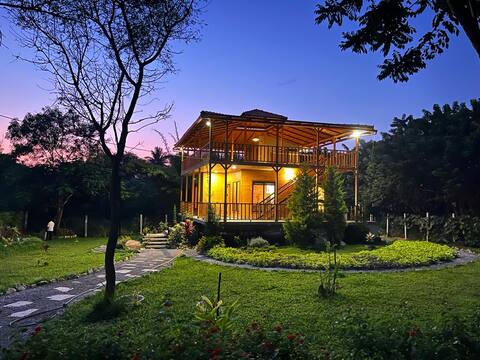
FarmVille 10 - Villa with a Private Pool!
Entire Place • 2 bedrooms
The Hidden Nook- A cosy farmstay near Bangalore
Entire Place • 2 bedrooms

Dream Scape Farmville- A/C Villa with Private POOL
Entire Place • 2 bedrooms
Luxury Cottage, Peaceful Getaway - Bangalore/Hosur
Entire Place • 1 bedroom

Zen Oasis – Your peaceful farm stay retreat
Entire Place • 2 bedrooms
Note: Performance varies based on location, size, amenities, seasonality, and management quality. Data reflects the past 12 months.
Top Performing Airbnb Hosts in Hosur (2026)
Learn from the best! This table showcases top-performing Airbnb hosts in Hosur based on the number of properties managed and estimated total revenue over the past year. Analyze their scale and performance metrics.
| Host Name | Properties | Grossing Revenue | Stay Reviews | Avg Rating |
|---|---|---|---|---|
| Ashish | 1 | $16,292 | 92 | 4.76/5.0 |
| Nandita | 4 | $15,248 | 34 | 4.63/5.0 |
| Mayank | 1 | $12,296 | 130 | 4.78/5.0 |
| Pritish | 1 | $9,768 | 34 | 4.94/5.0 |
| StayJade | 2 | $9,462 | 37 | 4.50/5.0 |
| Sanjay | 1 | $8,620 | 108 | 4.76/5.0 |
| Anirudh | 1 | $8,120 | 72 | 4.82/5.0 |
| Dipam | 1 | $7,560 | 59 | 4.97/5.0 |
| Magdalene | 1 | $4,912 | 38 | 4.87/5.0 |
| Shradha | 3 | $4,821 | 67 | 4.43/5.0 |
Analyzing the strategies of top hosts, such as their property selection, pricing, and guest communication, can offer valuable lessons for optimizing your own Airbnb operations in Hosur.
Dive Deeper: Advanced Hosur STR Market Data (2026)
Ready to unlock more insights? AirROI provides access to advanced metrics and comprehensive Airbnb data for Hosur. Explore detailed analytics beyond this report to refine your investment strategy, optimize pricing, and maximize your vacation rental profits.
Explore Advanced MetricsHosur Short-Term Rental Market Composition (2026): Property & Room Types
Room Type Distribution
Property Type Distribution
Market Composition Insights for Hosur
- The Hosur Airbnb market composition is heavily skewed towards Entire Home/Apt listings, which make up 65.4% of the 26 active rentals. This indicates strong guest preference for privacy and space.
- However, a notable 34.6% share for Private Rooms suggests opportunities for budget-conscious travelers or hosts renting out spare rooms.
- Looking at the property type distribution in Hosur, House properties are the most common (53.8%), reflecting the local real estate landscape.
- Houses represent a significant 53.8% portion, catering likely to families or larger groups.
- The presence of 23.1% Hotel/Boutique listings indicates integration with traditional hospitality.
- Smaller segments like unique stays (combined 3.8%) offer potential for unique stay experiences.
Hosur Airbnb Room Capacity Analysis (2026): Bedroom Distribution
Distribution of Listings by Number of Bedrooms
Room Capacity Insights for Hosur
- The dominant room capacity in Hosur is 2 bedrooms listings, making up 46.2% of the market. This suggests a strong demand for properties suitable for couples or solo travelers.
- Together, 2 bedrooms and 1 bedroom properties represent 53.9% of the active Airbnb listings in Hosur, indicating a high concentration in these sizes.
Hosur Vacation Rental Guest Capacity Trends (2026)
Distribution of Listings by Guest Capacity
Guest Capacity Insights for Hosur
- The most common guest capacity trend in Hosur vacation rentals is listings accommodating 6 guests (23.1%). This suggests the primary traveler segment is likely larger groups.
- Properties designed for 6 guests and 8+ guests dominate the Hosur STR market, accounting for 42.3% of listings.
- 53.8% of properties accommodate 6+ guests, serving the market segment for larger families or group travel in Hosur.
- On average, properties in Hosur are equipped to host 4.4 guests.
Hosur Airbnb Booking Patterns (2026): Available vs. Booked Days
Available Days Distribution
Booked Days Distribution
Booking Pattern Insights for Hosur
- The most common availability pattern in Hosur falls within the 271-366 days range, representing 76.9% of listings. This suggests many properties have significant open periods on their calendars.
- Approximately 100.0% of listings show high availability (181+ days open annually), indicating potential for increased bookings or specific owner usage patterns.
- For booked days, the 1-30 days range is most frequent in Hosur (46.2%), reflecting common guest stay durations or potential owner blocking patterns.
Hosur Airbnb Minimum Stay Requirements Analysis
Distribution of Listings by Minimum Night Requirement
1 Night
26 listings
100% of total
Key Insights
- The most prevalent minimum stay requirement in Hosur is 1 Night, adopted by 100% of listings. This highlights the market's preference for shorter, flexible bookings.
- A strong majority (100.0%) of the Hosur Airbnb data shows acceptance of very short stays (1-2 nights), indicating a dynamic, high-turnover market.
Recommendations
- Align with the market by considering a 1 Night minimum stay, as 100% of Hosur hosts use this setting.
- Adjust minimum nights based on seasonality – potentially shorter during low season and longer during peak demand periods in Hosur.
Hosur Airbnb Cancellation Policy Trends Analysis (2026)
Flexible
6 listings
23.1% of total
Moderate
14 listings
53.8% of total
Firm
5 listings
19.2% of total
Strict
1 listings
3.8% of total
Cancellation Policy Insights for Hosur
- The prevailing Airbnb cancellation policy trend in Hosur is Moderate, used by 53.8% of listings.
- The market strongly favors guest-friendly terms, with 76.9% of listings offering Flexible or Moderate policies. This suggests guests in Hosur may expect booking flexibility.
- Strict cancellation policies are quite rare (3.8%), potentially making listings with this policy less competitive unless justified by high demand or property type.
Recommendations for Hosts
- Consider adopting a Moderate policy to align with the 53.8% market standard in Hosur.
- Using a Strict policy might deter some guests, as only 3.8% of listings use it. Evaluate if potential revenue protection outweighs possible lower booking rates.
- Regularly review your cancellation policy against competitors and market demand shifts in Hosur.
Hosur STR Booking Lead Time Analysis (2026)
Average Booking Lead Time by Month
Booking Lead Time Insights for Hosur
- The overall average booking lead time for vacation rentals in Hosur is 18 days.
- Guests book furthest in advance for stays during August (average 31 days), likely coinciding with peak travel demand or local events.
- The shortest booking windows occur for stays in March (average 7 days), indicating more last-minute travel plans during this time.
- Seasonally, Summer (23 days avg.) sees the longest lead times, while Spring (12 days avg.) has the shortest, reflecting typical travel planning cycles.
Recommendations for Hosts
- Use the overall average lead time (18 days) as a baseline for your pricing and availability strategy in Hosur.
- For August stays, consider implementing length-of-stay discounts or slightly higher rates for bookings made less than 31 days out to capitalize on advance planning.
- During March, focus on last-minute booking availability and promotions, as guests book with very short notice (7 days avg.).
- Target marketing efforts for the Summer season well in advance (at least 23 days) to capture early planners.
- Monitor your own booking lead times against these Hosur averages to identify opportunities for dynamic pricing adjustments.
Popular & Essential Airbnb Amenities in Hosur (2026)
Amenity Prevalence
Amenity Insights for Hosur
- Essential amenities in Hosur that guests expect include: Free parking on premises. Lacking these (this) could significantly impact bookings.
- Popular amenities like Hot water, Wifi, Extra pillows and blankets are common but not universal. Offering these can provide a competitive edge.
- A pool is a highly desired but not standard amenity, making it a key feature for attracting guests seeking leisure in Hosur.
- Warning: Wifi is not universally provided but is considered essential globally. Ensure reliable Wifi is offered.
Recommendations for Hosts
- Ensure your listing includes all essential amenities for Hosur: Free parking on premises.
- Consider adding popular differentiators like Hot water or Wifi to increase appeal.
- Highlight unique or less common amenities you offer (e.g., hot tub, dedicated workspace, EV charger) in your listing description and photos.
- Regularly check competitor amenities in Hosur to stay competitive.
Hosur Airbnb Guest Demographics & Profile Analysis (2026)
Guest Profile Summary for Hosur
- The typical guest profile for Airbnb in Hosur consists of primarily domestic travelers (94%), often arriving from nearby Bengaluru, typically belonging to the Post-2000s (Gen Z/Alpha) group (50%), primarily speaking English or Hindi.
- Domestic travelers account for 93.8% of guests.
- Key international markets include India (93.8%) and United States (1.6%).
- Top languages spoken are English (45.6%) followed by Hindi (36.8%).
- A significant demographic segment is the Post-2000s (Gen Z/Alpha) group, representing 50% of guests.
Recommendations for Hosts
- Target domestic marketing efforts towards travelers from Bengaluru and Mumbai.
- Tailor amenities and listing descriptions to appeal to the dominant Post-2000s (Gen Z/Alpha) demographic (e.g., highlight fast WiFi, smart home features, local guides).
- Highlight unique local experiences or amenities relevant to the primary guest profile.
- Consider seasonal promotions aligned with peak travel times for key origin markets.
Nearby Short-Term Rental Market Comparison
How does the Hosur Airbnb market stack up against its neighbors? Compare key performance metrics like average monthly revenue, ADR, and occupancy rates in surrounding areas to understand the broader regional STR landscape.
| Market | Active Properties | Monthly Revenue | Daily Rate | Avg. Occupancy |
|---|---|---|---|---|
| Kadirenahalli | 12 | $1,153 | $108.45 | 36% |
| Chikkabidarakallu | 10 | $794 | $491.62 | 28% |
| Achanakal hatty | 15 | $667 | $77.56 | 29% |
| Lovedale | 17 | $634 | $150.15 | 22% |
| Udhagamandalam | 203 | $621 | $100.87 | 23% |
| Coonoor | 61 | $515 | $103.42 | 24% |
| Yercaud | 79 | $472 | $110.48 | 20% |
| Vythiri | 223 | $416 | $84.04 | 20% |
| Kotagiri | 53 | $396 | $109.53 | 17% |
| Ooty | 35 | $380 | $98.29 | 20% |