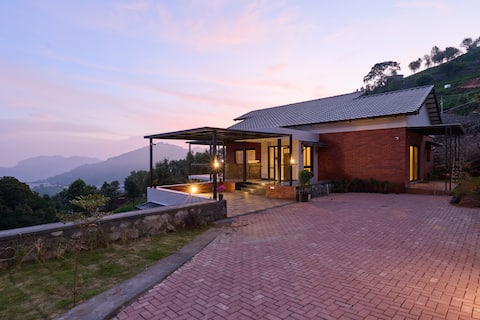
Coonoor Airbnb Market Analysis 2026: Short Term Rental Data & Vacation Rental Statistics in Tamil Nadu, India
Is Airbnb profitable in Coonoor in 2026? Explore comprehensive Airbnb analytics for Coonoor, Tamil Nadu, India to uncover income potential. This 2026 STR market report for Coonoor, based on AirROI data from February 2025 to January 2026, reveals key trends in the niche market of 61 active listings.
Whether you're considering an Airbnb investment in Coonoor, optimizing your existing vacation rental, or exploring rental arbitrage opportunities, understanding the Coonoor Airbnb data is crucial. Leveraging the low regulation environment is key to maximizing your short term rental income potential. Let's dive into the specifics.
Key Coonoor Airbnb Performance Metrics Overview
Monthly Airbnb Revenue Variations & Income Potential in Coonoor (2026)
Understanding the monthly revenue variations for Airbnb listings in Coonoor is key to maximizing your short term rental income potential. Seasonality significantly impacts earnings. Our analysis, based on data from the past 12 months, shows that the peak revenue month for STRs in Coonoor is typically May, while January often presents the lowest earnings, highlighting opportunities for strategic pricing adjustments during shoulder and low seasons. Explore the typical Airbnb income in Coonoor across different performance tiers:
- Best-in-class properties (Top 10%) achieve $2,167+ monthly, often utilizing dynamic pricing and superior guest experiences.
- Strong performing properties (Top 25%) earn $1,251 or more, indicating effective management and desirable locations/amenities.
- Typical properties (Median) generate around $587 per month, representing the average market performance.
- Entry-level properties (Bottom 25%) see earnings around $275, often with potential for optimization.
Average Monthly Airbnb Earnings Trend in Coonoor
Coonoor Airbnb Occupancy Rate Trends (2026)
Maximize your bookings by understanding the Coonoor STR occupancy trends. Seasonal demand shifts significantly influence how often properties are booked. Typically, Maysees the highest demand (peak season occupancy), while September experiences the lowest (low season). Effective strategies, like adjusting minimum stays or offering promotions, can boost occupancy during slower periods. Here's how different property tiers perform in Coonoor:
- Best-in-class properties (Top 10%) achieve 57%+ occupancy, indicating high desirability and potentially optimized availability.
- Strong performing properties (Top 25%) maintain 40% or higher occupancy, suggesting good market fit and guest satisfaction.
- Typical properties (Median) have an occupancy rate around 20%.
- Entry-level properties (Bottom 25%) average 11% occupancy, potentially facing higher vacancy.
Average Monthly Occupancy Rate Trend in Coonoor
Average Daily Rate (ADR) Airbnb Trends in Coonoor (2026)
Effective short term rental pricing strategy in Coonoor involves understanding monthly ADR fluctuations. The Average Daily Rate (ADR) for Airbnb in Coonoor typically peaks in May and dips lowest during October. Leveraging Airbnb dynamic pricing tools or strategies based on this seasonality can significantly boost revenue. Here's a look at the typical nightly rates achieved:
- Best-in-class properties (Top 10%) command rates of $187+ per night, often due to premium features or locations.
- Strong performing properties (Top 25%) achieve nightly rates of $120 or more.
- Typical properties (Median) charge around $82 per night.
- Entry-level properties (Bottom 25%) earn around $57 per night.
Average Daily Rate (ADR) Trend by Month in Coonoor
Get Live Coonoor Market Intelligence 👇

Explore Real-time Analytics
Airbnb Seasonality Analysis & Trends in Coonoor (2026)
Peak Season (May, April, March)
- Revenue averages $1,314 per month
- Occupancy rates average 36.3%
- Daily rates average $103
Shoulder Season
- Revenue averages $847 per month
- Occupancy maintains around 26.0%
- Daily rates hold near $100
Low Season (January, September, November)
- Revenue drops to average $609 per month
- Occupancy decreases to average 22.2%
- Daily rates adjust to average $98
Seasonality Insights for Coonoor
- The Airbnb seasonality in Coonoor shows highly seasonal trends requiring careful strategy. While the sections above show seasonal averages, it's also insightful to look at the extremes:
- During the high season, the absolute peak month showcases Coonoor's highest earning potential, with monthly revenues capable of climbing to $1,615, occupancy reaching a high of 40.7%, and ADRs peaking at $107.
- Conversely, the slowest single month of the year, typically falling within the low season, marks the market's lowest point. In this month, revenue might dip to $593, occupancy could drop to 21.2%, and ADRs may adjust down to $96.
- Understanding both the seasonal averages and these monthly peaks and troughs in revenue, occupancy, and ADR is crucial for maximizing your Airbnb profit potential in Coonoor.
Seasonal Strategies for Maximizing Profit
- Peak Season: Maximize revenue through premium pricing and potentially longer minimum stays. Ensure high availability.
- Low Season: Offer competitive pricing, special promotions (e.g., extended stay discounts), and flexible cancellation policies. Target off-season travelers like remote workers or budget-conscious guests.
- Shoulder Seasons: Implement dynamic pricing that balances peak and low rates. Target weekend travelers or specific events. Offer slightly more flexible terms than peak season.
- Regularly analyze your own performance against these Coonoor seasonality benchmarks and adjust your pricing and availability strategy accordingly.
Best Areas for Airbnb Investment in Coonoor (2026)
Exploring the top neighborhoods for short-term rentals in Coonoor? This section highlights key areas, outlining why they are attractive for hosts and guests, along with notable local attractions. Consider these locations based on your target guest profile and investment strategy.
| Neighborhood / Area | Why Host Here? (Target Guests & Appeal) | Key Attractions & Landmarks |
|---|---|---|
| Nilgiri Hills | Renowned for its scenic beauty, pleasant climate, and tea plantations, making it a great spot for nature lovers seeking tranquility away from the hustle and bustle. | Heritage Train, Lamb's Rock, Dolphin's Nose, Tea Gardens, Botanical Garden |
| Coonoor Railway Station | This historic railway station is a major attraction due to its colonial architecture and the toy train rides that connect Coonoor to Ooty, appealing to tourists and train enthusiasts alike. | Nilgiri Mountain Railway, Toy Train Rides, Coonoor Market, Heritage Sites |
| Sim's Park | A beautifully maintained park that attracts families and tourists, known for its diverse flora and stunning landscapes, ideal for leisure and relaxation. | Sim's Park, Botanical Gardens, Walking Trails, Picnic Areas |
| Lamb's Rock | A popular viewpoint offering breathtaking panoramas of the Nilgiri Hills, perfect for tourists seeking scenic views and photography opportunities. | Lamb’s Rock Viewpoint, Treks, Nature Walks |
| Dolphin's Nose | Famous for its distinctive rock formation and spectacular views over the valley, it's a favored spot for adventure seekers and photographers. | Dolphin's Nose Viewpoint, Trekking Trails, Nature Photography |
| Tea Estates | Coonoor is famous for its tea estates which draw visitors who are interested in agritourism and exploring the tea-making process. | Tea Factory Tours, Tea Tasting, Plantation Walks |
| Kotagiri | A nearby town known for its panoramic views and cool climate, making it a quieter alternative for tourists looking to escape the crowds. | Kotagiri Viewpoints, Tea Gardens, Nature Trails |
| Ooty Road | A main access road that leads to numerous attractions in Coonoor and Ooty, making it a convenient location for visitors to explore the region. | Ooty, Nilgiri Mountain Railway, Food Stalls and Shops |
Understanding Airbnb License Requirements & STR Laws in Coonoor (2026)
While Coonoor, Tamil Nadu, India currently shows low STR regulations, specific Airbnb license requirements might still exist or change. Always verify the latest short term rental regulations and Airbnb license requirements directly with local government authorities for Coonoor to ensure full compliance before hosting.
(Source: AirROI data, 2026, finding no licensed listings among those analyzed)
Top Performing Airbnb Properties in Coonoor (2026)
Benchmark your potential! Explore examples of top-performing Airbnb properties in Coonoorbased on Trailing Twelve Month (TTM) revenue. Analyze their characteristics, revenue, occupancy rate, and ADR to understand what drives success in this market.

Cloud Walk by Xplore Indo | Luxury 5 BR
Entire Place • 5 bedrooms

Villa Alpinia, Coonoor (Recommended by Condé Nast)
Entire Place • 3 bedrooms
Harmony Hill
Entire Place • 3 bedrooms

Shunyata Coonoor
Entire Place • 3 bedrooms
Eden | BnB | Boutique Room 2 | Amazing View
Private Room • 1 bedroom

Eden | BnB | Boutique Room 1 | View | Breakfast
Private Room • 1 bedroom
Note: Performance varies based on location, size, amenities, seasonality, and management quality. Data reflects the past 12 months.
Top Performing Airbnb Hosts in Coonoor (2026)
Learn from the best! This table showcases top-performing Airbnb hosts in Coonoor based on the number of properties managed and estimated total revenue over the past year. Analyze their scale and performance metrics.
| Host Name | Properties | Grossing Revenue | Stay Reviews | Avg Rating |
|---|---|---|---|---|
| Maria | 3 | $41,755 | 143 | 4.99/5.0 |
| Kumar | 2 | $40,395 | 18 | 4.76/5.0 |
| Rupali | 1 | $32,753 | 58 | 4.91/5.0 |
| Aakhil | 1 | $24,849 | 19 | 4.95/5.0 |
| Rama | 4 | $24,009 | 153 | 4.92/5.0 |
| Siraj Ayesha | 1 | $21,281 | 82 | 4.84/5.0 |
| Christopher | 4 | $18,551 | 7 | 4.67/5.0 |
| Hospitality Expert - Global | 1 | $16,223 | 319 | 4.53/5.0 |
| Rahul | 1 | $15,252 | 31 | 4.74/5.0 |
| Kripali | 2 | $13,888 | 27 | 4.71/5.0 |
Analyzing the strategies of top hosts, such as their property selection, pricing, and guest communication, can offer valuable lessons for optimizing your own Airbnb operations in Coonoor.
Dive Deeper: Advanced Coonoor STR Market Data (2026)
Ready to unlock more insights? AirROI provides access to advanced metrics and comprehensive Airbnb data for Coonoor. Explore detailed analytics beyond this report to refine your investment strategy, optimize pricing, and maximize your vacation rental profits.
Explore Advanced MetricsCoonoor Short-Term Rental Market Composition (2026): Property & Room Types
Room Type Distribution
Property Type Distribution
Market Composition Insights for Coonoor
- The Coonoor Airbnb market composition is heavily skewed towards Entire Home/Apt listings, which make up 50.8% of the 61 active rentals. This indicates strong guest preference for privacy and space.
- However, a notable 47.5% share for Private Rooms suggests opportunities for budget-conscious travelers or hosts renting out spare rooms.
- Looking at the property type distribution in Coonoor, House properties are the most common (54.1%), reflecting the local real estate landscape.
- Houses represent a significant 54.1% portion, catering likely to families or larger groups.
- The presence of 32.8% Hotel/Boutique listings indicates integration with traditional hospitality.
- Smaller segments like outdoor/unique, unique stays, others (combined 6.5%) offer potential for unique stay experiences.
Coonoor Airbnb Room Capacity Analysis (2026): Bedroom Distribution
Distribution of Listings by Number of Bedrooms
Room Capacity Insights for Coonoor
- The dominant room capacity in Coonoor is 3 bedrooms listings, making up 21.3% of the market. This suggests a strong demand for properties suitable for families or small groups.
- Together, 3 bedrooms and 1 bedroom properties represent 41.0% of the active Airbnb listings in Coonoor, indicating a high concentration in these sizes.
- A significant 36.1% of listings offer 3+ bedrooms, catering to larger groups and families seeking more space in Coonoor.
Coonoor Vacation Rental Guest Capacity Trends (2026)
Distribution of Listings by Guest Capacity
Guest Capacity Insights for Coonoor
- The most common guest capacity trend in Coonoor vacation rentals is listings accommodating 8+ guests (19.7%). This suggests the primary traveler segment is likely larger groups.
- Properties designed for 8+ guests and 2 guests dominate the Coonoor STR market, accounting for 37.7% of listings.
- 27.9% of properties accommodate 6+ guests, serving the market segment for larger families or group travel in Coonoor.
- On average, properties in Coonoor are equipped to host 3.2 guests.
Coonoor Airbnb Booking Patterns (2026): Available vs. Booked Days
Available Days Distribution
Booked Days Distribution
Booking Pattern Insights for Coonoor
- The most common availability pattern in Coonoor falls within the 271-366 days range, representing 78.7% of listings. This suggests many properties have significant open periods on their calendars.
- Approximately 95.1% of listings show high availability (181+ days open annually), indicating potential for increased bookings or specific owner usage patterns.
- For booked days, the 1-30 days range is most frequent in Coonoor (44.3%), reflecting common guest stay durations or potential owner blocking patterns.
- A notable 4.9% of properties secure long booking periods (181+ days booked per year), highlighting successful long-term rental strategies or significant owner usage.
Coonoor Airbnb Minimum Stay Requirements Analysis
Distribution of Listings by Minimum Night Requirement
1 Night
47 listings
77% of total
2 Nights
1 listings
1.6% of total
30+ Nights
13 listings
21.3% of total
Key Insights
- The most prevalent minimum stay requirement in Coonoor is 1 Night, adopted by 77% of listings. This highlights the market's preference for shorter, flexible bookings.
- A strong majority (78.6%) of the Coonoor Airbnb data shows acceptance of very short stays (1-2 nights), indicating a dynamic, high-turnover market.
- A significant segment (21.3%) caters to monthly stays (30+ nights) in Coonoor, pointing to opportunities in the extended-stay market.
Recommendations
- Align with the market by considering a 1 Night minimum stay, as 77% of Coonoor hosts use this setting.
- Explore offering discounts for stays of 30+ nights to attract the 21.3% of the market seeking extended stays.
- Adjust minimum nights based on seasonality – potentially shorter during low season and longer during peak demand periods in Coonoor.
Coonoor Airbnb Cancellation Policy Trends Analysis (2026)
Super Strict 30 Days
2 listings
3.3% of total
Limited
1 listings
1.6% of total
Flexible
18 listings
29.5% of total
Moderate
17 listings
27.9% of total
Firm
18 listings
29.5% of total
Strict
5 listings
8.2% of total
Cancellation Policy Insights for Coonoor
- The prevailing Airbnb cancellation policy trend in Coonoor is Flexible, used by 29.5% of listings.
- There's a relatively balanced mix between guest-friendly (57.4%) and stricter (37.7%) policies, offering choices for different guest needs.
- Strict cancellation policies are quite rare (8.2%), potentially making listings with this policy less competitive unless justified by high demand or property type.
Recommendations for Hosts
- Consider adopting a Flexible policy to align with the 29.5% market standard in Coonoor.
- Using a Strict policy might deter some guests, as only 8.2% of listings use it. Evaluate if potential revenue protection outweighs possible lower booking rates.
- Regularly review your cancellation policy against competitors and market demand shifts in Coonoor.
Coonoor STR Booking Lead Time Analysis (2026)
Average Booking Lead Time by Month
Booking Lead Time Insights for Coonoor
- The overall average booking lead time for vacation rentals in Coonoor is 27 days.
- Guests book furthest in advance for stays during December (average 39 days), likely coinciding with peak travel demand or local events.
- The shortest booking windows occur for stays in July (average 15 days), indicating more last-minute travel plans during this time.
- Seasonally, Winter (27 days avg.) sees the longest lead times, while Summer (19 days avg.) has the shortest, reflecting typical travel planning cycles.
Recommendations for Hosts
- Use the overall average lead time (27 days) as a baseline for your pricing and availability strategy in Coonoor.
- For December stays, consider implementing length-of-stay discounts or slightly higher rates for bookings made less than 39 days out to capitalize on advance planning.
- Target marketing efforts for the Winter season well in advance (at least 27 days) to capture early planners.
- Monitor your own booking lead times against these Coonoor averages to identify opportunities for dynamic pricing adjustments.
Popular & Essential Airbnb Amenities in Coonoor (2026)
Amenity Prevalence
Amenity Insights for Coonoor
- Popular amenities like Free parking on premises, Wifi, Hot water are common but not universal. Offering these can provide a competitive edge.
- Warning: Wifi is not universally provided but is considered essential globally. Ensure reliable Wifi is offered.
Recommendations for Hosts
- Consider adding popular differentiators like Free parking on premises or Wifi to increase appeal.
- Highlight unique or less common amenities you offer (e.g., hot tub, dedicated workspace, EV charger) in your listing description and photos.
- Regularly check competitor amenities in Coonoor to stay competitive.
Coonoor Airbnb Guest Demographics & Profile Analysis (2026)
Guest Profile Summary for Coonoor
- The typical guest profile for Airbnb in Coonoor consists of primarily domestic travelers (85%), often arriving from nearby Bengaluru, typically belonging to the Post-2000s (Gen Z/Alpha) group (50%), primarily speaking English or Hindi.
- Domestic travelers account for 85.2% of guests.
- Key international markets include India (85.2%) and United States (4.5%).
- Top languages spoken are English (40.8%) followed by Hindi (32.9%).
- A significant demographic segment is the Post-2000s (Gen Z/Alpha) group, representing 50% of guests.
Recommendations for Hosts
- Target domestic marketing efforts towards travelers from Bengaluru and Chennai.
- Tailor amenities and listing descriptions to appeal to the dominant Post-2000s (Gen Z/Alpha) demographic (e.g., highlight fast WiFi, smart home features, local guides).
- Highlight unique local experiences or amenities relevant to the primary guest profile.
- Consider seasonal promotions aligned with peak travel times for key origin markets.
Nearby Short-Term Rental Market Comparison
How does the Coonoor Airbnb market stack up against its neighbors? Compare key performance metrics like average monthly revenue, ADR, and occupancy rates in surrounding areas to understand the broader regional STR landscape.
| Market | Active Properties | Monthly Revenue | Daily Rate | Avg. Occupancy |
|---|---|---|---|---|
| Suntikoppa | 11 | $1,963 | $254.42 | 22% |
| Munambam | 10 | $1,444 | $118.22 | 35% |
| Pothamedu | 13 | $920 | $128.46 | 26% |
| Vilpatti | 42 | $721 | $102.89 | 28% |
| Adimali | 11 | $677 | $83.99 | 31% |
| Achanakal hatty | 15 | $667 | $77.56 | 29% |
| Lovedale | 17 | $634 | $150.15 | 22% |
| Udhagamandalam | 203 | $621 | $100.87 | 23% |
| Chemanchery | 10 | $612 | $97.29 | 23% |
| Gandhi Nagar B. L. Shed | 10 | $495 | $68.51 | 30% |