Coimbatore Airbnb Market Analysis 2026: Short Term Rental Data & Vacation Rental Statistics in Tamil Nadu, India
Is Airbnb profitable in Coimbatore in 2026? Explore comprehensive Airbnb analytics for Coimbatore, Tamil Nadu, India to uncover income potential. This 2026 STR market report for Coimbatore, based on AirROI data from February 2025 to January 2026, reveals key trends in the niche market of 112 active listings.
Whether you're considering an Airbnb investment in Coimbatore, optimizing your existing vacation rental, or exploring rental arbitrage opportunities, understanding the Coimbatore Airbnb data is crucial. Leveraging the low regulation environment is key to maximizing your short term rental income potential. Let's dive into the specifics.
Key Coimbatore Airbnb Performance Metrics Overview
Monthly Airbnb Revenue Variations & Income Potential in Coimbatore (2026)
Understanding the monthly revenue variations for Airbnb listings in Coimbatore is key to maximizing your short term rental income potential. Seasonality significantly impacts earnings. Our analysis, based on data from the past 12 months, shows that the peak revenue month for STRs in Coimbatore is typically April, while October often presents the lowest earnings, highlighting opportunities for strategic pricing adjustments during shoulder and low seasons. Explore the typical Airbnb income in Coimbatore across different performance tiers:
- Best-in-class properties (Top 10%) achieve $705+ monthly, often utilizing dynamic pricing and superior guest experiences.
- Strong performing properties (Top 25%) earn $420 or more, indicating effective management and desirable locations/amenities.
- Typical properties (Median) generate around $228 per month, representing the average market performance.
- Entry-level properties (Bottom 25%) see earnings around $101, often with potential for optimization.
Average Monthly Airbnb Earnings Trend in Coimbatore
Coimbatore Airbnb Occupancy Rate Trends (2026)
Maximize your bookings by understanding the Coimbatore STR occupancy trends. Seasonal demand shifts significantly influence how often properties are booked. Typically, Decembersees the highest demand (peak season occupancy), while October experiences the lowest (low season). Effective strategies, like adjusting minimum stays or offering promotions, can boost occupancy during slower periods. Here's how different property tiers perform in Coimbatore:
- Best-in-class properties (Top 10%) achieve 59%+ occupancy, indicating high desirability and potentially optimized availability.
- Strong performing properties (Top 25%) maintain 39% or higher occupancy, suggesting good market fit and guest satisfaction.
- Typical properties (Median) have an occupancy rate around 21%.
- Entry-level properties (Bottom 25%) average 11% occupancy, potentially facing higher vacancy.
Average Monthly Occupancy Rate Trend in Coimbatore
Average Daily Rate (ADR) Airbnb Trends in Coimbatore (2026)
Effective short term rental pricing strategy in Coimbatore involves understanding monthly ADR fluctuations. The Average Daily Rate (ADR) for Airbnb in Coimbatore typically peaks in April and dips lowest during January. Leveraging Airbnb dynamic pricing tools or strategies based on this seasonality can significantly boost revenue. Here's a look at the typical nightly rates achieved:
- Best-in-class properties (Top 10%) command rates of $81+ per night, often due to premium features or locations.
- Strong performing properties (Top 25%) achieve nightly rates of $45 or more.
- Typical properties (Median) charge around $32 per night.
- Entry-level properties (Bottom 25%) earn around $23 per night.
Average Daily Rate (ADR) Trend by Month in Coimbatore
Get Live Coimbatore Market Intelligence 👇

Explore Real-time Analytics
Airbnb Seasonality Analysis & Trends in Coimbatore (2026)
Peak Season (April, May, July)
- Revenue averages $390 per month
- Occupancy rates average 29.4%
- Daily rates average $46
Shoulder Season
- Revenue averages $323 per month
- Occupancy maintains around 28.7%
- Daily rates hold near $43
Low Season (January, October, November)
- Revenue drops to average $259 per month
- Occupancy decreases to average 24.8%
- Daily rates adjust to average $39
Seasonality Insights for Coimbatore
- The Airbnb seasonality in Coimbatore shows moderate seasonality with distinct peak and low periods. While the sections above show seasonal averages, it's also insightful to look at the extremes:
- During the high season, the absolute peak month showcases Coimbatore's highest earning potential, with monthly revenues capable of climbing to $430, occupancy reaching a high of 34.0%, and ADRs peaking at $48.
- Conversely, the slowest single month of the year, typically falling within the low season, marks the market's lowest point. In this month, revenue might dip to $242, occupancy could drop to 23.4%, and ADRs may adjust down to $38.
- Understanding both the seasonal averages and these monthly peaks and troughs in revenue, occupancy, and ADR is crucial for maximizing your Airbnb profit potential in Coimbatore.
Seasonal Strategies for Maximizing Profit
- Peak Season: Maximize revenue through premium pricing and potentially longer minimum stays. Ensure high availability.
- Low Season: Offer competitive pricing, special promotions (e.g., extended stay discounts), and flexible cancellation policies. Target off-season travelers like remote workers or budget-conscious guests.
- Shoulder Seasons: Implement dynamic pricing that balances peak and low rates. Target weekend travelers or specific events. Offer slightly more flexible terms than peak season.
- Regularly analyze your own performance against these Coimbatore seasonality benchmarks and adjust your pricing and availability strategy accordingly.
Best Areas for Airbnb Investment in Coimbatore (2026)
Exploring the top neighborhoods for short-term rentals in Coimbatore? This section highlights key areas, outlining why they are attractive for hosts and guests, along with notable local attractions. Consider these locations based on your target guest profile and investment strategy.
| Neighborhood / Area | Why Host Here? (Target Guests & Appeal) | Key Attractions & Landmarks |
|---|---|---|
| Peelamedu | A prominent area known for its educational institutions, making it ideal for students and visiting parents. | Coimbatore Institute of Technology, PSG College of Technology, Tamil Nadu Agricultural University, Peelamedu Lake |
| RS Puram | A residential neighborhood that is popular among families and working professionals due to its proximity to shopping and dining. | Brookefields Mall, Gandhipuram, Sree Ayyappan Temple, RS Puram Market |
| Tidel Park | An IT hub that attracts tech professionals, making it great for business travellers and those attending conferences. | Tidel Park IT SEZ, Puliakulam Lake, IT companies and startups |
| Singanallur | A growing area with a mix of industrial and residential spaces, appealing to business travellers. | Singanallur Lake, Schools and colleges, Easily accessible to Coimbatore International Airport |
| Saravanampatti | A rapidly developing area with proximity to IT parks and educational institutions, attracting young professionals. | GEM Park, Saravanampatti Lake, Educational institutions such as Amity University |
| Kovai Kut Paradise | An attractive area for leisure travelers with parks and natural beauty suitable for family stays. | Kovai Kutraleeshwarar Temple, Park facilities, Green spaces and walking tracks |
| Race Course | An upscale area popular for its luxury hotels, boutiques, and fine dining experiences. | VOC Park, Race Course grounds, Shopping and dining |
| Town Hall | A central business district with a mix of commercial and residential, ideal for short stays in the heart of the city. | Town Hall, Coimbatore Junction, Shopping areas |
Understanding Airbnb License Requirements & STR Laws in Coimbatore (2026)
While Coimbatore, Tamil Nadu, India currently shows low STR regulations, specific Airbnb license requirements might still exist or change. Always verify the latest short term rental regulations and Airbnb license requirements directly with local government authorities for Coimbatore to ensure full compliance before hosting.
(Source: AirROI data, 2026, finding no licensed listings among those analyzed)
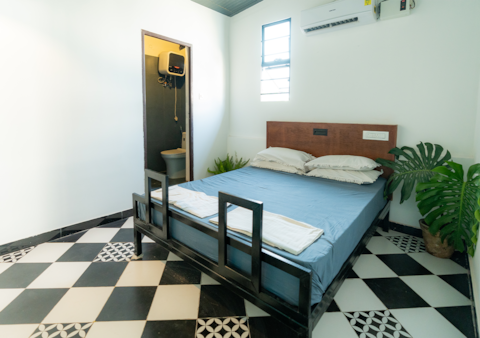
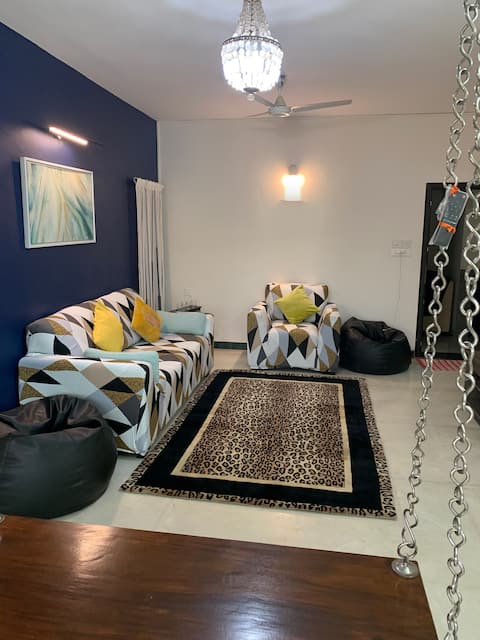
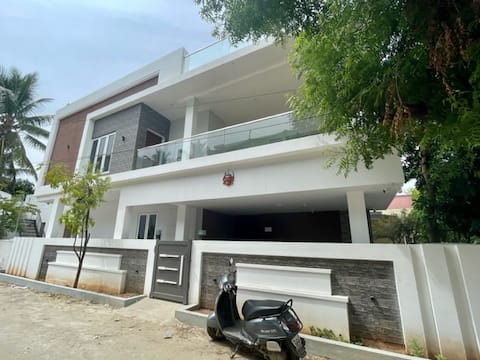
Top Performing Airbnb Properties in Coimbatore (2026)
Benchmark your potential! Explore examples of top-performing Airbnb properties in Coimbatorebased on Trailing Twelve Month (TTM) revenue. Analyze their characteristics, revenue, occupancy rate, and ADR to understand what drives success in this market.

Guestlines serviced Apartments
Entire Place • 2 bedrooms
Moustache Coimbatore | Superior Room
Private Room • 1 bedroom
Modern Apartment in Coimbatore
Entire Place • 2 bedrooms
Vacation Villa in Vadavalli
Entire Place • 3 bedrooms

Raichura's
Entire Place • 2 bedrooms

RR Nest-Peaceful 2BHK first floor-Near Airport
Entire Place • 2 bedrooms
Note: Performance varies based on location, size, amenities, seasonality, and management quality. Data reflects the past 12 months.
Top Performing Airbnb Hosts in Coimbatore (2026)
Learn from the best! This table showcases top-performing Airbnb hosts in Coimbatore based on the number of properties managed and estimated total revenue over the past year. Analyze their scale and performance metrics.
| Host Name | Properties | Grossing Revenue | Stay Reviews | Avg Rating |
|---|---|---|---|---|
| Shambhavi | 15 | $30,274 | 273 | 4.51/5.0 |
| Suresh | 6 | $19,677 | 971 | 4.95/5.0 |
| Kartik | 4 | $17,757 | 127 | 4.83/5.0 |
| Rentor.In | 2 | $11,845 | 52 | 4.47/5.0 |
| Shanthi | 5 | $11,699 | 16 | 4.57/5.0 |
| Host #98326306 | 1 | $11,389 | 0 | Not Rated |
| Zubair | 4 | $11,283 | 19 | 4.77/5.0 |
| Christopher | 3 | $11,190 | 6 | Not Rated |
| Padmini | 1 | $10,980 | 71 | 4.99/5.0 |
| Ramya | 1 | $8,797 | 39 | 4.85/5.0 |
Analyzing the strategies of top hosts, such as their property selection, pricing, and guest communication, can offer valuable lessons for optimizing your own Airbnb operations in Coimbatore.
Dive Deeper: Advanced Coimbatore STR Market Data (2026)
Ready to unlock more insights? AirROI provides access to advanced metrics and comprehensive Airbnb data for Coimbatore. Explore detailed analytics beyond this report to refine your investment strategy, optimize pricing, and maximize your vacation rental profits.
Explore Advanced MetricsCoimbatore Short-Term Rental Market Composition (2026): Property & Room Types
Room Type Distribution
Property Type Distribution
Market Composition Insights for Coimbatore
- The Coimbatore Airbnb market composition is heavily skewed towards Entire Home/Apt listings, which make up 64.3% of the 112 active rentals. This indicates strong guest preference for privacy and space.
- However, a notable 34.8% share for Private Rooms suggests opportunities for budget-conscious travelers or hosts renting out spare rooms.
- Looking at the property type distribution in Coimbatore, House properties are the most common (44.6%), reflecting the local real estate landscape.
- Houses represent a significant 44.6% portion, catering likely to families or larger groups.
- The presence of 14.3% Hotel/Boutique listings indicates integration with traditional hospitality.
- Smaller segments like outdoor/unique (combined 3.6%) offer potential for unique stay experiences.
Coimbatore Airbnb Room Capacity Analysis (2026): Bedroom Distribution
Distribution of Listings by Number of Bedrooms
Room Capacity Insights for Coimbatore
- The dominant room capacity in Coimbatore is 2 bedrooms listings, making up 33.9% of the market. This suggests a strong demand for properties suitable for couples or solo travelers.
- Together, 2 bedrooms and 1 bedroom properties represent 63.4% of the active Airbnb listings in Coimbatore, indicating a high concentration in these sizes.
Coimbatore Vacation Rental Guest Capacity Trends (2026)
Distribution of Listings by Guest Capacity
Guest Capacity Insights for Coimbatore
- The most common guest capacity trend in Coimbatore vacation rentals is listings accommodating 8+ guests (17%). This suggests the primary traveler segment is likely larger groups.
- Properties designed for 8+ guests and 6 guests dominate the Coimbatore STR market, accounting for 32.2% of listings.
- 39.3% of properties accommodate 6+ guests, serving the market segment for larger families or group travel in Coimbatore.
- On average, properties in Coimbatore are equipped to host 4.2 guests.
Coimbatore Airbnb Booking Patterns (2026): Available vs. Booked Days
Available Days Distribution
Booked Days Distribution
Booking Pattern Insights for Coimbatore
- The most common availability pattern in Coimbatore falls within the 271-366 days range, representing 78.6% of listings. This suggests many properties have significant open periods on their calendars.
- Approximately 94.7% of listings show high availability (181+ days open annually), indicating potential for increased bookings or specific owner usage patterns.
- For booked days, the 31-90 days range is most frequent in Coimbatore (40.2%), reflecting common guest stay durations or potential owner blocking patterns.
- A notable 5.4% of properties secure long booking periods (181+ days booked per year), highlighting successful long-term rental strategies or significant owner usage.
Coimbatore Airbnb Minimum Stay Requirements Analysis
Distribution of Listings by Minimum Night Requirement
1 Night
95 listings
84.8% of total
2 Nights
9 listings
8% of total
3 Nights
2 listings
1.8% of total
7-29 Nights
1 listings
0.9% of total
30+ Nights
5 listings
4.5% of total
Key Insights
- The most prevalent minimum stay requirement in Coimbatore is 1 Night, adopted by 84.8% of listings. This highlights the market's preference for shorter, flexible bookings.
- A strong majority (92.8%) of the Coimbatore Airbnb data shows acceptance of very short stays (1-2 nights), indicating a dynamic, high-turnover market.
Recommendations
- Align with the market by considering a 1 Night minimum stay, as 84.8% of Coimbatore hosts use this setting.
- Adjust minimum nights based on seasonality – potentially shorter during low season and longer during peak demand periods in Coimbatore.
Coimbatore Airbnb Cancellation Policy Trends Analysis (2026)
Limited
3 listings
2.7% of total
Flexible
61 listings
55% of total
Moderate
21 listings
18.9% of total
Firm
23 listings
20.7% of total
Strict
3 listings
2.7% of total
Cancellation Policy Insights for Coimbatore
- The prevailing Airbnb cancellation policy trend in Coimbatore is Flexible, used by 55% of listings.
- The market strongly favors guest-friendly terms, with 73.9% of listings offering Flexible or Moderate policies. This suggests guests in Coimbatore may expect booking flexibility.
- Strict cancellation policies are quite rare (2.7%), potentially making listings with this policy less competitive unless justified by high demand or property type.
Recommendations for Hosts
- Consider adopting a Flexible policy to align with the 55% market standard in Coimbatore.
- Given the high prevalence of Flexible policies (55%), offering this can enhance booking appeal, especially during shoulder seasons.
- Using a Strict policy might deter some guests, as only 2.7% of listings use it. Evaluate if potential revenue protection outweighs possible lower booking rates.
- Regularly review your cancellation policy against competitors and market demand shifts in Coimbatore.
Coimbatore STR Booking Lead Time Analysis (2026)
Average Booking Lead Time by Month
Booking Lead Time Insights for Coimbatore
- The overall average booking lead time for vacation rentals in Coimbatore is 21 days.
- Guests book furthest in advance for stays during November (average 28 days), likely coinciding with peak travel demand or local events.
- The shortest booking windows occur for stays in May (average 15 days), indicating more last-minute travel plans during this time.
- Seasonally, Fall (23 days avg.) sees the longest lead times, while Spring (18 days avg.) has the shortest, reflecting typical travel planning cycles.
Recommendations for Hosts
- Use the overall average lead time (21 days) as a baseline for your pricing and availability strategy in Coimbatore.
- Target marketing efforts for the Fall season well in advance (at least 23 days) to capture early planners.
- Monitor your own booking lead times against these Coimbatore averages to identify opportunities for dynamic pricing adjustments.
Popular & Essential Airbnb Amenities in Coimbatore (2026)
Amenity Prevalence
Amenity Insights for Coimbatore
- Essential amenities in Coimbatore that guests expect include: Wifi. Lacking these (this) could significantly impact bookings.
- Popular amenities like TV, Kitchen, Free parking on premises are common but not universal. Offering these can provide a competitive edge.
Recommendations for Hosts
- Ensure your listing includes all essential amenities for Coimbatore: Wifi.
- Prioritize adding missing essentials: Wifi.
- Consider adding popular differentiators like TV or Kitchen to increase appeal.
- Highlight unique or less common amenities you offer (e.g., hot tub, dedicated workspace, EV charger) in your listing description and photos.
- Regularly check competitor amenities in Coimbatore to stay competitive.
Coimbatore Airbnb Guest Demographics & Profile Analysis (2026)
Guest Profile Summary for Coimbatore
- The typical guest profile for Airbnb in Coimbatore consists of a mix of domestic (64%) and international guests, often arriving from nearby Bengaluru, typically belonging to the Post-2000s (Gen Z/Alpha) group (50%), primarily speaking English or Hindi.
- Domestic travelers account for 63.6% of guests.
- Key international markets include India (63.6%) and United States (12.9%).
- Top languages spoken are English (38.6%) followed by Hindi (20.7%).
- A significant demographic segment is the Post-2000s (Gen Z/Alpha) group, representing 50% of guests.
Recommendations for Hosts
- Target domestic marketing efforts towards travelers from Bengaluru and Chennai.
- Tailor amenities and listing descriptions to appeal to the dominant Post-2000s (Gen Z/Alpha) demographic (e.g., highlight fast WiFi, smart home features, local guides).
- Highlight unique local experiences or amenities relevant to the primary guest profile.
- Consider seasonal promotions aligned with peak travel times for key origin markets.
Nearby Short-Term Rental Market Comparison
How does the Coimbatore Airbnb market stack up against its neighbors? Compare key performance metrics like average monthly revenue, ADR, and occupancy rates in surrounding areas to understand the broader regional STR landscape.
| Market | Active Properties | Monthly Revenue | Daily Rate | Avg. Occupancy |
|---|---|---|---|---|
| Suntikoppa | 11 | $1,963 | $254.42 | 22% |
| Munambam | 10 | $1,444 | $118.22 | 35% |
| Pothamedu | 13 | $920 | $128.46 | 26% |
| Vilpatti | 42 | $721 | $102.89 | 28% |
| Adimali | 11 | $677 | $83.99 | 31% |
| Achanakal hatty | 15 | $667 | $77.56 | 29% |
| Lovedale | 17 | $634 | $150.15 | 22% |
| Udhagamandalam | 203 | $621 | $100.87 | 23% |
| Chemanchery | 10 | $612 | $97.29 | 23% |
| Coonoor | 61 | $515 | $103.42 | 24% |