Tungarli Airbnb Market Analysis 2026: Short Term Rental Data & Vacation Rental Statistics in Maharashtra, India
Is Airbnb profitable in Tungarli in 2026? Explore comprehensive Airbnb analytics for Tungarli, Maharashtra, India to uncover income potential. This 2026 STR market report for Tungarli, based on AirROI data from February 2025 to January 2026, reveals key trends in the niche market of 122 active listings.
Whether you're considering an Airbnb investment in Tungarli, optimizing your existing vacation rental, or exploring rental arbitrage opportunities, understanding the Tungarli Airbnb data is crucial. Leveraging the low regulation environment is key to maximizing your short term rental income potential. Let's dive into the specifics.
Key Tungarli Airbnb Performance Metrics Overview
Monthly Airbnb Revenue Variations & Income Potential in Tungarli (2026)
Understanding the monthly revenue variations for Airbnb listings in Tungarli is key to maximizing your short term rental income potential. Seasonality significantly impacts earnings. Our analysis, based on data from the past 12 months, shows that the peak revenue month for STRs in Tungarli is typically July, while November often presents the lowest earnings, highlighting opportunities for strategic pricing adjustments during shoulder and low seasons. Explore the typical Airbnb income in Tungarli across different performance tiers:
- Best-in-class properties (Top 10%) achieve $2,675+ monthly, often utilizing dynamic pricing and superior guest experiences.
- Strong performing properties (Top 25%) earn $1,369 or more, indicating effective management and desirable locations/amenities.
- Typical properties (Median) generate around $604 per month, representing the average market performance.
- Entry-level properties (Bottom 25%) see earnings around $293, often with potential for optimization.
Average Monthly Airbnb Earnings Trend in Tungarli
Tungarli Airbnb Occupancy Rate Trends (2026)
Maximize your bookings by understanding the Tungarli STR occupancy trends. Seasonal demand shifts significantly influence how often properties are booked. Typically, Julysees the highest demand (peak season occupancy), while November experiences the lowest (low season). Effective strategies, like adjusting minimum stays or offering promotions, can boost occupancy during slower periods. Here's how different property tiers perform in Tungarli:
- Best-in-class properties (Top 10%) achieve 50%+ occupancy, indicating high desirability and potentially optimized availability.
- Strong performing properties (Top 25%) maintain 31% or higher occupancy, suggesting good market fit and guest satisfaction.
- Typical properties (Median) have an occupancy rate around 19%.
- Entry-level properties (Bottom 25%) average 10% occupancy, potentially facing higher vacancy.
Average Monthly Occupancy Rate Trend in Tungarli
Average Daily Rate (ADR) Airbnb Trends in Tungarli (2026)
Effective short term rental pricing strategy in Tungarli involves understanding monthly ADR fluctuations. The Average Daily Rate (ADR) for Airbnb in Tungarli typically peaks in February and dips lowest during November. Leveraging Airbnb dynamic pricing tools or strategies based on this seasonality can significantly boost revenue. Here's a look at the typical nightly rates achieved:
- Best-in-class properties (Top 10%) command rates of $285+ per night, often due to premium features or locations.
- Strong performing properties (Top 25%) achieve nightly rates of $206 or more.
- Typical properties (Median) charge around $141 per night.
- Entry-level properties (Bottom 25%) earn around $81 per night.
Average Daily Rate (ADR) Trend by Month in Tungarli
Get Live Tungarli Market Intelligence 👇

Explore Real-time Analytics
Airbnb Seasonality Analysis & Trends in Tungarli (2026)
Peak Season (July, August, May)
- Revenue averages $1,301 per month
- Occupancy rates average 27.6%
- Daily rates average $162
Shoulder Season
- Revenue averages $1,072 per month
- Occupancy maintains around 22.9%
- Daily rates hold near $157
Low Season (January, February, November)
- Revenue drops to average $941 per month
- Occupancy decreases to average 20.9%
- Daily rates adjust to average $154
Seasonality Insights for Tungarli
- The Airbnb seasonality in Tungarli shows moderate seasonality with distinct peak and low periods. While the sections above show seasonal averages, it's also insightful to look at the extremes:
- During the high season, the absolute peak month showcases Tungarli's highest earning potential, with monthly revenues capable of climbing to $1,388, occupancy reaching a high of 30.1%, and ADRs peaking at $168.
- Conversely, the slowest single month of the year, typically falling within the low season, marks the market's lowest point. In this month, revenue might dip to $872, occupancy could drop to 20.1%, and ADRs may adjust down to $144.
- Understanding both the seasonal averages and these monthly peaks and troughs in revenue, occupancy, and ADR is crucial for maximizing your Airbnb profit potential in Tungarli.
Seasonal Strategies for Maximizing Profit
- Peak Season: Maximize revenue through premium pricing and potentially longer minimum stays. Ensure high availability.
- Low Season: Offer competitive pricing, special promotions (e.g., extended stay discounts), and flexible cancellation policies. Target off-season travelers like remote workers or budget-conscious guests.
- Shoulder Seasons: Implement dynamic pricing that balances peak and low rates. Target weekend travelers or specific events. Offer slightly more flexible terms than peak season.
- Regularly analyze your own performance against these Tungarli seasonality benchmarks and adjust your pricing and availability strategy accordingly.
Best Areas for Airbnb Investment in Tungarli (2026)
Exploring the top neighborhoods for short-term rentals in Tungarli? This section highlights key areas, outlining why they are attractive for hosts and guests, along with notable local attractions. Consider these locations based on your target guest profile and investment strategy.
| Neighborhood / Area | Why Host Here? (Target Guests & Appeal) | Key Attractions & Landmarks |
|---|---|---|
| Tungarli Lake | Scenic spot offering beautiful views and tranquil environment, perfect for nature lovers and relaxation seekers. Ideal for guests looking to unwind in a serene setting. | Tungarli Lake, Bhira Dam, Nature Trails, Viewpoints, Photography Spots |
| Dukkarwadi | A cozy neighborhood that's close to the main attractions in Lonavala while providing a peaceful retreat away from the hustle and bustle. | Dukkarwadi Waterfall, Nature Walks, Local Temples, Village Experience |
| Lakeside Road | A popular road near the lake with a variety of accommodation options and restaurants, attracting both tourists and locals for leisure activities. | Lakeside Restaurants, Water Sports, Weekend Getaways |
| Tiger Point | Famous for its breathtaking views and sunsets, it's a top spot for tourists looking for picturesque landscapes and adventure experiences. | Tiger Point Falls, Sunset Views, Adventure Sports |
| Lonavala-Bhushi Dam | A well-known tourist spot during the monsoon, drawing in visitors for its waterfall and relaxation by the dam amidst nature. | Bhushi Dam, Waterfall Trekking, Picnic Spots |
| Khandala Viewpoint | Offering panoramic views of the surrounding valleys and hills, this area attracts tourists looking for scenic beauty and outdoor activities. | Khandala Viewpoint, Hiking Trails, Adventure Activities |
| Lonavala Market | A bustling area filled with shops, local snacks, and eateries, perfect for guests who want to experience local culture and cuisine. | Shopping, Local Food, Cultural Experience |
| Rajmachi Fort | An ancient fort that attracts trekkers and history enthusiasts, great for those looking to explore heritage and nature. | Rajmachi Fort Trek, Historical Sites, Camping Opportunities |
Understanding Airbnb License Requirements & STR Laws in Tungarli (2026)
While Tungarli, Maharashtra, India currently shows low STR regulations, specific Airbnb license requirements might still exist or change. Always verify the latest short term rental regulations and Airbnb license requirements directly with local government authorities for Tungarli to ensure full compliance before hosting.
(Source: AirROI data, 2026, finding no licensed listings among those analyzed)
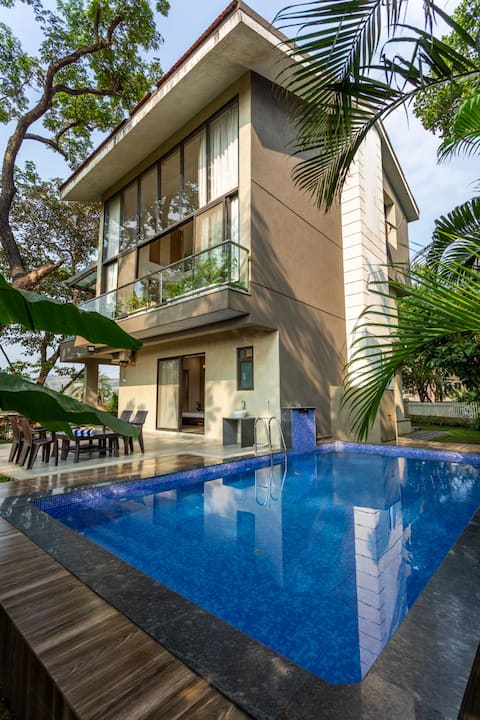
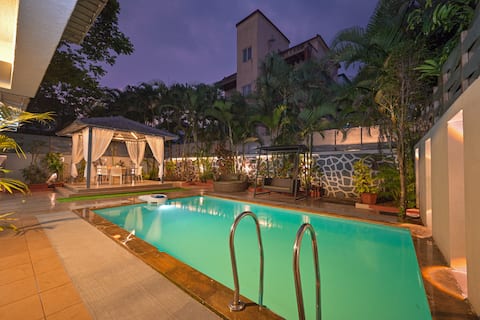
Top Performing Airbnb Properties in Tungarli (2026)
Benchmark your potential! Explore examples of top-performing Airbnb properties in Tungarlibased on Trailing Twelve Month (TTM) revenue. Analyze their characteristics, revenue, occupancy rate, and ADR to understand what drives success in this market.

La Flamingo 8BHK with Pvt Turf- Ekostay
Entire Place • 8 bedrooms
2. Seven sands 4BHK Private Pool Villa - The Aura
Entire Place • 4 bedrooms
4BHK Utsav Villa By Tropicana Stays
Entire Place • 4 bedrooms

ALPHA By Niaka
Entire Place • 3 bedrooms

Aaramghar Stays - 4BR Sierra Settle w/ Heated Pool
Entire Place • 4 bedrooms

Tara Amodaa Luxury Villa w/ Pool & Outdoor Theatre
Entire Place • 6 bedrooms
Note: Performance varies based on location, size, amenities, seasonality, and management quality. Data reflects the past 12 months.
Top Performing Airbnb Hosts in Tungarli (2026)
Learn from the best! This table showcases top-performing Airbnb hosts in Tungarli based on the number of properties managed and estimated total revenue over the past year. Analyze their scale and performance metrics.
| Host Name | Properties | Grossing Revenue | Stay Reviews | Avg Rating |
|---|---|---|---|---|
| Ali | 7 | $114,010 | 53 | 4.23/5.0 |
| Stellar Stays | 4 | $88,528 | 122 | 4.60/5.0 |
| Vishal | 2 | $85,557 | 59 | 4.38/5.0 |
| Aaramghar Stays | 2 | $70,334 | 63 | 4.87/5.0 |
| Harshal | 2 | $57,359 | 61 | 4.57/5.0 |
| Singh | 11 | $48,312 | 1488 | 4.81/5.0 |
| Mehmanghar Stays | 2 | $47,654 | 158 | 4.89/5.0 |
| Sameer | 4 | $43,471 | 92 | 4.80/5.0 |
| Kadir | 1 | $41,578 | 182 | 4.98/5.0 |
| Seven Sands | 2 | $37,441 | 207 | 4.53/5.0 |
Analyzing the strategies of top hosts, such as their property selection, pricing, and guest communication, can offer valuable lessons for optimizing your own Airbnb operations in Tungarli.
Dive Deeper: Advanced Tungarli STR Market Data (2026)
Ready to unlock more insights? AirROI provides access to advanced metrics and comprehensive Airbnb data for Tungarli. Explore detailed analytics beyond this report to refine your investment strategy, optimize pricing, and maximize your vacation rental profits.
Explore Advanced MetricsTungarli Short-Term Rental Market Composition (2026): Property & Room Types
Room Type Distribution
Property Type Distribution
Market Composition Insights for Tungarli
- The Tungarli Airbnb market composition is heavily skewed towards Entire Home/Apt listings, which make up 88.5% of the 122 active rentals. This indicates strong guest preference for privacy and space.
- Looking at the property type distribution in Tungarli, House properties are the most common (86.1%), reflecting the local real estate landscape.
- Houses represent a significant 86.1% portion, catering likely to families or larger groups.
- Smaller segments like hotel/boutique, others, apartment/condo (combined 7.3%) offer potential for unique stay experiences.
Tungarli Airbnb Room Capacity Analysis (2026): Bedroom Distribution
Distribution of Listings by Number of Bedrooms
Room Capacity Insights for Tungarli
- The dominant room capacity in Tungarli is 3 bedrooms listings, making up 34.4% of the market. This suggests a strong demand for properties suitable for families or small groups.
- Together, 3 bedrooms and 4 bedrooms properties represent 67.2% of the active Airbnb listings in Tungarli, indicating a high concentration in these sizes.
- A significant 72.9% of listings offer 3+ bedrooms, catering to larger groups and families seeking more space in Tungarli.
Tungarli Vacation Rental Guest Capacity Trends (2026)
Distribution of Listings by Guest Capacity
Guest Capacity Insights for Tungarli
- The most common guest capacity trend in Tungarli vacation rentals is listings accommodating 8+ guests (77.9%). This suggests the primary traveler segment is likely larger groups.
- Properties designed for 8+ guests and 4 guests dominate the Tungarli STR market, accounting for 83.6% of listings.
- 82.0% of properties accommodate 6+ guests, serving the market segment for larger families or group travel in Tungarli.
- On average, properties in Tungarli are equipped to host 6.8 guests.
Tungarli Airbnb Booking Patterns (2026): Available vs. Booked Days
Available Days Distribution
Booked Days Distribution
Booking Pattern Insights for Tungarli
- The most common availability pattern in Tungarli falls within the 271-366 days range, representing 82% of listings. This suggests many properties have significant open periods on their calendars.
- Approximately 95.9% of listings show high availability (181+ days open annually), indicating potential for increased bookings or specific owner usage patterns.
- For booked days, the 31-90 days range is most frequent in Tungarli (48.4%), reflecting common guest stay durations or potential owner blocking patterns.
- A notable 4.1% of properties secure long booking periods (181+ days booked per year), highlighting successful long-term rental strategies or significant owner usage.
Tungarli Airbnb Minimum Stay Requirements Analysis
Distribution of Listings by Minimum Night Requirement
1 Night
114 listings
93.4% of total
2 Nights
7 listings
5.7% of total
30+ Nights
1 listings
0.8% of total
Key Insights
- The most prevalent minimum stay requirement in Tungarli is 1 Night, adopted by 93.4% of listings. This highlights the market's preference for shorter, flexible bookings.
- A strong majority (99.1%) of the Tungarli Airbnb data shows acceptance of very short stays (1-2 nights), indicating a dynamic, high-turnover market.
- Dedicated monthly rentals (30+ nights) represent a small niche (0.8%), possibly an untapped area for hosts.
Recommendations
- Align with the market by considering a 1 Night minimum stay, as 93.4% of Tungarli hosts use this setting.
- Adjust minimum nights based on seasonality – potentially shorter during low season and longer during peak demand periods in Tungarli.
Tungarli Airbnb Cancellation Policy Trends Analysis (2026)
Limited
2 listings
1.7% of total
Super Strict 30 Days
8 listings
6.6% of total
Flexible
17 listings
14% of total
Moderate
56 listings
46.3% of total
Firm
27 listings
22.3% of total
Strict
11 listings
9.1% of total
Cancellation Policy Insights for Tungarli
- The prevailing Airbnb cancellation policy trend in Tungarli is Moderate, used by 46.3% of listings.
- There's a relatively balanced mix between guest-friendly (60.3%) and stricter (31.4%) policies, offering choices for different guest needs.
- Strict cancellation policies are quite rare (9.1%), potentially making listings with this policy less competitive unless justified by high demand or property type.
Recommendations for Hosts
- Consider adopting a Moderate policy to align with the 46.3% market standard in Tungarli.
- Using a Strict policy might deter some guests, as only 9.1% of listings use it. Evaluate if potential revenue protection outweighs possible lower booking rates.
- Regularly review your cancellation policy against competitors and market demand shifts in Tungarli.
Tungarli STR Booking Lead Time Analysis (2026)
Average Booking Lead Time by Month
Booking Lead Time Insights for Tungarli
- The overall average booking lead time for vacation rentals in Tungarli is 19 days.
- Guests book furthest in advance for stays during September (average 30 days), likely coinciding with peak travel demand or local events.
- The shortest booking windows occur for stays in March (average 11 days), indicating more last-minute travel plans during this time.
- Seasonally, Fall (23 days avg.) sees the longest lead times, while Spring (14 days avg.) has the shortest, reflecting typical travel planning cycles.
Recommendations for Hosts
- Use the overall average lead time (19 days) as a baseline for your pricing and availability strategy in Tungarli.
- For September stays, consider implementing length-of-stay discounts or slightly higher rates for bookings made less than 30 days out to capitalize on advance planning.
- During March, focus on last-minute booking availability and promotions, as guests book with very short notice (11 days avg.).
- Target marketing efforts for the Fall season well in advance (at least 23 days) to capture early planners.
- Monitor your own booking lead times against these Tungarli averages to identify opportunities for dynamic pricing adjustments.
Popular & Essential Airbnb Amenities in Tungarli (2026)
Amenity Prevalence
Amenity Insights for Tungarli
- Essential amenities in Tungarli that guests expect include: Air conditioning, Wifi. Lacking these (any) could significantly impact bookings.
- Popular amenities like Free parking on premises, Pool, TV are common but not universal. Offering these can provide a competitive edge.
- A pool is a highly desired but not standard amenity, making it a key feature for attracting guests seeking leisure in Tungarli.
Recommendations for Hosts
- Ensure your listing includes all essential amenities for Tungarli: Air conditioning, Wifi.
- Prioritize adding missing essentials: Air conditioning, Wifi.
- Consider adding popular differentiators like Free parking on premises or Pool to increase appeal.
- Highlight unique or less common amenities you offer (e.g., hot tub, dedicated workspace, EV charger) in your listing description and photos.
- Regularly check competitor amenities in Tungarli to stay competitive.
Tungarli Airbnb Guest Demographics & Profile Analysis (2026)
Guest Profile Summary for Tungarli
- The typical guest profile for Airbnb in Tungarli consists of primarily domestic travelers (86%), often arriving from nearby Mumbai, typically belonging to the Post-2000s (Gen Z/Alpha) group (50%), primarily speaking English or Hindi.
- Domestic travelers account for 85.9% of guests.
- Key international markets include India (85.9%) and United States (5%).
- Top languages spoken are English (44.6%) followed by Hindi (40.5%).
- A significant demographic segment is the Post-2000s (Gen Z/Alpha) group, representing 50% of guests.
Recommendations for Hosts
- Target domestic marketing efforts towards travelers from Mumbai and Pune.
- Tailor amenities and listing descriptions to appeal to the dominant Post-2000s (Gen Z/Alpha) demographic (e.g., highlight fast WiFi, smart home features, local guides).
- Highlight unique local experiences or amenities relevant to the primary guest profile.
- Consider seasonal promotions aligned with peak travel times for key origin markets.
Nearby Short-Term Rental Market Comparison
How does the Tungarli Airbnb market stack up against its neighbors? Compare key performance metrics like average monthly revenue, ADR, and occupancy rates in surrounding areas to understand the broader regional STR landscape.
| Market | Active Properties | Monthly Revenue | Daily Rate | Avg. Occupancy |
|---|---|---|---|---|
| Chondhi | 15 | $2,777 | $349.15 | 29% |
| Kihim | 11 | $2,317 | $296.88 | 27% |
| Gevhande Apati | 10 | $2,224 | $348.25 | 25% |
| Mahagaon | 12 | $1,989 | $268.55 | 33% |
| Chondi | 42 | $1,484 | $250.47 | 27% |
| Pimpari | 12 | $1,446 | $304.98 | 19% |
| Dhalewadi | 10 | $1,240 | $124.55 | 33% |
| Khandala | 25 | $1,229 | $250.56 | 24% |
| Awas | 26 | $1,128 | $233.10 | 22% |
| Waksai | 46 | $1,003 | $161.82 | 26% |