Panvel Airbnb Market Analysis 2026: Short Term Rental Data & Vacation Rental Statistics in Maharashtra, India
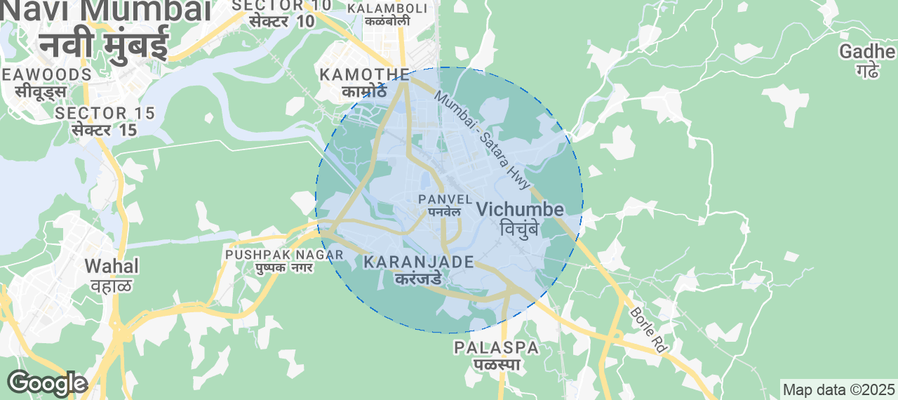
Is Airbnb profitable in Panvel in 2026? Explore comprehensive Airbnb analytics for Panvel, Maharashtra, India to uncover income potential. This 2026 STR market report for Panvel, based on AirROI data from February 2025 to January 2026, reveals key trends in the niche market of 26 active listings.
Whether you're considering an Airbnb investment in Panvel, optimizing your existing vacation rental, or exploring rental arbitrage opportunities, understanding the Panvel Airbnb data is crucial. Leveraging the low regulation environment is key to maximizing your short term rental income potential. Let's dive into the specifics.
Key Panvel Airbnb Performance Metrics Overview
Monthly Airbnb Revenue Variations & Income Potential in Panvel (2026)
Understanding the monthly revenue variations for Airbnb listings in Panvel is key to maximizing your short term rental income potential. Seasonality significantly impacts earnings. Our analysis, based on data from the past 12 months, shows that the peak revenue month for STRs in Panvel is typically March, while January often presents the lowest earnings, highlighting opportunities for strategic pricing adjustments during shoulder and low seasons. Explore the typical Airbnb income in Panvel across different performance tiers:
- Best-in-class properties (Top 10%) achieve $1,660+ monthly, often utilizing dynamic pricing and superior guest experiences.
- Strong performing properties (Top 25%) earn $711 or more, indicating effective management and desirable locations/amenities.
- Typical properties (Median) generate around $216 per month, representing the average market performance.
- Entry-level properties (Bottom 25%) see earnings around $67, often with potential for optimization.
Average Monthly Airbnb Earnings Trend in Panvel
Panvel Airbnb Occupancy Rate Trends (2026)
Maximize your bookings by understanding the Panvel STR occupancy trends. Seasonal demand shifts significantly influence how often properties are booked. Typically, Marchsees the highest demand (peak season occupancy), while October experiences the lowest (low season). Effective strategies, like adjusting minimum stays or offering promotions, can boost occupancy during slower periods. Here's how different property tiers perform in Panvel:
- Best-in-class properties (Top 10%) achieve 74%+ occupancy, indicating high desirability and potentially optimized availability.
- Strong performing properties (Top 25%) maintain 46% or higher occupancy, suggesting good market fit and guest satisfaction.
- Typical properties (Median) have an occupancy rate around 21%.
- Entry-level properties (Bottom 25%) average 12% occupancy, potentially facing higher vacancy.
Average Monthly Occupancy Rate Trend in Panvel
Average Daily Rate (ADR) Airbnb Trends in Panvel (2026)
Effective short term rental pricing strategy in Panvel involves understanding monthly ADR fluctuations. The Average Daily Rate (ADR) for Airbnb in Panvel typically peaks in October and dips lowest during September. Leveraging Airbnb dynamic pricing tools or strategies based on this seasonality can significantly boost revenue. Here's a look at the typical nightly rates achieved:
- Best-in-class properties (Top 10%) command rates of $103+ per night, often due to premium features or locations.
- Strong performing properties (Top 25%) achieve nightly rates of $58 or more.
- Typical properties (Median) charge around $23 per night.
- Entry-level properties (Bottom 25%) earn around $18 per night.
Average Daily Rate (ADR) Trend by Month in Panvel
Get Live Panvel Market Intelligence 👇
Explore Real-time Analytics
Airbnb Seasonality Analysis & Trends in Panvel (2026)
Peak Season (March, February, November)
- Revenue averages $703 per month
- Occupancy rates average 36.2%
- Daily rates average $48
Shoulder Season
- Revenue averages $560 per month
- Occupancy maintains around 31.8%
- Daily rates hold near $49
Low Season (January, September, December)
- Revenue drops to average $344 per month
- Occupancy decreases to average 25.6%
- Daily rates adjust to average $47
Seasonality Insights for Panvel
- The Airbnb seasonality in Panvel shows highly seasonal trends requiring careful strategy. While the sections above show seasonal averages, it's also insightful to look at the extremes:
- During the high season, the absolute peak month showcases Panvel's highest earning potential, with monthly revenues capable of climbing to $773, occupancy reaching a high of 41.8%, and ADRs peaking at $53.
- Conversely, the slowest single month of the year, typically falling within the low season, marks the market's lowest point. In this month, revenue might dip to $304, occupancy could drop to 24.6%, and ADRs may adjust down to $45.
- Understanding both the seasonal averages and these monthly peaks and troughs in revenue, occupancy, and ADR is crucial for maximizing your Airbnb profit potential in Panvel.
Seasonal Strategies for Maximizing Profit
- Peak Season: Maximize revenue through premium pricing and potentially longer minimum stays. Ensure high availability.
- Low Season: Offer competitive pricing, special promotions (e.g., extended stay discounts), and flexible cancellation policies. Target off-season travelers like remote workers or budget-conscious guests.
- Shoulder Seasons: Implement dynamic pricing that balances peak and low rates. Target weekend travelers or specific events. Offer slightly more flexible terms than peak season.
- Regularly analyze your own performance against these Panvel seasonality benchmarks and adjust your pricing and availability strategy accordingly.
Best Areas for Airbnb Investment in Panvel (2026)
Exploring the top neighborhoods for short-term rentals in Panvel? This section highlights key areas, outlining why they are attractive for hosts and guests, along with notable local attractions. Consider these locations based on your target guest profile and investment strategy.
| Neighborhood / Area | Why Host Here? (Target Guests & Appeal) | Key Attractions & Landmarks |
|---|---|---|
| Kharghar | A prime location in Navi Mumbai known for its scenic views, well-planned infrastructure, and proximity to educational institutions and corporate hubs. Ideal for families and tourists alike. | Kharghar Hills, ISKCON Kharghar, Golf Course, Chetana College, Pandavkada Falls |
| Panvel City Center | The bustling heart of Panvel with access to major train routes and local markets. Attracts business travelers and tourists looking for convenience and local flavor. | Panvel Railway Station, Baba Dahisar Dargah, Kalamboli Lake, Gurudwara, Mahalaxmi Mandir |
| Taloja | Emerging suburban area with affordable housing and quick connectivity to Mumbai. Popular among tech professionals and young renters looking for a quieter lifestyle. | Taloja Industrial Area, local parks, restaurants, shopping centers |
| Belapur | A growing corporate hub within Navi Mumbai, Belapur is ideal for business travelers due to its proximity to IT parks and commercial areas. | Navi Mumbai SEZ, Belapur Fort, Central Park, Belapur Railway Station, D Y Patil Stadium |
| Old Panvel | Rich in history and culture, Old Panvel offers traditional experiences with easy access to modern amenities, popular among tourists seeking authenticity. | Old Panvel Market, Radha Mandir, Mahatma Gandhi Mission, Shri Swaminarayan Mandir |
| Airoli | A fast-developing area with good transport links to Mumbai, making it attractive for both long-term renters and short-term stays. | Airoli Bridge, Ramseth Thakur International Sports Complex, local shopping centers, Siddhivinayak Temple |
| Navi Mumbai Airport | With the upcoming international airport, this area is set to be a major travel hub, making it a strategic investment location for future demand. | Navi Mumbai International Airport, upcoming malls, business parks |
| Dronagiri | Located near the Jawaharlal Nehru Port, Dronagiri is ideal for those visiting the port or the nearby industrial areas, popular with business travelers. | Jawaharlal Nehru Port Trust, local industrial zones, Dronagiri Park |
Understanding Airbnb License Requirements & STR Laws in Panvel (2026)
While Panvel, Maharashtra, India currently shows low STR regulations, specific Airbnb license requirements might still exist or change. Always verify the latest short term rental regulations and Airbnb license requirements directly with local government authorities for Panvel to ensure full compliance before hosting.
(Source: AirROI data, 2026, finding no licensed listings among those analyzed)
Top Performing Airbnb Properties in Panvel (2026)
Benchmark your potential! Explore examples of top-performing Airbnb properties in Panvelbased on Trailing Twelve Month (TTM) revenue. Analyze their characteristics, revenue, occupancy rate, and ADR to understand what drives success in this market.

Luxurious High-Rise Apartment Facing the Hills
Entire Place • 2 bedrooms
Luxury 4BHK Penthouse with Theatre & BBQ!
Entire Place • 4 bedrooms

Boho Nest near Tata Hospital & ISKON Temple
Entire Place • 1 bedroom

Zoey's Hill View-3BHK/120in 4k Cinema/Jacuzzi/Party
Entire Place • 3 bedrooms

The Aurum Haven
Entire Place • 2 bedrooms

Sea City Navi Mumbai
Entire Place • 3 bedrooms
Note: Performance varies based on location, size, amenities, seasonality, and management quality. Data reflects the past 12 months.
Top Performing Airbnb Hosts in Panvel (2026)
Learn from the best! This table showcases top-performing Airbnb hosts in Panvel based on the number of properties managed and estimated total revenue over the past year. Analyze their scale and performance metrics.
| Host Name | Properties | Grossing Revenue | Stay Reviews | Avg Rating |
|---|---|---|---|---|
| Flamingo City Stays | 2 | $43,642 | 108 | 4.89/5.0 |
| Nest And Rest | 1 | $8,614 | 75 | 4.96/5.0 |
| Vikas | 1 | $8,243 | 67 | 4.85/5.0 |
| Aakif | 1 | $8,136 | 108 | 4.81/5.0 |
| Kyna | 1 | $5,489 | 24 | 4.58/5.0 |
| Madhu | 2 | $3,777 | 55 | 4.86/5.0 |
| Abhishek | 1 | $3,743 | 7 | 4.71/5.0 |
| Arun | 3 | $1,924 | 47 | 4.94/5.0 |
| Dhanavath | 5 | $1,786 | 56 | 4.89/5.0 |
| Sourabh | 3 | $1,714 | 24 | 4.36/5.0 |
Analyzing the strategies of top hosts, such as their property selection, pricing, and guest communication, can offer valuable lessons for optimizing your own Airbnb operations in Panvel.
Dive Deeper: Advanced Panvel STR Market Data (2026)
Ready to unlock more insights? AirROI provides access to advanced metrics and comprehensive Airbnb data for Panvel. Explore detailed analytics beyond this report to refine your investment strategy, optimize pricing, and maximize your vacation rental profits.
Explore Advanced MetricsPanvel Short-Term Rental Market Composition (2026): Property & Room Types
Room Type Distribution
Property Type Distribution
Market Composition Insights for Panvel
- The Panvel Airbnb market composition is heavily skewed towards Entire Home/Apt listings, which make up 84.6% of the 26 active rentals. This indicates strong guest preference for privacy and space.
- Looking at the property type distribution in Panvel, Apartment/Condo properties are the most common (88.5%), reflecting the local real estate landscape.
Panvel Airbnb Room Capacity Analysis (2026): Bedroom Distribution
Distribution of Listings by Number of Bedrooms
Room Capacity Insights for Panvel
- The dominant room capacity in Panvel is 1 bedroom listings, making up 57.7% of the market. This suggests a strong demand for properties suitable for couples or solo travelers.
- Together, 1 bedroom and 2 bedrooms properties represent 73.1% of the active Airbnb listings in Panvel, indicating a high concentration in these sizes.
- With over half the market (57.7%) consisting of studios or 1-bedroom units, Panvel is particularly well-suited for individuals or couples.
Panvel Vacation Rental Guest Capacity Trends (2026)
Distribution of Listings by Guest Capacity
Guest Capacity Insights for Panvel
- The most common guest capacity trend in Panvel vacation rentals is listings accommodating 4 guests (30.8%). This suggests the primary traveler segment is likely small families or groups.
- Properties designed for 4 guests and 8+ guests dominate the Panvel STR market, accounting for 46.2% of listings.
- 23.1% of properties accommodate 6+ guests, serving the market segment for larger families or group travel in Panvel.
- On average, properties in Panvel are equipped to host 4.0 guests.
Panvel Airbnb Booking Patterns (2026): Available vs. Booked Days
Available Days Distribution
Booked Days Distribution
Booking Pattern Insights for Panvel
- The most common availability pattern in Panvel falls within the 271-366 days range, representing 73.1% of listings. This suggests many properties have significant open periods on their calendars.
- Approximately 92.3% of listings show high availability (181+ days open annually), indicating potential for increased bookings or specific owner usage patterns.
- For booked days, the 1-30 days range is most frequent in Panvel (38.5%), reflecting common guest stay durations or potential owner blocking patterns.
- A notable 7.6% of properties secure long booking periods (181+ days booked per year), highlighting successful long-term rental strategies or significant owner usage.
Panvel Airbnb Minimum Stay Requirements Analysis
Distribution of Listings by Minimum Night Requirement
1 Night
16 listings
61.5% of total
2 Nights
2 listings
7.7% of total
3 Nights
1 listings
3.8% of total
30+ Nights
7 listings
26.9% of total
Key Insights
- The most prevalent minimum stay requirement in Panvel is 1 Night, adopted by 61.5% of listings. This highlights the market's preference for shorter, flexible bookings.
- A strong majority (69.2%) of the Panvel Airbnb data shows acceptance of very short stays (1-2 nights), indicating a dynamic, high-turnover market.
- A significant segment (26.9%) caters to monthly stays (30+ nights) in Panvel, pointing to opportunities in the extended-stay market.
Recommendations
- Align with the market by considering a 1 Night minimum stay, as 61.5% of Panvel hosts use this setting.
- Explore offering discounts for stays of 30+ nights to attract the 26.9% of the market seeking extended stays.
- Adjust minimum nights based on seasonality – potentially shorter during low season and longer during peak demand periods in Panvel.
Panvel Airbnb Cancellation Policy Trends Analysis (2026)
Flexible
12 listings
46.2% of total
Moderate
9 listings
34.6% of total
Firm
4 listings
15.4% of total
Strict
1 listings
3.8% of total
Cancellation Policy Insights for Panvel
- The prevailing Airbnb cancellation policy trend in Panvel is Flexible, used by 46.2% of listings.
- The market strongly favors guest-friendly terms, with 80.8% of listings offering Flexible or Moderate policies. This suggests guests in Panvel may expect booking flexibility.
- Strict cancellation policies are quite rare (3.8%), potentially making listings with this policy less competitive unless justified by high demand or property type.
Recommendations for Hosts
- Consider adopting a Flexible policy to align with the 46.2% market standard in Panvel.
- Using a Strict policy might deter some guests, as only 3.8% of listings use it. Evaluate if potential revenue protection outweighs possible lower booking rates.
- Regularly review your cancellation policy against competitors and market demand shifts in Panvel.
Panvel STR Booking Lead Time Analysis (2026)
Average Booking Lead Time by Month
Booking Lead Time Insights for Panvel
- The overall average booking lead time for vacation rentals in Panvel is 17 days.
- Guests book furthest in advance for stays during January (average 29 days), likely coinciding with peak travel demand or local events.
- The shortest booking windows occur for stays in June (average 5 days), indicating more last-minute travel plans during this time.
- Seasonally, Winter (17 days avg.) sees the longest lead times, while Spring (11 days avg.) has the shortest, reflecting typical travel planning cycles.
Recommendations for Hosts
- Use the overall average lead time (17 days) as a baseline for your pricing and availability strategy in Panvel.
- For January stays, consider implementing length-of-stay discounts or slightly higher rates for bookings made less than 29 days out to capitalize on advance planning.
- During June, focus on last-minute booking availability and promotions, as guests book with very short notice (5 days avg.).
- Target marketing efforts for the Winter season well in advance (at least 17 days) to capture early planners.
- Monitor your own booking lead times against these Panvel averages to identify opportunities for dynamic pricing adjustments.
Popular & Essential Airbnb Amenities in Panvel (2026)
Amenity Prevalence
Amenity Insights for Panvel
- Essential amenities in Panvel that guests expect include: Wifi, Kitchen. Lacking these (any) could significantly impact bookings.
- Popular amenities like Air conditioning, Dedicated workspace, Cooking basics are common but not universal. Offering these can provide a competitive edge.
Recommendations for Hosts
- Ensure your listing includes all essential amenities for Panvel: Wifi, Kitchen.
- Consider adding popular differentiators like Air conditioning or Dedicated workspace to increase appeal.
- Highlight unique or less common amenities you offer (e.g., hot tub, dedicated workspace, EV charger) in your listing description and photos.
- Regularly check competitor amenities in Panvel to stay competitive.
Panvel Airbnb Guest Demographics & Profile Analysis (2026)
Guest Profile Summary for Panvel
- The typical guest profile for Airbnb in Panvel consists of primarily domestic travelers (76%), often arriving from nearby Mumbai, typically belonging to the Post-2000s (Gen Z/Alpha) group (50%), primarily speaking English or Hindi.
- Domestic travelers account for 75.6% of guests.
- Key international markets include India (75.6%) and United States (4.9%).
- Top languages spoken are English (47.2%) followed by Hindi (35.8%).
- A significant demographic segment is the Post-2000s (Gen Z/Alpha) group, representing 50% of guests.
Recommendations for Hosts
- Target domestic marketing efforts towards travelers from Mumbai and Hyderabad.
- Tailor amenities and listing descriptions to appeal to the dominant Post-2000s (Gen Z/Alpha) demographic (e.g., highlight fast WiFi, smart home features, local guides).
- Highlight unique local experiences or amenities relevant to the primary guest profile.
- Consider seasonal promotions aligned with peak travel times for key origin markets.
Nearby Short-Term Rental Market Comparison
How does the Panvel Airbnb market stack up against its neighbors? Compare key performance metrics like average monthly revenue, ADR, and occupancy rates in surrounding areas to understand the broader regional STR landscape.
| Market | Active Properties | Monthly Revenue | Daily Rate | Avg. Occupancy |
|---|---|---|---|---|
| Chondhi | 15 | $2,777 | $349.15 | 29% |
| Kihim | 11 | $2,317 | $296.88 | 27% |
| Gevhande Apati | 10 | $2,224 | $348.25 | 25% |
| Mahagaon | 12 | $1,989 | $268.55 | 33% |
| Chondi | 42 | $1,484 | $250.47 | 27% |
| Pimpari | 12 | $1,446 | $304.98 | 19% |
| Dhalewadi | 10 | $1,240 | $124.55 | 33% |
| Khandala | 25 | $1,229 | $250.56 | 24% |
| Awas | 26 | $1,128 | $233.10 | 22% |
| Waksai | 46 | $1,003 | $161.82 | 26% |