Malavli Airbnb Market Analysis 2026: Short Term Rental Data & Vacation Rental Statistics in Maharashtra, India
Is Airbnb profitable in Malavli in 2026? Explore comprehensive Airbnb analytics for Malavli, Maharashtra, India to uncover income potential. This 2026 STR market report for Malavli, based on AirROI data from February 2025 to January 2026, reveals key trends in the niche market of 80 active listings.
Whether you're considering an Airbnb investment in Malavli, optimizing your existing vacation rental, or exploring rental arbitrage opportunities, understanding the Malavli Airbnb data is crucial. Leveraging the low regulation environment is key to maximizing your short term rental income potential. Let's dive into the specifics.
Key Malavli Airbnb Performance Metrics Overview
Monthly Airbnb Revenue Variations & Income Potential in Malavli (2026)
Understanding the monthly revenue variations for Airbnb listings in Malavli is key to maximizing your short term rental income potential. Seasonality significantly impacts earnings. Our analysis, based on data from the past 12 months, shows that the peak revenue month for STRs in Malavli is typically July, while January often presents the lowest earnings, highlighting opportunities for strategic pricing adjustments during shoulder and low seasons. Explore the typical Airbnb income in Malavli across different performance tiers:
- Best-in-class properties (Top 10%) achieve $2,597+ monthly, often utilizing dynamic pricing and superior guest experiences.
- Strong performing properties (Top 25%) earn $1,455 or more, indicating effective management and desirable locations/amenities.
- Typical properties (Median) generate around $672 per month, representing the average market performance.
- Entry-level properties (Bottom 25%) see earnings around $270, often with potential for optimization.
Average Monthly Airbnb Earnings Trend in Malavli
Malavli Airbnb Occupancy Rate Trends (2026)
Maximize your bookings by understanding the Malavli STR occupancy trends. Seasonal demand shifts significantly influence how often properties are booked. Typically, Aprilsees the highest demand (peak season occupancy), while January experiences the lowest (low season). Effective strategies, like adjusting minimum stays or offering promotions, can boost occupancy during slower periods. Here's how different property tiers perform in Malavli:
- Best-in-class properties (Top 10%) achieve 46%+ occupancy, indicating high desirability and potentially optimized availability.
- Strong performing properties (Top 25%) maintain 30% or higher occupancy, suggesting good market fit and guest satisfaction.
- Typical properties (Median) have an occupancy rate around 16%.
- Entry-level properties (Bottom 25%) average 8% occupancy, potentially facing higher vacancy.
Average Monthly Occupancy Rate Trend in Malavli
Average Daily Rate (ADR) Airbnb Trends in Malavli (2026)
Effective short term rental pricing strategy in Malavli involves understanding monthly ADR fluctuations. The Average Daily Rate (ADR) for Airbnb in Malavli typically peaks in June and dips lowest during September. Leveraging Airbnb dynamic pricing tools or strategies based on this seasonality can significantly boost revenue. Here's a look at the typical nightly rates achieved:
- Best-in-class properties (Top 10%) command rates of $277+ per night, often due to premium features or locations.
- Strong performing properties (Top 25%) achieve nightly rates of $199 or more.
- Typical properties (Median) charge around $129 per night.
- Entry-level properties (Bottom 25%) earn around $76 per night.
Average Daily Rate (ADR) Trend by Month in Malavli
Get Live Malavli Market Intelligence 👇

Explore Real-time Analytics
Airbnb Seasonality Analysis & Trends in Malavli (2026)
Peak Season (July, April, May)
- Revenue averages $1,383 per month
- Occupancy rates average 26.6%
- Daily rates average $191
Shoulder Season
- Revenue averages $1,115 per month
- Occupancy maintains around 22.5%
- Daily rates hold near $171
Low Season (January, February, November)
- Revenue drops to average $836 per month
- Occupancy decreases to average 18.4%
- Daily rates adjust to average $156
Seasonality Insights for Malavli
- The Airbnb seasonality in Malavli shows moderate seasonality with distinct peak and low periods. While the sections above show seasonal averages, it's also insightful to look at the extremes:
- During the high season, the absolute peak month showcases Malavli's highest earning potential, with monthly revenues capable of climbing to $1,473, occupancy reaching a high of 27.2%, and ADRs peaking at $195.
- Conversely, the slowest single month of the year, typically falling within the low season, marks the market's lowest point. In this month, revenue might dip to $719, occupancy could drop to 14.4%, and ADRs may adjust down to $138.
- Understanding both the seasonal averages and these monthly peaks and troughs in revenue, occupancy, and ADR is crucial for maximizing your Airbnb profit potential in Malavli.
Seasonal Strategies for Maximizing Profit
- Peak Season: Maximize revenue through premium pricing and potentially longer minimum stays. Ensure high availability.
- Low Season: Offer competitive pricing, special promotions (e.g., extended stay discounts), and flexible cancellation policies. Target off-season travelers like remote workers or budget-conscious guests.
- Shoulder Seasons: Implement dynamic pricing that balances peak and low rates. Target weekend travelers or specific events. Offer slightly more flexible terms than peak season.
- Regularly analyze your own performance against these Malavli seasonality benchmarks and adjust your pricing and availability strategy accordingly.
Best Areas for Airbnb Investment in Malavli (2026)
Exploring the top neighborhoods for short-term rentals in Malavli? This section highlights key areas, outlining why they are attractive for hosts and guests, along with notable local attractions. Consider these locations based on your target guest profile and investment strategy.
| Neighborhood / Area | Why Host Here? (Target Guests & Appeal) | Key Attractions & Landmarks |
|---|---|---|
| Lonavala | Popular hill station known for its lush greenery and pleasant climate. Ideal for families and couples seeking a retreat from the city with many luxury resorts and local attractions. | Lonavala Lake, Bhushi Dam, Karla Caves, Lion's Point, Della Adventure Park, Celebrity Wax Museum |
| Khandala | Adjacent to Lonavala, Khandala offers stunning views and less crowded scenic spots. This area is perfect for travelers looking for peace and tranquility amidst nature. | Khandala Point, Duke's Nose, Bushy Dam, Tiger's Leap, Shooting Point, Bhushi Lake |
| Malavli Station | A quieter place near Lonavala and Khandala, popular for vacation homes and weekend getaways, catering to travelers looking for a more peaceful stay. | Aamby Valley City, Bhira Dam, Ghangad Fort, Devkund Waterfall, Bhimashankar Wildlife Sanctuary |
| Pawna Lake | Famous for camping and outdoor activities, Pawna Lake attracts tourists looking for unique stays by the water, including tent stays and luxury villas. | Pawna Lake Camping, Tung Fort, Tikona Fort, Lakeside activities, Sunset views |
| Tiger's Leap | Known for its panoramic views and adventure activities, this spot attracts thrill-seekers looking for natural beauty and outdoor fun. | Tiger's Leap viewpoint, Adventure activities, Hiking trails, Scenic viewpoints |
| Bhushi Dam | A popular spot for its waterfall during monsoons, Bhushi Dam offers a scenic retreat and is favored by families and friends looking to enjoy nature. | Bhushi Waterfall, Picnic spots, Water activities, Local eateries |
| Karla Caves | Significant historical sites featuring ancient Buddhist rock-cut caves, attracting both history buffs and tourists interested in cultural experiences. | Karla Caves, Buddhist architecture, Scenic hikes, Local markets around Karla |
| Pawna Dam | Known for its serene landscapes and peaceful environment, Pawna Dam is gaining popularity among those looking for a retreat and is an emerging spot for weekend getaways. | Dam views, Quiet environment, Fishing and boating, Nature walks |
Understanding Airbnb License Requirements & STR Laws in Malavli (2026)
While Malavli, Maharashtra, India currently shows low STR regulations, specific Airbnb license requirements might still exist or change. Always verify the latest short term rental regulations and Airbnb license requirements directly with local government authorities for Malavli to ensure full compliance before hosting.
(Source: AirROI data, 2026, finding no licensed listings among those analyzed)
Top Performing Airbnb Properties in Malavli (2026)
Benchmark your potential! Explore examples of top-performing Airbnb properties in Malavlibased on Trailing Twelve Month (TTM) revenue. Analyze their characteristics, revenue, occupancy rate, and ADR to understand what drives success in this market.
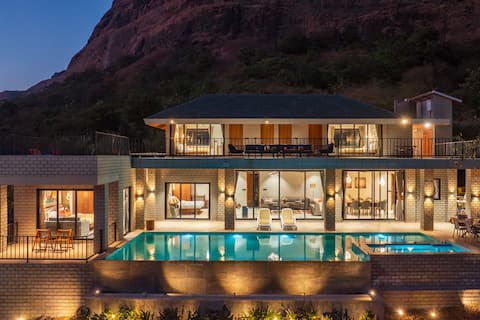
Esperanza 5BR w/ Private Pool & Turf and games
Entire Place • 5 bedrooms

Monarch 6BR Villa Late night party hall & Turf
Entire Place • 6 bedrooms
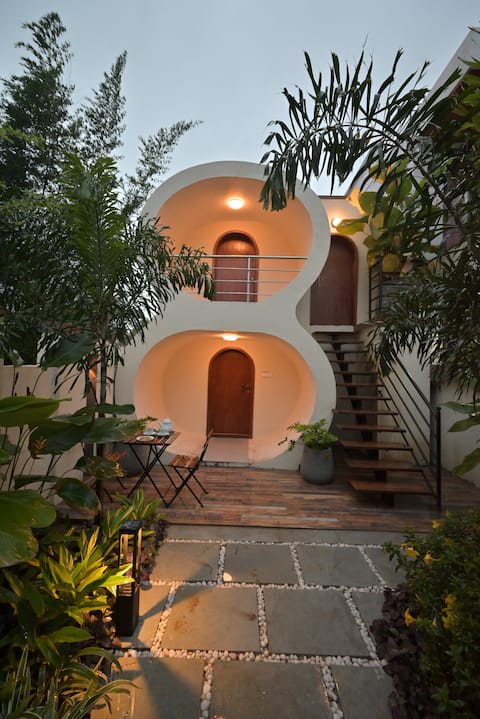
Twist And Tales (Luxury Suite Couple Villa)
Entire Place • 1 bedroom
4BHK - Hiaana Villa By Tropicana Stays
Entire Place • 4 bedrooms
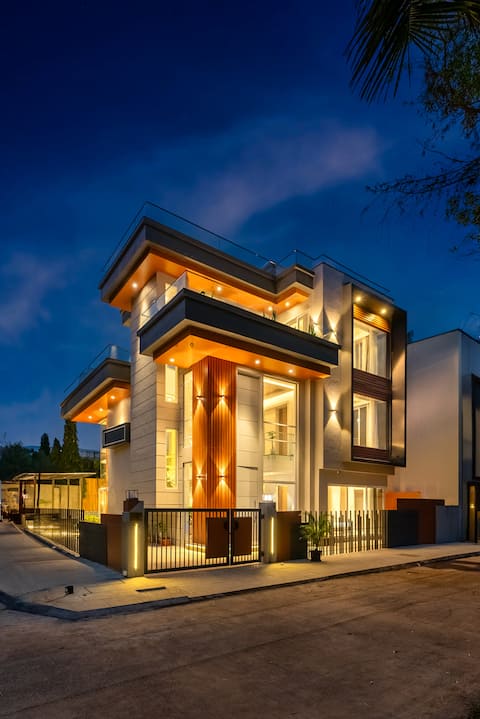
Maison 6BHK by Stayscape Full AC Villa in Lonavala
Entire Place • 6 bedrooms

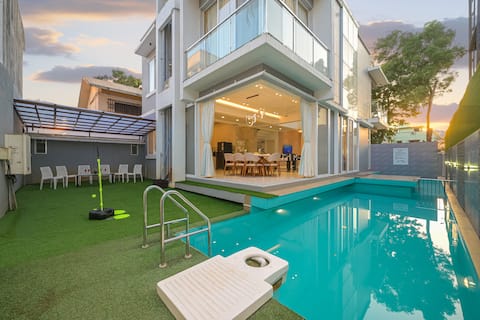
Mountain Villa in Lonavala with Inifinity Pool
Entire Place • 3 bedrooms
Note: Performance varies based on location, size, amenities, seasonality, and management quality. Data reflects the past 12 months.
Top Performing Airbnb Hosts in Malavli (2026)
Learn from the best! This table showcases top-performing Airbnb hosts in Malavli based on the number of properties managed and estimated total revenue over the past year. Analyze their scale and performance metrics.
| Host Name | Properties | Grossing Revenue | Stay Reviews | Avg Rating |
|---|---|---|---|---|
| Linsy | 2 | $88,205 | 7 | 4.40/5.0 |
| Harshal | 3 | $70,164 | 27 | 4.47/5.0 |
| Hanumanji | 2 | $54,959 | 189 | 4.75/5.0 |
| Priyanka | 1 | $47,265 | 9 | 4.89/5.0 |
| Reena | 3 | $36,575 | 23 | 4.51/5.0 |
| Stayscape | 1 | $31,111 | 3 | 5.00/5.0 |
| Soyab | 1 | $23,720 | 118 | 4.71/5.0 |
| Akshay | 1 | $23,193 | 19 | 4.53/5.0 |
| Aanam | 1 | $20,983 | 96 | 4.33/5.0 |
| Vijay | 6 | $20,111 | 67 | 3.83/5.0 |
Analyzing the strategies of top hosts, such as their property selection, pricing, and guest communication, can offer valuable lessons for optimizing your own Airbnb operations in Malavli.
Dive Deeper: Advanced Malavli STR Market Data (2026)
Ready to unlock more insights? AirROI provides access to advanced metrics and comprehensive Airbnb data for Malavli. Explore detailed analytics beyond this report to refine your investment strategy, optimize pricing, and maximize your vacation rental profits.
Explore Advanced MetricsMalavli Short-Term Rental Market Composition (2026): Property & Room Types
Room Type Distribution
Property Type Distribution
Market Composition Insights for Malavli
- The Malavli Airbnb market composition is heavily skewed towards Entire Home/Apt listings, which make up 93.8% of the 80 active rentals. This indicates strong guest preference for privacy and space.
- Looking at the property type distribution in Malavli, House properties are the most common (81.3%), reflecting the local real estate landscape.
- Houses represent a significant 81.3% portion, catering likely to families or larger groups.
- Smaller segments like outdoor/unique, hotel/boutique (combined 5.0%) offer potential for unique stay experiences.
Malavli Airbnb Room Capacity Analysis (2026): Bedroom Distribution
Distribution of Listings by Number of Bedrooms
Room Capacity Insights for Malavli
- The dominant room capacity in Malavli is 3 bedrooms listings, making up 28.7% of the market. This suggests a strong demand for properties suitable for families or small groups.
- Together, 3 bedrooms and 4 bedrooms properties represent 51.2% of the active Airbnb listings in Malavli, indicating a high concentration in these sizes.
- A significant 67.5% of listings offer 3+ bedrooms, catering to larger groups and families seeking more space in Malavli.
Malavli Vacation Rental Guest Capacity Trends (2026)
Distribution of Listings by Guest Capacity
Guest Capacity Insights for Malavli
- The most common guest capacity trend in Malavli vacation rentals is listings accommodating 8+ guests (72.5%). This suggests the primary traveler segment is likely larger groups.
- Properties designed for 8+ guests and 6 guests dominate the Malavli STR market, accounting for 86.3% of listings.
- 87.6% of properties accommodate 6+ guests, serving the market segment for larger families or group travel in Malavli.
- On average, properties in Malavli are equipped to host 7.0 guests.
Malavli Airbnb Booking Patterns (2026): Available vs. Booked Days
Available Days Distribution
Booked Days Distribution
Booking Pattern Insights for Malavli
- The most common availability pattern in Malavli falls within the 271-366 days range, representing 81.3% of listings. This suggests many properties have significant open periods on their calendars.
- Approximately 98.8% of listings show high availability (181+ days open annually), indicating potential for increased bookings or specific owner usage patterns.
- For booked days, the 31-90 days range is most frequent in Malavli (42.5%), reflecting common guest stay durations or potential owner blocking patterns.
- A notable 1.3% of properties secure long booking periods (181+ days booked per year), highlighting successful long-term rental strategies or significant owner usage.
Malavli Airbnb Minimum Stay Requirements Analysis
Distribution of Listings by Minimum Night Requirement
1 Night
80 listings
100% of total
Key Insights
- The most prevalent minimum stay requirement in Malavli is 1 Night, adopted by 100% of listings. This highlights the market's preference for shorter, flexible bookings.
- A strong majority (100.0%) of the Malavli Airbnb data shows acceptance of very short stays (1-2 nights), indicating a dynamic, high-turnover market.
Recommendations
- Align with the market by considering a 1 Night minimum stay, as 100% of Malavli hosts use this setting.
- Adjust minimum nights based on seasonality – potentially shorter during low season and longer during peak demand periods in Malavli.
Malavli Airbnb Cancellation Policy Trends Analysis (2026)
Super Strict 30 Days
2 listings
2.5% of total
Limited
2 listings
2.5% of total
Flexible
19 listings
23.8% of total
Moderate
18 listings
22.5% of total
Firm
30 listings
37.5% of total
Strict
9 listings
11.3% of total
Cancellation Policy Insights for Malavli
- The prevailing Airbnb cancellation policy trend in Malavli is Firm, used by 37.5% of listings.
- There's a relatively balanced mix between guest-friendly (46.3%) and stricter (48.8%) policies, offering choices for different guest needs.
Recommendations for Hosts
- Consider adopting a Firm policy to align with the 37.5% market standard in Malavli.
- Using a Strict policy might deter some guests, as only 11.3% of listings use it. Evaluate if potential revenue protection outweighs possible lower booking rates.
- Regularly review your cancellation policy against competitors and market demand shifts in Malavli.
Malavli STR Booking Lead Time Analysis (2026)
Average Booking Lead Time by Month
Booking Lead Time Insights for Malavli
- The overall average booking lead time for vacation rentals in Malavli is 20 days.
- Guests book furthest in advance for stays during October (average 28 days), likely coinciding with peak travel demand or local events.
- The shortest booking windows occur for stays in March (average 9 days), indicating more last-minute travel plans during this time.
- Seasonally, Fall (25 days avg.) sees the longest lead times, while Spring (12 days avg.) has the shortest, reflecting typical travel planning cycles.
Recommendations for Hosts
- Use the overall average lead time (20 days) as a baseline for your pricing and availability strategy in Malavli.
- During March, focus on last-minute booking availability and promotions, as guests book with very short notice (9 days avg.).
- Target marketing efforts for the Fall season well in advance (at least 25 days) to capture early planners.
- Monitor your own booking lead times against these Malavli averages to identify opportunities for dynamic pricing adjustments.
Popular & Essential Airbnb Amenities in Malavli (2026)
Amenity Prevalence
Amenity Insights for Malavli
- Essential amenities in Malavli that guests expect include: Free parking on premises. Lacking these (this) could significantly impact bookings.
- Popular amenities like Air conditioning, TV, Pool are common but not universal. Offering these can provide a competitive edge.
- A pool is a highly desired but not standard amenity, making it a key feature for attracting guests seeking leisure in Malavli.
- Warning: Wifi is not universally provided but is considered essential globally. Ensure reliable Wifi is offered.
Recommendations for Hosts
- Ensure your listing includes all essential amenities for Malavli: Free parking on premises.
- Consider adding popular differentiators like Air conditioning or TV to increase appeal.
- Highlight unique or less common amenities you offer (e.g., hot tub, dedicated workspace, EV charger) in your listing description and photos.
- Regularly check competitor amenities in Malavli to stay competitive.
Malavli Airbnb Guest Demographics & Profile Analysis (2026)
Guest Profile Summary for Malavli
- The typical guest profile for Airbnb in Malavli consists of primarily domestic travelers (91%), often arriving from nearby Mumbai, typically belonging to the Post-2000s (Gen Z/Alpha) group (50%), primarily speaking English or Hindi.
- Domestic travelers account for 90.5% of guests.
- Key international markets include India (90.5%) and United States (5.7%).
- Top languages spoken are English (46.1%) followed by Hindi (39.1%).
- A significant demographic segment is the Post-2000s (Gen Z/Alpha) group, representing 50% of guests.
Recommendations for Hosts
- Target domestic marketing efforts towards travelers from Mumbai and Pune.
- Tailor amenities and listing descriptions to appeal to the dominant Post-2000s (Gen Z/Alpha) demographic (e.g., highlight fast WiFi, smart home features, local guides).
- Highlight unique local experiences or amenities relevant to the primary guest profile.
- Consider seasonal promotions aligned with peak travel times for key origin markets.
Nearby Short-Term Rental Market Comparison
How does the Malavli Airbnb market stack up against its neighbors? Compare key performance metrics like average monthly revenue, ADR, and occupancy rates in surrounding areas to understand the broader regional STR landscape.
| Market | Active Properties | Monthly Revenue | Daily Rate | Avg. Occupancy |
|---|---|---|---|---|
| Chondhi | 15 | $2,777 | $349.15 | 29% |
| Kihim | 11 | $2,317 | $296.88 | 27% |
| Gevhande Apati | 10 | $2,224 | $348.25 | 25% |
| Mahagaon | 12 | $1,989 | $268.55 | 33% |
| Chondi | 42 | $1,484 | $250.47 | 27% |
| Pimpari | 12 | $1,446 | $304.98 | 19% |
| Dhalewadi | 10 | $1,240 | $124.55 | 33% |
| Khandala | 25 | $1,229 | $250.56 | 24% |
| Awas | 26 | $1,128 | $233.10 | 22% |
| Waksai | 46 | $1,003 | $161.82 | 26% |