Kurul Airbnb Market Analysis 2026: Short Term Rental Data & Vacation Rental Statistics in Maharashtra, India
Is Airbnb profitable in Kurul in 2026? Explore comprehensive Airbnb analytics for Kurul, Maharashtra, India to uncover income potential. This 2026 STR market report for Kurul, based on AirROI data from February 2025 to January 2026, reveals key trends in the niche market of 21 active listings.
Whether you're considering an Airbnb investment in Kurul, optimizing your existing vacation rental, or exploring rental arbitrage opportunities, understanding the Kurul Airbnb data is crucial. Leveraging the low regulation environment is key to maximizing your short term rental income potential. Let's dive into the specifics.
Key Kurul Airbnb Performance Metrics Overview
Monthly Airbnb Revenue Variations & Income Potential in Kurul (2026)
Understanding the monthly revenue variations for Airbnb listings in Kurul is key to maximizing your short term rental income potential. Seasonality significantly impacts earnings. Our analysis, based on data from the past 12 months, shows that the peak revenue month for STRs in Kurul is typically March, while September often presents the lowest earnings, highlighting opportunities for strategic pricing adjustments during shoulder and low seasons. Explore the typical Airbnb income in Kurul across different performance tiers:
- Best-in-class properties (Top 10%) achieve $4,922+ monthly, often utilizing dynamic pricing and superior guest experiences.
- Strong performing properties (Top 25%) earn $1,843 or more, indicating effective management and desirable locations/amenities.
- Typical properties (Median) generate around $822 per month, representing the average market performance.
- Entry-level properties (Bottom 25%) see earnings around $211, often with potential for optimization.
Average Monthly Airbnb Earnings Trend in Kurul
Kurul Airbnb Occupancy Rate Trends (2026)
Maximize your bookings by understanding the Kurul STR occupancy trends. Seasonal demand shifts significantly influence how often properties are booked. Typically, Novembersees the highest demand (peak season occupancy), while September experiences the lowest (low season). Effective strategies, like adjusting minimum stays or offering promotions, can boost occupancy during slower periods. Here's how different property tiers perform in Kurul:
- Best-in-class properties (Top 10%) achieve 59%+ occupancy, indicating high desirability and potentially optimized availability.
- Strong performing properties (Top 25%) maintain 40% or higher occupancy, suggesting good market fit and guest satisfaction.
- Typical properties (Median) have an occupancy rate around 22%.
- Entry-level properties (Bottom 25%) average 12% occupancy, potentially facing higher vacancy.
Average Monthly Occupancy Rate Trend in Kurul
Average Daily Rate (ADR) Airbnb Trends in Kurul (2026)
Effective short term rental pricing strategy in Kurul involves understanding monthly ADR fluctuations. The Average Daily Rate (ADR) for Airbnb in Kurul typically peaks in March and dips lowest during July. Leveraging Airbnb dynamic pricing tools or strategies based on this seasonality can significantly boost revenue. Here's a look at the typical nightly rates achieved:
- Best-in-class properties (Top 10%) command rates of $1,039+ per night, often due to premium features or locations.
- Strong performing properties (Top 25%) achieve nightly rates of $286 or more.
- Typical properties (Median) charge around $91 per night.
- Entry-level properties (Bottom 25%) earn around $35 per night.
Average Daily Rate (ADR) Trend by Month in Kurul
Get Live Kurul Market Intelligence 👇

Explore Real-time Analytics
Airbnb Seasonality Analysis & Trends in Kurul (2026)
Peak Season (March, April, May)
- Revenue averages $2,708 per month
- Occupancy rates average 31.1%
- Daily rates average $306
Shoulder Season
- Revenue averages $1,594 per month
- Occupancy maintains around 25.3%
- Daily rates hold near $291
Low Season (September, November, December)
- Revenue drops to average $1,003 per month
- Occupancy decreases to average 28.3%
- Daily rates adjust to average $298
Seasonality Insights for Kurul
- The Airbnb seasonality in Kurul shows highly seasonal trends requiring careful strategy. While the sections above show seasonal averages, it's also insightful to look at the extremes:
- During the high season, the absolute peak month showcases Kurul's highest earning potential, with monthly revenues capable of climbing to $3,091, occupancy reaching a high of 36.0%, and ADRs peaking at $320.
- Conversely, the slowest single month of the year, typically falling within the low season, marks the market's lowest point. In this month, revenue might dip to $664, occupancy could drop to 14.7%, and ADRs may adjust down to $270.
- Understanding both the seasonal averages and these monthly peaks and troughs in revenue, occupancy, and ADR is crucial for maximizing your Airbnb profit potential in Kurul.
Seasonal Strategies for Maximizing Profit
- Peak Season: Maximize revenue through premium pricing and potentially longer minimum stays. Ensure high availability.
- Low Season: Offer competitive pricing, special promotions (e.g., extended stay discounts), and flexible cancellation policies. Target off-season travelers like remote workers or budget-conscious guests.
- Shoulder Seasons: Implement dynamic pricing that balances peak and low rates. Target weekend travelers or specific events. Offer slightly more flexible terms than peak season.
- Regularly analyze your own performance against these Kurul seasonality benchmarks and adjust your pricing and availability strategy accordingly.
Best Areas for Airbnb Investment in Kurul (2026)
Exploring the top neighborhoods for short-term rentals in Kurul? This section highlights key areas, outlining why they are attractive for hosts and guests, along with notable local attractions. Consider these locations based on your target guest profile and investment strategy.
| Neighborhood / Area | Why Host Here? (Target Guests & Appeal) | Key Attractions & Landmarks |
|---|---|---|
| Alibaug | A popular beach destination near Mumbai known for its beautiful coastline and luxurious villas. It's a prime spot for weekend getaways and attracts families and tourists looking for a coastal retreat. | Alibaug Beach, Kankeshwar Temple, Kolaba Fort, Varsoli Beach, Chaul, Mandwa Beach |
| Lonavala | Famous hill station near Mumbai and Pune, known for its scenic views and pleasant climate. It's a favorite destination for travelers seeking tranquility in nature, especially during the monsoon. | Bhushi Dam, Lion's Point, Lonavala Lake, Karla Caves, Rajmachi Fort |
| Mahabaleshwar | A scenic hill station known for its lush greenery, strawberry farms, and panoramic views. It offers a cooler climate, making it perfect for families and couples. | Arthur's Seat, Venna Lake, Mahabaleshwar Temple, Lingmala Waterfall, Pratapgad Fort |
| Panchgani | Nearby hill station famous for its stunning Table Land and educational institutions. It attracts tourists looking for peaceful retreats in nature. | Table Land, Panchgani Market, Sydney Point, Devil's Kitchen, Bhilar Waterfall |
| Dapoli | Known as the 'Mahabaleshwar of the Coast', it features beautiful beaches, lush vegetation, and historical forts. It appeals to beach lovers and history enthusiasts alike. | Karde Beach, Anjarle Beach, Dapoli Fort, Harnai Beach, Murud Beach |
| Khandala | A hill station that is comparatively tranquil yet very close to the hustle of Lonavala, it's a perfect escape for those who want to enjoy the scenic beauty without too much crowd. | Khandala Point, Duke's Nose, Tiger's Leap, Bushy Dam |
| Matheran | A small hill station known for its lush greenery and colonial architecture. A unique experience as it's an automobile-free zone, making it great for family and nature retreats. | Panorama Point, Charlotte Lake, Matheran Toys Train, Market Area |
| Kolhapur | Rich in culture and history, Kolhapur is known for its ancient temples, delicious cuisine, and traditional handicrafts. It attracts tourists interested in heritage and culture. | Mahalaxmi Temple, Panhala Fort, Jyotiba Temple, Rankala Lake, Kolhapur Chappal |
Understanding Airbnb License Requirements & STR Laws in Kurul (2026)
While Kurul, Maharashtra, India currently shows low STR regulations, specific Airbnb license requirements might still exist or change. Always verify the latest short term rental regulations and Airbnb license requirements directly with local government authorities for Kurul to ensure full compliance before hosting.
(Source: AirROI data, 2026, finding no licensed listings among those analyzed)
Top Performing Airbnb Properties in Kurul (2026)
Benchmark your potential! Explore examples of top-performing Airbnb properties in Kurulbased on Trailing Twelve Month (TTM) revenue. Analyze their characteristics, revenue, occupancy rate, and ADR to understand what drives success in this market.
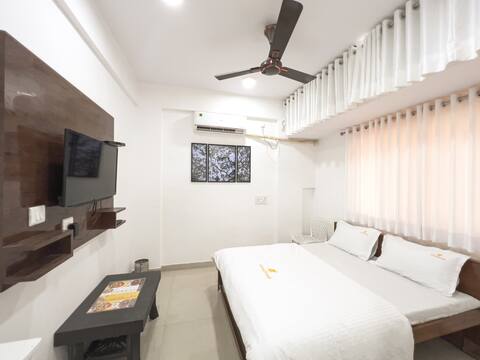
Ekakshar Rooms #3, Alibag
Private Room • 1 bedroom
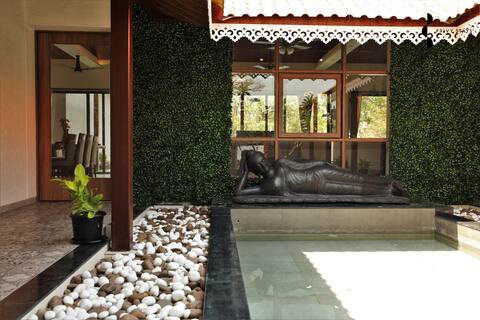
Privy Stays- JK's w/Pool Pet-F'ndly & Pool-Table
Entire Place • 5 bedrooms

LuxeVilla W/Pool & Indoor Fun- AmaraVilla @Alibaug
Entire Place • 6 bedrooms

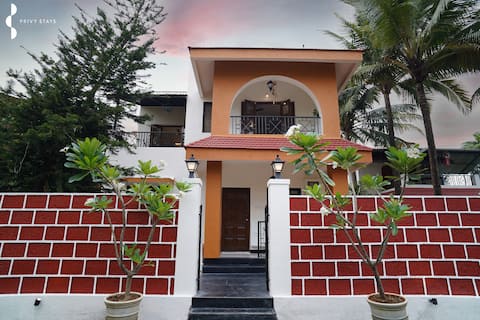
Privy Stays- Vintage Charm, Alibag- 4bhk Pvt Villa
Entire Place • 4 bedrooms
Privy Stays- Reed Field Villa, Alibag
Entire Place • 4 bedrooms
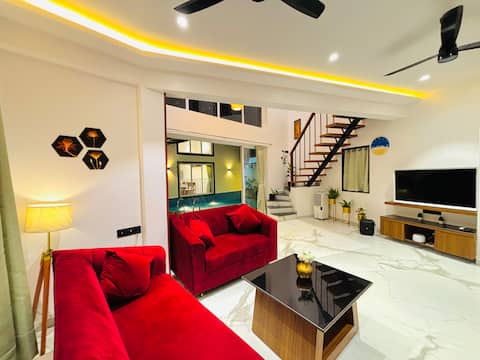
The White Villaa 4BHK private pool villa
Entire Place • 4 bedrooms
Note: Performance varies based on location, size, amenities, seasonality, and management quality. Data reflects the past 12 months.
Top Performing Airbnb Hosts in Kurul (2026)
Learn from the best! This table showcases top-performing Airbnb hosts in Kurul based on the number of properties managed and estimated total revenue over the past year. Analyze their scale and performance metrics.
| Host Name | Properties | Grossing Revenue | Stay Reviews | Avg Rating |
|---|---|---|---|---|
| Ankush | 1 | $61,936 | 13 | 4.23/5.0 |
| Privy Stays | 1 | $46,363 | 46 | 4.87/5.0 |
| Neha | 1 | $44,967 | 2 | Not Rated |
| Arunkumar | 3 | $38,461 | 164 | 4.76/5.0 |
| Privy Stays | 4 | $16,042 | 279 | 4.75/5.0 |
| Manish | 4 | $15,555 | 72 | 4.55/5.0 |
| Ali | 1 | $12,613 | 20 | 4.05/5.0 |
| Shripad | 1 | $12,101 | 29 | 4.48/5.0 |
| Getaway Villas | 1 | $1,330 | 3 | 5.00/5.0 |
| Priyesh | 1 | $1,011 | 1 | Not Rated |
Analyzing the strategies of top hosts, such as their property selection, pricing, and guest communication, can offer valuable lessons for optimizing your own Airbnb operations in Kurul.
Dive Deeper: Advanced Kurul STR Market Data (2026)
Ready to unlock more insights? AirROI provides access to advanced metrics and comprehensive Airbnb data for Kurul. Explore detailed analytics beyond this report to refine your investment strategy, optimize pricing, and maximize your vacation rental profits.
Explore Advanced MetricsKurul Short-Term Rental Market Composition (2026): Property & Room Types
Room Type Distribution
Property Type Distribution
Market Composition Insights for Kurul
- The Kurul Airbnb market composition is heavily skewed towards Entire Home/Apt listings, which make up 57.1% of the 21 active rentals. This indicates strong guest preference for privacy and space.
- However, a notable 38.1% share for Private Rooms suggests opportunities for budget-conscious travelers or hosts renting out spare rooms.
- Looking at the property type distribution in Kurul, House properties are the most common (52.4%), reflecting the local real estate landscape.
- Houses represent a significant 52.4% portion, catering likely to families or larger groups.
- The presence of 19% Hotel/Boutique listings indicates integration with traditional hospitality.
- Smaller segments like others (combined 4.8%) offer potential for unique stay experiences.
Kurul Airbnb Room Capacity Analysis (2026): Bedroom Distribution
Distribution of Listings by Number of Bedrooms
Room Capacity Insights for Kurul
- The dominant room capacity in Kurul is 1 bedroom listings, making up 28.6% of the market. This suggests a strong demand for properties suitable for couples or solo travelers.
- Together, 1 bedroom and 5+ bedrooms properties represent 47.6% of the active Airbnb listings in Kurul, indicating a high concentration in these sizes.
- A significant 47.6% of listings offer 3+ bedrooms, catering to larger groups and families seeking more space in Kurul.
Kurul Vacation Rental Guest Capacity Trends (2026)
Distribution of Listings by Guest Capacity
Guest Capacity Insights for Kurul
- The most common guest capacity trend in Kurul vacation rentals is listings accommodating 8+ guests (52.4%). This suggests the primary traveler segment is likely larger groups.
- Properties designed for 8+ guests and 4 guests dominate the Kurul STR market, accounting for 71.4% of listings.
- 52.4% of properties accommodate 6+ guests, serving the market segment for larger families or group travel in Kurul.
- On average, properties in Kurul are equipped to host 5.3 guests.
Kurul Airbnb Booking Patterns (2026): Available vs. Booked Days
Available Days Distribution
Booked Days Distribution
Booking Pattern Insights for Kurul
- The most common availability pattern in Kurul falls within the 271-366 days range, representing 76.2% of listings. This suggests many properties have significant open periods on their calendars.
- Approximately 95.2% of listings show high availability (181+ days open annually), indicating potential for increased bookings or specific owner usage patterns.
- For booked days, the 1-30 days range is most frequent in Kurul (47.6%), reflecting common guest stay durations or potential owner blocking patterns.
- A notable 4.8% of properties secure long booking periods (181+ days booked per year), highlighting successful long-term rental strategies or significant owner usage.
Kurul Airbnb Minimum Stay Requirements Analysis
Distribution of Listings by Minimum Night Requirement
1 Night
21 listings
100% of total
Key Insights
- The most prevalent minimum stay requirement in Kurul is 1 Night, adopted by 100% of listings. This highlights the market's preference for shorter, flexible bookings.
- A strong majority (100.0%) of the Kurul Airbnb data shows acceptance of very short stays (1-2 nights), indicating a dynamic, high-turnover market.
Recommendations
- Align with the market by considering a 1 Night minimum stay, as 100% of Kurul hosts use this setting.
- Adjust minimum nights based on seasonality – potentially shorter during low season and longer during peak demand periods in Kurul.
Kurul Airbnb Cancellation Policy Trends Analysis (2026)
Super Strict 30 Days
1 listings
4.8% of total
Flexible
9 listings
42.9% of total
Moderate
4 listings
19% of total
Firm
6 listings
28.6% of total
Strict
1 listings
4.8% of total
Cancellation Policy Insights for Kurul
- The prevailing Airbnb cancellation policy trend in Kurul is Flexible, used by 42.9% of listings.
- There's a relatively balanced mix between guest-friendly (61.9%) and stricter (33.4%) policies, offering choices for different guest needs.
- Strict cancellation policies are quite rare (4.8%), potentially making listings with this policy less competitive unless justified by high demand or property type.
Recommendations for Hosts
- Consider adopting a Flexible policy to align with the 42.9% market standard in Kurul.
- Using a Strict policy might deter some guests, as only 4.8% of listings use it. Evaluate if potential revenue protection outweighs possible lower booking rates.
- Regularly review your cancellation policy against competitors and market demand shifts in Kurul.
Kurul STR Booking Lead Time Analysis (2026)
Average Booking Lead Time by Month
Booking Lead Time Insights for Kurul
- The overall average booking lead time for vacation rentals in Kurul is 29 days.
- Guests book furthest in advance for stays during February (average 33 days), likely coinciding with peak travel demand or local events.
- The shortest booking windows occur for stays in May (average 8 days), indicating more last-minute travel plans during this time.
- Seasonally, Winter (21 days avg.) sees the longest lead times, while Fall (13 days avg.) has the shortest, reflecting typical travel planning cycles.
Recommendations for Hosts
- Use the overall average lead time (29 days) as a baseline for your pricing and availability strategy in Kurul.
- During May, focus on last-minute booking availability and promotions, as guests book with very short notice (8 days avg.).
- Target marketing efforts for the Winter season well in advance (at least 21 days) to capture early planners.
- Monitor your own booking lead times against these Kurul averages to identify opportunities for dynamic pricing adjustments.
Popular & Essential Airbnb Amenities in Kurul (2026)
Amenity Prevalence
Amenity Insights for Kurul
- Essential amenities in Kurul that guests expect include: Air conditioning. Lacking these (this) could significantly impact bookings.
- Popular amenities like TV, First aid kit, Hot water are common but not universal. Offering these can provide a competitive edge.
- Warning: Wifi is not universally provided but is considered essential globally. Ensure reliable Wifi is offered.
Recommendations for Hosts
- Ensure your listing includes all essential amenities for Kurul: Air conditioning.
- Prioritize adding missing essentials: Air conditioning.
- Consider adding popular differentiators like TV or First aid kit to increase appeal.
- Highlight unique or less common amenities you offer (e.g., hot tub, dedicated workspace, EV charger) in your listing description and photos.
- Regularly check competitor amenities in Kurul to stay competitive.
Kurul Airbnb Guest Demographics & Profile Analysis (2026)
Guest Profile Summary for Kurul
- The typical guest profile for Airbnb in Kurul consists of primarily domestic travelers (94%), often arriving from nearby Mumbai, typically belonging to the Post-2000s (Gen Z/Alpha) group (50%), primarily speaking Hindi or English.
- Domestic travelers account for 94.4% of guests.
- Key international markets include India (94.4%) and United Arab Emirates (5.6%).
- Top languages spoken are Hindi (43.5%) followed by English (43.5%).
- A significant demographic segment is the Post-2000s (Gen Z/Alpha) group, representing 50% of guests.
Recommendations for Hosts
- Target domestic marketing efforts towards travelers from Mumbai and Pune.
- Tailor amenities and listing descriptions to appeal to the dominant Post-2000s (Gen Z/Alpha) demographic (e.g., highlight fast WiFi, smart home features, local guides).
- Highlight unique local experiences or amenities relevant to the primary guest profile.
- Consider seasonal promotions aligned with peak travel times for key origin markets.
Nearby Short-Term Rental Market Comparison
How does the Kurul Airbnb market stack up against its neighbors? Compare key performance metrics like average monthly revenue, ADR, and occupancy rates in surrounding areas to understand the broader regional STR landscape.
| Market | Active Properties | Monthly Revenue | Daily Rate | Avg. Occupancy |
|---|---|---|---|---|
| Chondhi | 15 | $2,777 | $349.15 | 29% |
| Kihim | 11 | $2,317 | $296.88 | 27% |
| Gevhande Apati | 10 | $2,224 | $348.25 | 25% |
| Mahagaon | 12 | $1,989 | $268.55 | 33% |
| Chondi | 42 | $1,484 | $250.47 | 27% |
| Pimpari | 12 | $1,446 | $304.98 | 19% |
| Dhalewadi | 10 | $1,240 | $124.55 | 33% |
| Khandala | 25 | $1,229 | $250.56 | 24% |
| Awas | 26 | $1,128 | $233.10 | 22% |
| Waksai | 46 | $1,003 | $161.82 | 26% |