Khandala Airbnb Market Analysis 2026: Short Term Rental Data & Vacation Rental Statistics in Maharashtra, India
Is Airbnb profitable in Khandala in 2026? Explore comprehensive Airbnb analytics for Khandala, Maharashtra, India to uncover income potential. This 2026 STR market report for Khandala, based on AirROI data from February 2025 to January 2026, reveals key trends in the niche market of 25 active listings.
Whether you're considering an Airbnb investment in Khandala, optimizing your existing vacation rental, or exploring rental arbitrage opportunities, understanding the Khandala Airbnb data is crucial. Leveraging the low regulation environment is key to maximizing your short term rental income potential. Let's dive into the specifics.
Key Khandala Airbnb Performance Metrics Overview
Monthly Airbnb Revenue Variations & Income Potential in Khandala (2026)
Understanding the monthly revenue variations for Airbnb listings in Khandala is key to maximizing your short term rental income potential. Seasonality significantly impacts earnings. Our analysis, based on data from the past 12 months, shows that the peak revenue month for STRs in Khandala is typically December, while September often presents the lowest earnings, highlighting opportunities for strategic pricing adjustments during shoulder and low seasons. Explore the typical Airbnb income in Khandala across different performance tiers:
- Best-in-class properties (Top 10%) achieve $4,672+ monthly, often utilizing dynamic pricing and superior guest experiences.
- Strong performing properties (Top 25%) earn $2,684 or more, indicating effective management and desirable locations/amenities.
- Typical properties (Median) generate around $957 per month, representing the average market performance.
- Entry-level properties (Bottom 25%) see earnings around $396, often with potential for optimization.
Average Monthly Airbnb Earnings Trend in Khandala
Khandala Airbnb Occupancy Rate Trends (2026)
Maximize your bookings by understanding the Khandala STR occupancy trends. Seasonal demand shifts significantly influence how often properties are booked. Typically, Julysees the highest demand (peak season occupancy), while November experiences the lowest (low season). Effective strategies, like adjusting minimum stays or offering promotions, can boost occupancy during slower periods. Here's how different property tiers perform in Khandala:
- Best-in-class properties (Top 10%) achieve 42%+ occupancy, indicating high desirability and potentially optimized availability.
- Strong performing properties (Top 25%) maintain 33% or higher occupancy, suggesting good market fit and guest satisfaction.
- Typical properties (Median) have an occupancy rate around 24%.
- Entry-level properties (Bottom 25%) average 14% occupancy, potentially facing higher vacancy.
Average Monthly Occupancy Rate Trend in Khandala
Average Daily Rate (ADR) Airbnb Trends in Khandala (2026)
Effective short term rental pricing strategy in Khandala involves understanding monthly ADR fluctuations. The Average Daily Rate (ADR) for Airbnb in Khandala typically peaks in June and dips lowest during September. Leveraging Airbnb dynamic pricing tools or strategies based on this seasonality can significantly boost revenue. Here's a look at the typical nightly rates achieved:
- Best-in-class properties (Top 10%) command rates of $520+ per night, often due to premium features or locations.
- Strong performing properties (Top 25%) achieve nightly rates of $390 or more.
- Typical properties (Median) charge around $251 per night.
- Entry-level properties (Bottom 25%) earn around $38 per night.
Average Daily Rate (ADR) Trend by Month in Khandala
Get Live Khandala Market Intelligence 👇

Explore Real-time Analytics
Airbnb Seasonality Analysis & Trends in Khandala (2026)
Peak Season (December, October, August)
- Revenue averages $2,453 per month
- Occupancy rates average 27.0%
- Daily rates average $264
Shoulder Season
- Revenue averages $1,828 per month
- Occupancy maintains around 26.0%
- Daily rates hold near $268
Low Season (February, April, September)
- Revenue drops to average $1,561 per month
- Occupancy decreases to average 24.6%
- Daily rates adjust to average $259
Seasonality Insights for Khandala
- The Airbnb seasonality in Khandala shows highly seasonal trends requiring careful strategy. While the sections above show seasonal averages, it's also insightful to look at the extremes:
- During the high season, the absolute peak month showcases Khandala's highest earning potential, with monthly revenues capable of climbing to $2,817, occupancy reaching a high of 31.7%, and ADRs peaking at $280.
- Conversely, the slowest single month of the year, typically falling within the low season, marks the market's lowest point. In this month, revenue might dip to $1,321, occupancy could drop to 23.1%, and ADRs may adjust down to $243.
- Understanding both the seasonal averages and these monthly peaks and troughs in revenue, occupancy, and ADR is crucial for maximizing your Airbnb profit potential in Khandala.
Seasonal Strategies for Maximizing Profit
- Peak Season: Maximize revenue through premium pricing and potentially longer minimum stays. Ensure high availability.
- Low Season: Offer competitive pricing, special promotions (e.g., extended stay discounts), and flexible cancellation policies. Target off-season travelers like remote workers or budget-conscious guests.
- Shoulder Seasons: Implement dynamic pricing that balances peak and low rates. Target weekend travelers or specific events. Offer slightly more flexible terms than peak season.
- Regularly analyze your own performance against these Khandala seasonality benchmarks and adjust your pricing and availability strategy accordingly.
Best Areas for Airbnb Investment in Khandala (2026)
Exploring the top neighborhoods for short-term rentals in Khandala? This section highlights key areas, outlining why they are attractive for hosts and guests, along with notable local attractions. Consider these locations based on your target guest profile and investment strategy.
| Neighborhood / Area | Why Host Here? (Target Guests & Appeal) | Key Attractions & Landmarks |
|---|---|---|
| Khandala Hill Station | A popular hill station known for its scenic views and pleasant weather, attracting tourists looking for a peaceful getaway from the city. | Lions Point, Bhushi Dam, Khandala Lake, Rajmachi Fort, Duke's Nose |
| Bhor Ghat | An iconic mountain pass with breathtaking panoramic views, appealing to adventure seekers and nature lovers. | Bhor Ghat viewpoints, Trekking trails, Historical forts nearby, Lush greenery, Waterfalls during monsoon |
| Celebrity Hill | Famous for being a retreat for Bollywood celebrities, offering exclusivity and luxury, making it attractive for affluent guests. | Celebrity homes, Vistas of the Western Ghats, Private villas, High-end resorts |
| Khandala Village | A quaint village that provides an authentic local experience, appealing to those looking for cultural immersion alongside natural beauty. | Local tribal culture, Traditional food spots, Nature walks, Agricultural beauty, Charming local markets |
| Amby Valley | Luxury township known for its premium offerings and recreational amenities, popular with families and affluent travelers. | Golf course, Adventure sports, Luxury spa resorts, Water activities, Nature trails |
| Peth Shahapur | A serene escape with stunning landscapes, ideal for nature retreats and eco-tourism, attracting eco-conscious travelers. | Natural forests, Trekking routes, Camping sites, Bird watching, Stargazing spots |
| Karla Caves | Ancient rock-cut Buddhist caves that are a UNESCO World Heritage site, drawing history buffs and cultural explorers. | Buddhist caves, Ancient rock carvings, Heritage walks, Cave temples, Visit to the nearby Bhaja caves |
| Khandala Scenic Viewpoints | Multiple viewpoints offer breathtaking panoramic views that entice photography enthusiasts and couples looking for romantic spots. | Sunset views, Photography spots, Natural beauty, Picnic areas, Well-maintained gardens |
Understanding Airbnb License Requirements & STR Laws in Khandala (2026)
While Khandala, Maharashtra, India currently shows low STR regulations, specific Airbnb license requirements might still exist or change. Always verify the latest short term rental regulations and Airbnb license requirements directly with local government authorities for Khandala to ensure full compliance before hosting.
(Source: AirROI data, 2026, based on 8% licensed listings)
Top Performing Airbnb Properties in Khandala (2026)
Benchmark your potential! Explore examples of top-performing Airbnb properties in Khandalabased on Trailing Twelve Month (TTM) revenue. Analyze their characteristics, revenue, occupancy rate, and ADR to understand what drives success in this market.

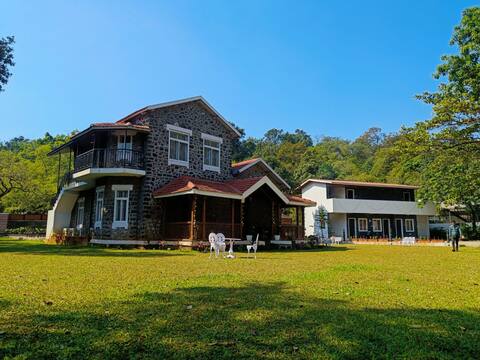
7BHKLuxe Villa / W-Pool @ Sweet Mountain
Entire Place • 7 bedrooms

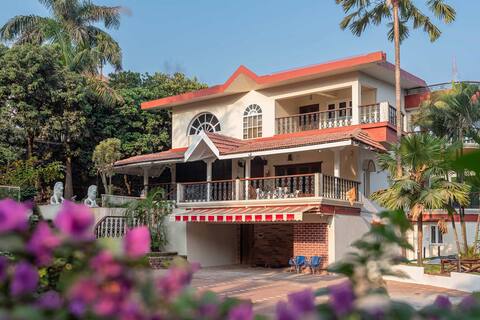
Bahisht, the Heritage pool villa
Entire Place • 5 bedrooms

Jungle Villa 4bhk
Entire Place • 4 bedrooms
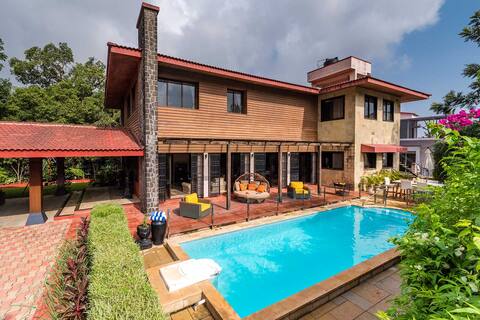
Pams Villa: Luxury Heritage Home
Entire Place • 8 bedrooms
Hillside Serenity - 5 BHK W/Pool, Bonfire, Bar
Entire Place • 5 bedrooms
5BHK@Woodstone Villa w/ Pool & Lawn @Lonavla
Entire Place • 5 bedrooms
Note: Performance varies based on location, size, amenities, seasonality, and management quality. Data reflects the past 12 months.
Top Performing Airbnb Hosts in Khandala (2026)
Learn from the best! This table showcases top-performing Airbnb hosts in Khandala based on the number of properties managed and estimated total revenue over the past year. Analyze their scale and performance metrics.
| Host Name | Properties | Grossing Revenue | Stay Reviews | Avg Rating |
|---|---|---|---|---|
| Linsy | 3 | $122,536 | 6 | 5.00/5.0 |
| Karan | 1 | $51,035 | 19 | 4.95/5.0 |
| Sumeet | 1 | $42,083 | 54 | 4.78/5.0 |
| Tolentino | 1 | $41,289 | 2 | Not Rated |
| Family Tides | 2 | $31,200 | 35 | 4.59/5.0 |
| Arpit | 9 | $23,550 | 29 | 3.79/5.0 |
| Nishad | 2 | $20,333 | 6 | 5.00/5.0 |
| Khurody Technical Services Pvt | 1 | $10,745 | 55 | 4.87/5.0 |
| O | 1 | $7,637 | 1 | Not Rated |
| Vijay | 1 | $6,376 | 4 | 4.50/5.0 |
Analyzing the strategies of top hosts, such as their property selection, pricing, and guest communication, can offer valuable lessons for optimizing your own Airbnb operations in Khandala.
Dive Deeper: Advanced Khandala STR Market Data (2026)
Ready to unlock more insights? AirROI provides access to advanced metrics and comprehensive Airbnb data for Khandala. Explore detailed analytics beyond this report to refine your investment strategy, optimize pricing, and maximize your vacation rental profits.
Explore Advanced MetricsKhandala Short-Term Rental Market Composition (2026): Property & Room Types
Room Type Distribution
Property Type Distribution
Market Composition Insights for Khandala
- The Khandala Airbnb market composition is heavily skewed towards Entire Home/Apt listings, which make up 68% of the 25 active rentals. This indicates strong guest preference for privacy and space.
- However, a notable 32% share for Private Rooms suggests opportunities for budget-conscious travelers or hosts renting out spare rooms.
- Looking at the property type distribution in Khandala, House properties are the most common (72%), reflecting the local real estate landscape.
- Houses represent a significant 72% portion, catering likely to families or larger groups.
- The presence of 28% Hotel/Boutique listings indicates integration with traditional hospitality.
Khandala Airbnb Room Capacity Analysis (2026): Bedroom Distribution
Distribution of Listings by Number of Bedrooms
Room Capacity Insights for Khandala
- The dominant room capacity in Khandala is 5+ bedrooms listings, making up 36% of the market. This suggests a strong demand for properties suitable for families or small groups.
- Together, 5+ bedrooms and 4 bedrooms properties represent 68.0% of the active Airbnb listings in Khandala, indicating a high concentration in these sizes.
- A significant 68.0% of listings offer 3+ bedrooms, catering to larger groups and families seeking more space in Khandala.
Khandala Vacation Rental Guest Capacity Trends (2026)
Distribution of Listings by Guest Capacity
Guest Capacity Insights for Khandala
- The most common guest capacity trend in Khandala vacation rentals is listings accommodating 8+ guests (68%). This suggests the primary traveler segment is likely larger groups.
- Properties designed for 8+ guests and 2 guests dominate the Khandala STR market, accounting for 84.0% of listings.
- 68.0% of properties accommodate 6+ guests, serving the market segment for larger families or group travel in Khandala.
- On average, properties in Khandala are equipped to host 6.2 guests.
Khandala Airbnb Booking Patterns (2026): Available vs. Booked Days
Available Days Distribution
Booked Days Distribution
Booking Pattern Insights for Khandala
- The most common availability pattern in Khandala falls within the 271-366 days range, representing 80% of listings. This suggests many properties have significant open periods on their calendars.
- Approximately 96.0% of listings show high availability (181+ days open annually), indicating potential for increased bookings or specific owner usage patterns.
- For booked days, the 31-90 days range is most frequent in Khandala (40%), reflecting common guest stay durations or potential owner blocking patterns.
- A notable 4.0% of properties secure long booking periods (181+ days booked per year), highlighting successful long-term rental strategies or significant owner usage.
Khandala Airbnb Minimum Stay Requirements Analysis
Distribution of Listings by Minimum Night Requirement
1 Night
25 listings
100% of total
Key Insights
- The most prevalent minimum stay requirement in Khandala is 1 Night, adopted by 100% of listings. This highlights the market's preference for shorter, flexible bookings.
- A strong majority (100.0%) of the Khandala Airbnb data shows acceptance of very short stays (1-2 nights), indicating a dynamic, high-turnover market.
Recommendations
- Align with the market by considering a 1 Night minimum stay, as 100% of Khandala hosts use this setting.
- Adjust minimum nights based on seasonality – potentially shorter during low season and longer during peak demand periods in Khandala.
Khandala Airbnb Cancellation Policy Trends Analysis (2026)
Flexible
10 listings
41.7% of total
Moderate
2 listings
8.3% of total
Firm
10 listings
41.7% of total
Strict
2 listings
8.3% of total
Cancellation Policy Insights for Khandala
- The prevailing Airbnb cancellation policy trend in Khandala is Flexible, used by 41.7% of listings.
- There's a relatively balanced mix between guest-friendly (50.0%) and stricter (50.0%) policies, offering choices for different guest needs.
- Strict cancellation policies are quite rare (8.3%), potentially making listings with this policy less competitive unless justified by high demand or property type.
Recommendations for Hosts
- Consider adopting a Flexible policy to align with the 41.7% market standard in Khandala.
- Using a Strict policy might deter some guests, as only 8.3% of listings use it. Evaluate if potential revenue protection outweighs possible lower booking rates.
- Regularly review your cancellation policy against competitors and market demand shifts in Khandala.
Khandala STR Booking Lead Time Analysis (2026)
Average Booking Lead Time by Month
Booking Lead Time Insights for Khandala
- The overall average booking lead time for vacation rentals in Khandala is 26 days.
- Guests book furthest in advance for stays during November (average 66 days), likely coinciding with peak travel demand or local events.
- The shortest booking windows occur for stays in March (average 15 days), indicating more last-minute travel plans during this time.
- Seasonally, Fall (50 days avg.) sees the longest lead times, while Spring (23 days avg.) has the shortest, reflecting typical travel planning cycles.
Recommendations for Hosts
- Use the overall average lead time (26 days) as a baseline for your pricing and availability strategy in Khandala.
- For November stays, consider implementing length-of-stay discounts or slightly higher rates for bookings made less than 66 days out to capitalize on advance planning.
- Target marketing efforts for the Fall season well in advance (at least 50 days) to capture early planners.
- Monitor your own booking lead times against these Khandala averages to identify opportunities for dynamic pricing adjustments.
Popular & Essential Airbnb Amenities in Khandala (2026)
Amenity Prevalence
Amenity Insights for Khandala
- Essential amenities in Khandala that guests expect include: Air conditioning, TV, Wifi. Lacking these (any) could significantly impact bookings.
- Popular amenities like Free parking on premises, Pool, Hot water are common but not universal. Offering these can provide a competitive edge.
- A pool is a highly desired but not standard amenity, making it a key feature for attracting guests seeking leisure in Khandala.
Recommendations for Hosts
- Ensure your listing includes all essential amenities for Khandala: Air conditioning, TV, Wifi.
- Prioritize adding missing essentials: TV, Wifi.
- Consider adding popular differentiators like Free parking on premises or Pool to increase appeal.
- Highlight unique or less common amenities you offer (e.g., hot tub, dedicated workspace, EV charger) in your listing description and photos.
- Regularly check competitor amenities in Khandala to stay competitive.
Khandala Airbnb Guest Demographics & Profile Analysis (2026)
Guest Profile Summary for Khandala
- The typical guest profile for Airbnb in Khandala consists of primarily domestic travelers (89%), often arriving from nearby Mumbai, typically belonging to the Post-2000s (Gen Z/Alpha) group (50%), primarily speaking English or Hindi.
- Domestic travelers account for 88.9% of guests.
- Key international markets include India (88.9%) and United States (7.4%).
- Top languages spoken are English (45%) followed by Hindi (45%).
- A significant demographic segment is the Post-2000s (Gen Z/Alpha) group, representing 50% of guests.
Recommendations for Hosts
- Target domestic marketing efforts towards travelers from Mumbai and Pune.
- Tailor amenities and listing descriptions to appeal to the dominant Post-2000s (Gen Z/Alpha) demographic (e.g., highlight fast WiFi, smart home features, local guides).
- Highlight unique local experiences or amenities relevant to the primary guest profile.
- Consider seasonal promotions aligned with peak travel times for key origin markets.
Nearby Short-Term Rental Market Comparison
How does the Khandala Airbnb market stack up against its neighbors? Compare key performance metrics like average monthly revenue, ADR, and occupancy rates in surrounding areas to understand the broader regional STR landscape.
| Market | Active Properties | Monthly Revenue | Daily Rate | Avg. Occupancy |
|---|---|---|---|---|
| Chondhi | 15 | $2,777 | $349.15 | 29% |
| Kihim | 11 | $2,317 | $296.88 | 27% |
| Gevhande Apati | 10 | $2,224 | $348.25 | 25% |
| Mahagaon | 12 | $1,989 | $268.55 | 33% |
| Chondi | 42 | $1,484 | $250.47 | 27% |
| Pimpari | 12 | $1,446 | $304.98 | 19% |
| Dhalewadi | 10 | $1,240 | $124.55 | 33% |
| Awas | 26 | $1,128 | $233.10 | 22% |
| Waksai | 46 | $1,003 | $161.82 | 26% |
| Kurul | 21 | $996 | $216.03 | 25% |