Bhose Airbnb Market Analysis 2025: Short Term Rental Data & Vacation Rental Statistics in Maharashtra, India
Is Airbnb profitable in Bhose in 2025? Explore comprehensive Airbnb analytics for Bhose, Maharashtra, India to uncover income potential. This 2025 STR market report for Bhose, based on AirROI data from November 2024 to October 2025, reveals key trends in the niche market of 19 active listings.
Whether you're considering an Airbnb investment in Bhose, optimizing your existing vacation rental, or exploring rental arbitrage opportunities, understanding the Bhose Airbnb data is crucial. Leveraging the low regulation environment is key to maximizing your short term rental income potential. Let's dive into the specifics.
Key Bhose Airbnb Performance Metrics Overview
Monthly Airbnb Revenue Variations & Income Potential in Bhose (2025)
Understanding the monthly revenue variations for Airbnb listings in Bhose is key to maximizing your short term rental income potential. Seasonality significantly impacts earnings. Our analysis, based on data from the past 12 months, shows that the peak revenue month for STRs in Bhose is typically February, while September often presents the lowest earnings, highlighting opportunities for strategic pricing adjustments during shoulder and low seasons. Explore the typical Airbnb income in Bhose across different performance tiers:
- Best-in-class properties (Top 10%) achieve $3,113+ monthly, often utilizing dynamic pricing and superior guest experiences.
- Strong performing properties (Top 25%) earn $1,749 or more, indicating effective management and desirable locations/amenities.
- Typical properties (Median) generate around $718 per month, representing the average market performance.
- Entry-level properties (Bottom 25%) see earnings around $326, often with potential for optimization.
Average Monthly Airbnb Earnings Trend in Bhose
Bhose Airbnb Occupancy Rate Trends (2025)
Maximize your bookings by understanding the Bhose STR occupancy trends. Seasonal demand shifts significantly influence how often properties are booked. Typically, Maysees the highest demand (peak season occupancy), while February experiences the lowest (low season). Effective strategies, like adjusting minimum stays or offering promotions, can boost occupancy during slower periods. Here's how different property tiers perform in Bhose:
- Best-in-class properties (Top 10%) achieve 47%+ occupancy, indicating high desirability and potentially optimized availability.
- Strong performing properties (Top 25%) maintain 29% or higher occupancy, suggesting good market fit and guest satisfaction.
- Typical properties (Median) have an occupancy rate around 17%.
- Entry-level properties (Bottom 25%) average 9% occupancy, potentially facing higher vacancy.
Average Monthly Occupancy Rate Trend in Bhose
Average Daily Rate (ADR) Airbnb Trends in Bhose (2025)
Effective short term rental pricing strategy in Bhose involves understanding monthly ADR fluctuations. The Average Daily Rate (ADR) for Airbnb in Bhose typically peaks in December and dips lowest during July. Leveraging Airbnb dynamic pricing tools or strategies based on this seasonality can significantly boost revenue. Here's a look at the typical nightly rates achieved:
- Best-in-class properties (Top 10%) command rates of $358+ per night, often due to premium features or locations.
- Strong performing properties (Top 25%) achieve nightly rates of $268 or more.
- Typical properties (Median) charge around $142 per night.
- Entry-level properties (Bottom 25%) earn around $66 per night.
Average Daily Rate (ADR) Trend by Month in Bhose
Get Live Bhose Market Intelligence 👇

Explore Real-time Analytics
Airbnb Seasonality Analysis & Trends in Bhose (2025)
Peak Season (February, December, January)
- Revenue averages $2,221 per month
- Occupancy rates average 18.1%
- Daily rates average $239
Shoulder Season
- Revenue averages $1,454 per month
- Occupancy maintains around 24.5%
- Daily rates hold near $173
Low Season (June, September, October)
- Revenue drops to average $812 per month
- Occupancy decreases to average 18.6%
- Daily rates adjust to average $153
Seasonality Insights for Bhose
- The Airbnb seasonality in Bhose shows highly seasonal trends requiring careful strategy. While the sections above show seasonal averages, it's also insightful to look at the extremes:
- During the high season, the absolute peak month showcases Bhose's highest earning potential, with monthly revenues capable of climbing to $2,556, occupancy reaching a high of 32.1%, and ADRs peaking at $254.
- Conversely, the slowest single month of the year, typically falling within the low season, marks the market's lowest point. In this month, revenue might dip to $673, occupancy could drop to 12.5%, and ADRs may adjust down to $145.
- Understanding both the seasonal averages and these monthly peaks and troughs in revenue, occupancy, and ADR is crucial for maximizing your Airbnb profit potential in Bhose.
Seasonal Strategies for Maximizing Profit
- Peak Season: Maximize revenue through premium pricing and potentially longer minimum stays. Ensure high availability.
- Low Season: Offer competitive pricing, special promotions (e.g., extended stay discounts), and flexible cancellation policies. Target off-season travelers like remote workers or budget-conscious guests.
- Shoulder Seasons: Implement dynamic pricing that balances peak and low rates. Target weekend travelers or specific events. Offer slightly more flexible terms than peak season.
- Regularly analyze your own performance against these Bhose seasonality benchmarks and adjust your pricing and availability strategy accordingly.
Best Areas for Airbnb Investment in Bhose (2025)
Exploring the top neighborhoods for short-term rentals in Bhose? This section highlights key areas, outlining why they are attractive for hosts and guests, along with notable local attractions. Consider these locations based on your target guest profile and investment strategy.
| Neighborhood / Area | Why Host Here? (Target Guests & Appeal) | Key Attractions & Landmarks |
|---|---|---|
| Bhose Village | A peaceful village surrounded by natural beauty, a great spot for those looking to escape the hustle and bustle of city life. Attracts tourists seeking serene rural experiences and adventure in nature. | Waterfalls, Rice Fields, Local Temples, Nature Trails, Village Festivals |
| Koynanagar | A popular destination for nature lovers and adventure enthusiasts alike, known for its dam, hills, and lush greenery. Ideal for those looking for eco-friendly stays and outdoor activities. | Koyna Dam, Koyna Wildlife Sanctuary, Shivaji Fort, Water Sports, Trekking Trails |
| Bamnoli | Bamnoli is known for its beautiful lakes and picturesque landscapes, providing a unique getaway for tourists interested in boating and photography. | Bamnoli Lake, Boating trips, Birdwatching, Sunset Views, Ecotourism Activities |
| Mahabaleshwar | A famous hill station known for its stunning views, pleasant climate, and numerous viewpoints. Popular with families and couples looking for a romantic getaway. | Venna Lake, Arthur's Seat, Mapro Garden, Pratapgad Fort, Strawberry Farms |
| Tapola | Known as the 'Mini Mahabaleshwar', Tapola offers beautiful landscapes and outdoor activities, perfect for families and adventure seekers. | Tapola Lake, Kayaking, Camping, Nature Walks, Agricultural Tours |
| Panchgani | A popular hill station near Mahabaleshwar famous for its educational institutions and scenic viewpoints. Attracts both tourists and weekend travelers. | Table Land, Panchgani Strawberry Farms, Devil's Kitchen, Panchgani Market, Bhilar Waterfalls |
| Chandoli National Park | An excellent spot for eco-tourists and wildlife enthusiasts, this national park is home to diverse flora and fauna and several adventure activities. | Safari Tours, Nature Trails, Birdwatching, Waterfalls, Camping |
| Lingmala Waterfall | A beautiful natural attraction that draws visitors looking for adventure and photography opportunities during the monsoon season. | Waterfall Trekking, Photography Spots, Birdwatching, Picnic Areas, Nature Exploration |
Understanding Airbnb License Requirements & STR Laws in Bhose (2025)
While Bhose, Maharashtra, India currently shows low STR regulations, specific Airbnb license requirements might still exist or change. Always verify the latest short term rental regulations and Airbnb license requirements directly with local government authorities for Bhose to ensure full compliance before hosting.
(Source: AirROI data, 2025, based on 5% licensed listings)
Top Performing Airbnb Properties in Bhose (2025)
Benchmark your potential! Explore examples of top-performing Airbnb properties in Bhosebased on Trailing Twelve Month (TTM) revenue. Analyze their characteristics, revenue, occupancy rate, and ADR to understand what drives success in this market.
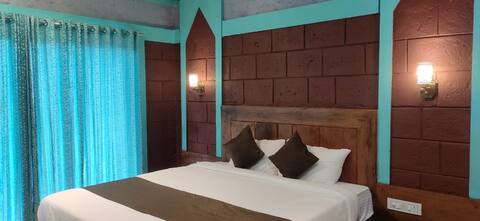
Royal Stone Resort (Family Room)
Private Room • 1 bedroom

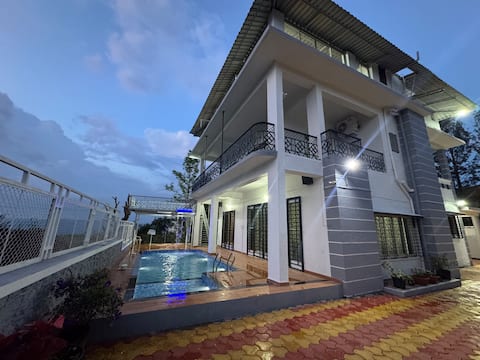
Ekayan Villa 4BHK With Pool
Entire Place • 4 bedrooms
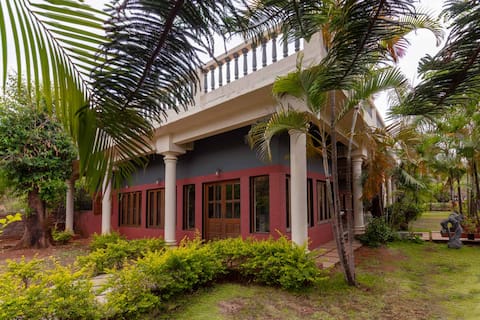
Misty Mountain by Maheru with pool and valley view
Entire Place • 5 bedrooms

Blossom Stay@ Valley facing & Dam view property
Entire Place • 4 bedrooms
5BR Mountain's Edge- Dam & Valley view @ Panchgani
Entire Place • 5 bedrooms

Joyous Villa | 6 BHK | Swimming Pool
Entire Place • 6 bedrooms
Note: Performance varies based on location, size, amenities, seasonality, and management quality. Data reflects the past 12 months.
Top Performing Airbnb Hosts in Bhose (2025)
Learn from the best! This table showcases top-performing Airbnb hosts in Bhose based on the number of properties managed and estimated total revenue over the past year. Analyze their scale and performance metrics.
| Host Name | Properties | Grossing Revenue | Stay Reviews | Avg Rating |
|---|---|---|---|---|
| Ashish | 1 | $64,339 | 25 | 4.72/5.0 |
| Ekayan Villa. | 1 | $32,846 | 11 | 5.00/5.0 |
| Amar | 1 | $19,355 | 6 | 4.67/5.0 |
| Blossom Stay | 1 | $18,366 | 10 | 4.90/5.0 |
| Host #466527181 | 1 | $15,919 | 0 | Not Rated |
| Host #548778884 | 1 | $10,965 | 1 | Not Rated |
| Manisha | 1 | $10,493 | 9 | 4.78/5.0 |
| Manish | 1 | $10,409 | 6 | 4.83/5.0 |
| Host #282006850 | 1 | $9,854 | 0 | Not Rated |
| Girish | 1 | $8,592 | 58 | 4.53/5.0 |
Analyzing the strategies of top hosts, such as their property selection, pricing, and guest communication, can offer valuable lessons for optimizing your own Airbnb operations in Bhose.
Dive Deeper: Advanced Bhose STR Market Data (2025)
Ready to unlock more insights? AirROI provides access to advanced metrics and comprehensive Airbnb data for Bhose. Explore detailed analytics beyond this report to refine your investment strategy, optimize pricing, and maximize your vacation rental profits.
Explore Advanced MetricsBhose Short-Term Rental Market Composition (2025): Property & Room Types
Room Type Distribution
Property Type Distribution
Market Composition Insights for Bhose
- The Bhose Airbnb market composition is heavily skewed towards Entire Home/Apt listings, which make up 78.9% of the 19 active rentals. This indicates strong guest preference for privacy and space.
- Looking at the property type distribution in Bhose, House properties are the most common (84.2%), reflecting the local real estate landscape.
- Houses represent a significant 84.2% portion, catering likely to families or larger groups.
- The presence of 10.5% Hotel/Boutique listings indicates integration with traditional hospitality.
Bhose Airbnb Room Capacity Analysis (2025): Bedroom Distribution
Distribution of Listings by Number of Bedrooms
Room Capacity Insights for Bhose
- The dominant room capacity in Bhose is 4 bedrooms listings, making up 31.6% of the market. This suggests a strong demand for properties suitable for families or small groups.
- Together, 4 bedrooms and 5+ bedrooms properties represent 63.2% of the active Airbnb listings in Bhose, indicating a high concentration in these sizes.
- A significant 84.3% of listings offer 3+ bedrooms, catering to larger groups and families seeking more space in Bhose.
Bhose Vacation Rental Guest Capacity Trends (2025)
Distribution of Listings by Guest Capacity
Guest Capacity Insights for Bhose
- The most common guest capacity trend in Bhose vacation rentals is listings accommodating 8+ guests (68.4%). This suggests the primary traveler segment is likely larger groups.
- Properties designed for 8+ guests and 4 guests dominate the Bhose STR market, accounting for 73.7% of listings.
- 73.7% of properties accommodate 6+ guests, serving the market segment for larger families or group travel in Bhose.
- On average, properties in Bhose are equipped to host 6.2 guests.
Bhose Airbnb Booking Patterns (2025): Available vs. Booked Days
Available Days Distribution
Booked Days Distribution
Booking Pattern Insights for Bhose
- The most common availability pattern in Bhose falls within the 271-366 days range, representing 78.9% of listings. This suggests many properties have significant open periods on their calendars.
- Approximately 100.0% of listings show high availability (181+ days open annually), indicating potential for increased bookings or specific owner usage patterns.
- For booked days, the 31-90 days range is most frequent in Bhose (42.1%), reflecting common guest stay durations or potential owner blocking patterns.
Bhose Airbnb Minimum Stay Requirements Analysis
Distribution of Listings by Minimum Night Requirement
1 Night
16 listings
84.2% of total
2 Nights
2 listings
10.5% of total
30+ Nights
1 listings
5.3% of total
Key Insights
- The most prevalent minimum stay requirement in Bhose is 1 Night, adopted by 84.2% of listings. This highlights the market's preference for shorter, flexible bookings.
- A strong majority (94.7%) of the Bhose Airbnb data shows acceptance of very short stays (1-2 nights), indicating a dynamic, high-turnover market.
Recommendations
- Align with the market by considering a 1 Night minimum stay, as 84.2% of Bhose hosts use this setting.
- Explore offering discounts for stays of 30+ nights to attract the 5.3% of the market seeking extended stays.
- Adjust minimum nights based on seasonality – potentially shorter during low season and longer during peak demand periods in Bhose.
Bhose Airbnb Cancellation Policy Trends Analysis (2025)
Flexible
8 listings
47.1% of total
Moderate
3 listings
17.6% of total
Firm
5 listings
29.4% of total
Strict
1 listings
5.9% of total
Cancellation Policy Insights for Bhose
- The prevailing Airbnb cancellation policy trend in Bhose is Flexible, used by 47.1% of listings.
- There's a relatively balanced mix between guest-friendly (64.7%) and stricter (35.3%) policies, offering choices for different guest needs.
- Strict cancellation policies are quite rare (5.9%), potentially making listings with this policy less competitive unless justified by high demand or property type.
Recommendations for Hosts
- Consider adopting a Flexible policy to align with the 47.1% market standard in Bhose.
- Using a Strict policy might deter some guests, as only 5.9% of listings use it. Evaluate if potential revenue protection outweighs possible lower booking rates.
- Regularly review your cancellation policy against competitors and market demand shifts in Bhose.
Bhose STR Booking Lead Time Analysis (2025)
Average Booking Lead Time by Month
Booking Lead Time Insights for Bhose
- The overall average booking lead time for vacation rentals in Bhose is 16 days.
- Guests book furthest in advance for stays during October (average 39 days), likely coinciding with peak travel demand or local events.
- The shortest booking windows occur for stays in June (average 6 days), indicating more last-minute travel plans during this time.
- Seasonally, Fall (22 days avg.) sees the longest lead times, while Summer (14 days avg.) has the shortest, reflecting typical travel planning cycles.
Recommendations for Hosts
- Use the overall average lead time (16 days) as a baseline for your pricing and availability strategy in Bhose.
- For October stays, consider implementing length-of-stay discounts or slightly higher rates for bookings made less than 39 days out to capitalize on advance planning.
- During June, focus on last-minute booking availability and promotions, as guests book with very short notice (6 days avg.).
- Target marketing efforts for the Fall season well in advance (at least 22 days) to capture early planners.
- Monitor your own booking lead times against these Bhose averages to identify opportunities for dynamic pricing adjustments.
Popular & Essential Airbnb Amenities in Bhose (2025)
Amenity Prevalence
Amenity Insights for Bhose
- Popular amenities like Free parking on premises, Wifi, TV are common but not universal. Offering these can provide a competitive edge.
- Warning: Wifi is not universally provided but is considered essential globally. Ensure reliable Wifi is offered.
Recommendations for Hosts
- Consider adding popular differentiators like Free parking on premises or Wifi to increase appeal.
- Highlight unique or less common amenities you offer (e.g., hot tub, dedicated workspace, EV charger) in your listing description and photos.
- Regularly check competitor amenities in Bhose to stay competitive.
Bhose Airbnb Guest Demographics & Profile Analysis (2025)
Guest Profile Summary for Bhose
- The typical guest profile for Airbnb in Bhose consists of primarily domestic travelers (84%), often arriving from nearby Pune, typically belonging to the Post-2000s (Gen Z/Alpha) group (50%), primarily speaking English or Hindi.
- Domestic travelers account for 84.0% of guests.
- Key international markets include India (84%) and United States (16%).
- Top languages spoken are English (52.9%) followed by Hindi (35.3%).
- A significant demographic segment is the Post-2000s (Gen Z/Alpha) group, representing 50% of guests.
Recommendations for Hosts
- Target domestic marketing efforts towards travelers from Pune and Mumbai.
- Tailor amenities and listing descriptions to appeal to the dominant Post-2000s (Gen Z/Alpha) demographic (e.g., highlight fast WiFi, smart home features, local guides).
- Highlight unique local experiences or amenities relevant to the primary guest profile.
- Consider seasonal promotions aligned with peak travel times for key origin markets.
Nearby Short-Term Rental Market Comparison
How does the Bhose Airbnb market stack up against its neighbors? Compare key performance metrics like average monthly revenue, ADR, and occupancy rates in surrounding areas to understand the broader regional STR landscape.
| Market | Active Properties | Monthly Revenue | Daily Rate | Avg. Occupancy |
|---|---|---|---|---|
| Chondhi | 15 | $2,938 | $376.83 | 27% |
| Mahagaon | 14 | $2,075 | $281.63 | 31% |
| Chondi | 45 | $1,687 | $290.70 | 26% |
| Mandawa | 11 | $1,507 | $382.27 | 18% |
| Khandala | 25 | $1,429 | $288.04 | 24% |
| Aamby Valley | 19 | $1,355 | $312.00 | 16% |
| Raigad | 16 | $1,325 | $307.60 | 19% |
| Lonavala | 421 | $1,225 | $248.63 | 21% |
| Kurul | 25 | $1,214 | $267.52 | 25% |
| Awas | 22 | $1,153 | $257.39 | 20% |