Bhopal Airbnb Market Analysis 2026: Short Term Rental Data & Vacation Rental Statistics in Madhya Pradesh, India
Is Airbnb profitable in Bhopal in 2026? Explore comprehensive Airbnb analytics for Bhopal, Madhya Pradesh, India to uncover income potential. This 2026 STR market report for Bhopal, based on AirROI data from February 2025 to January 2026, reveals key trends in the niche market of 159 active listings.
Whether you're considering an Airbnb investment in Bhopal, optimizing your existing vacation rental, or exploring rental arbitrage opportunities, understanding the Bhopal Airbnb data is crucial. Leveraging the low regulation environment is key to maximizing your short term rental income potential. Let's dive into the specifics.
Key Bhopal Airbnb Performance Metrics Overview
Monthly Airbnb Revenue Variations & Income Potential in Bhopal (2026)
Understanding the monthly revenue variations for Airbnb listings in Bhopal is key to maximizing your short term rental income potential. Seasonality significantly impacts earnings. Our analysis, based on data from the past 12 months, shows that the peak revenue month for STRs in Bhopal is typically December, while October often presents the lowest earnings, highlighting opportunities for strategic pricing adjustments during shoulder and low seasons. Explore the typical Airbnb income in Bhopal across different performance tiers:
- Best-in-class properties (Top 10%) achieve $555+ monthly, often utilizing dynamic pricing and superior guest experiences.
- Strong performing properties (Top 25%) earn $298 or more, indicating effective management and desirable locations/amenities.
- Typical properties (Median) generate around $147 per month, representing the average market performance.
- Entry-level properties (Bottom 25%) see earnings around $70, often with potential for optimization.
Average Monthly Airbnb Earnings Trend in Bhopal
Bhopal Airbnb Occupancy Rate Trends (2026)
Maximize your bookings by understanding the Bhopal STR occupancy trends. Seasonal demand shifts significantly influence how often properties are booked. Typically, Decembersees the highest demand (peak season occupancy), while October experiences the lowest (low season). Effective strategies, like adjusting minimum stays or offering promotions, can boost occupancy during slower periods. Here's how different property tiers perform in Bhopal:
- Best-in-class properties (Top 10%) achieve 61%+ occupancy, indicating high desirability and potentially optimized availability.
- Strong performing properties (Top 25%) maintain 39% or higher occupancy, suggesting good market fit and guest satisfaction.
- Typical properties (Median) have an occupancy rate around 20%.
- Entry-level properties (Bottom 25%) average 9% occupancy, potentially facing higher vacancy.
Average Monthly Occupancy Rate Trend in Bhopal
Average Daily Rate (ADR) Airbnb Trends in Bhopal (2026)
Effective short term rental pricing strategy in Bhopal involves understanding monthly ADR fluctuations. The Average Daily Rate (ADR) for Airbnb in Bhopal typically peaks in September and dips lowest during January. Leveraging Airbnb dynamic pricing tools or strategies based on this seasonality can significantly boost revenue. Here's a look at the typical nightly rates achieved:
- Best-in-class properties (Top 10%) command rates of $63+ per night, often due to premium features or locations.
- Strong performing properties (Top 25%) achieve nightly rates of $38 or more.
- Typical properties (Median) charge around $24 per night.
- Entry-level properties (Bottom 25%) earn around $17 per night.
Average Daily Rate (ADR) Trend by Month in Bhopal
Get Live Bhopal Market Intelligence 👇

Explore Real-time Analytics
Airbnb Seasonality Analysis & Trends in Bhopal (2026)
Peak Season (December, February, November)
- Revenue averages $304 per month
- Occupancy rates average 32.5%
- Daily rates average $35
Shoulder Season
- Revenue averages $217 per month
- Occupancy maintains around 25.8%
- Daily rates hold near $35
Low Season (July, August, October)
- Revenue drops to average $190 per month
- Occupancy decreases to average 23.0%
- Daily rates adjust to average $35
Seasonality Insights for Bhopal
- The Airbnb seasonality in Bhopal shows highly seasonal trends requiring careful strategy. While the sections above show seasonal averages, it's also insightful to look at the extremes:
- During the high season, the absolute peak month showcases Bhopal's highest earning potential, with monthly revenues capable of climbing to $351, occupancy reaching a high of 35.9%, and ADRs peaking at $36.
- Conversely, the slowest single month of the year, typically falling within the low season, marks the market's lowest point. In this month, revenue might dip to $173, occupancy could drop to 19.0%, and ADRs may adjust down to $34.
- Understanding both the seasonal averages and these monthly peaks and troughs in revenue, occupancy, and ADR is crucial for maximizing your Airbnb profit potential in Bhopal.
Seasonal Strategies for Maximizing Profit
- Peak Season: Maximize revenue through premium pricing and potentially longer minimum stays. Ensure high availability.
- Low Season: Offer competitive pricing, special promotions (e.g., extended stay discounts), and flexible cancellation policies. Target off-season travelers like remote workers or budget-conscious guests.
- Shoulder Seasons: Implement dynamic pricing that balances peak and low rates. Target weekend travelers or specific events. Offer slightly more flexible terms than peak season.
- Regularly analyze your own performance against these Bhopal seasonality benchmarks and adjust your pricing and availability strategy accordingly.
Best Areas for Airbnb Investment in Bhopal (2026)
Exploring the top neighborhoods for short-term rentals in Bhopal? This section highlights key areas, outlining why they are attractive for hosts and guests, along with notable local attractions. Consider these locations based on your target guest profile and investment strategy.
| Neighborhood / Area | Why Host Here? (Target Guests & Appeal) | Key Attractions & Landmarks |
|---|---|---|
| Bhojtal Lake | A serene location popular for its beautiful views. It draws tourists for recreational activities such as boating, and is a favored spot for locals and visitors alike. | Bhojtal Lake, Boat rides, Bhojpur Temple, Water sports, Park areas nearby |
| Old City | Rich in history and culture, the Old City offers a glimpse into Bhopal's heritage. It's ideal for cultural tourists and those interested in historical monuments. | Taj-ul-Masajid, Gohar Mahal, Moti Masjid, Bhopal Fort, Jama Masjid |
| Shahpura Lake | A tranquil lake area that attracts nature lovers and those seeking relaxation and scenic views. Great for outdoor activities and picnics. | Shahpura Lake, Bird watching, Picnic spots, Walking trails |
| Vip Road | A bustling neighborhood with easy access to major attractions and commercial areas, suitable for business travelers and families alike. | Shopping malls, Restaurants, Cafes, Nearby hotels |
| Habibganj | A developing area with the Bhopal Railway Station and a growing number of business establishments, attracting travelers and professionals. | Habibganj Railway Station, Shopping centers, Business hubs |
| Chunabhatta | A quieter residential region with local charm, popular with families seeking comfort and convenience, away from the hustle and bustle. | Local markets, Parks, Family-friendly restaurants |
| City Center | The heart of Bhopal with thriving commercial activities, making it popular among tourists for shopping and dining experiences. | DB City Mall, Restaurants, Cafes, Cultural sites |
| Sadar Manzil | A historical area noted for its architecture and cultural significance, drawing those interested in Bhopal's rich heritage. | Sadar Manzil Palace, Cultural festivals, Local arts and crafts |
Understanding Airbnb License Requirements & STR Laws in Bhopal (2026)
While Bhopal, Madhya Pradesh, India currently shows low STR regulations, specific Airbnb license requirements might still exist or change. Always verify the latest short term rental regulations and Airbnb license requirements directly with local government authorities for Bhopal to ensure full compliance before hosting.
(Source: AirROI data, 2026, finding no licensed listings among those analyzed)
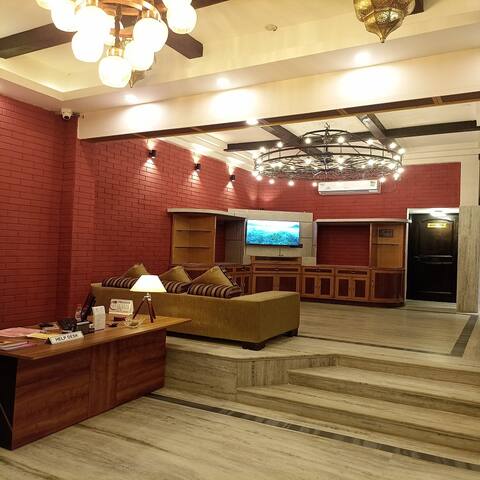
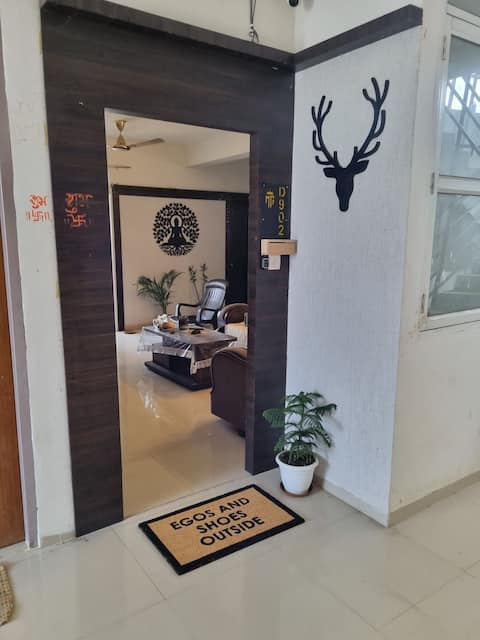
Top Performing Airbnb Properties in Bhopal (2026)
Benchmark your potential! Explore examples of top-performing Airbnb properties in Bhopalbased on Trailing Twelve Month (TTM) revenue. Analyze their characteristics, revenue, occupancy rate, and ADR to understand what drives success in this market.
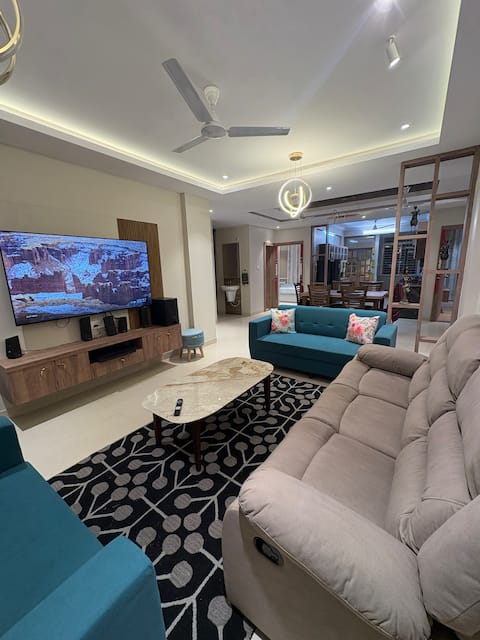
Spacious 3BHK Luxury Apartment - Breathtaking View
Entire Place • 3 bedrooms
Red Beryl Home Stay Bhopal
Private Room • 6 bedrooms
Welcome To The City of Lakes
Entire Place • 2 bedrooms

Family house at prime location
Entire Place • 2 bedrooms

Manju Dwivedi 2 Bhk Homestay near Aiims Bhopal
Entire Place • 2 bedrooms

Cheerful 5 BHK Villa Near Shahpura Lake Prime Loca
Entire Place • 5 bedrooms
Note: Performance varies based on location, size, amenities, seasonality, and management quality. Data reflects the past 12 months.
Top Performing Airbnb Hosts in Bhopal (2026)
Learn from the best! This table showcases top-performing Airbnb hosts in Bhopal based on the number of properties managed and estimated total revenue over the past year. Analyze their scale and performance metrics.
| Host Name | Properties | Grossing Revenue | Stay Reviews | Avg Rating |
|---|---|---|---|---|
| Manju | 8 | $19,480 | 233 | 4.86/5.0 |
| Parul | 12 | $19,180 | 148 | 4.88/5.0 |
| Ambika | 4 | $16,930 | 338 | 4.80/5.0 |
| Neena | 5 | $12,964 | 337 | 4.96/5.0 |
| Madhur | 14 | $10,686 | 1016 | 4.75/5.0 |
| Rakesh | 1 | $10,131 | 36 | 5.00/5.0 |
| Yaquoob | 1 | $8,680 | 2 | Not Rated |
| Asteek | 4 | $8,363 | 113 | 4.75/5.0 |
| Mitesh | 1 | $8,154 | 54 | 5.00/5.0 |
| Gaurav | 3 | $7,539 | 36 | 4.89/5.0 |
Analyzing the strategies of top hosts, such as their property selection, pricing, and guest communication, can offer valuable lessons for optimizing your own Airbnb operations in Bhopal.
Dive Deeper: Advanced Bhopal STR Market Data (2026)
Ready to unlock more insights? AirROI provides access to advanced metrics and comprehensive Airbnb data for Bhopal. Explore detailed analytics beyond this report to refine your investment strategy, optimize pricing, and maximize your vacation rental profits.
Explore Advanced MetricsBhopal Short-Term Rental Market Composition (2026): Property & Room Types
Room Type Distribution
Property Type Distribution
Market Composition Insights for Bhopal
- The Bhopal Airbnb market composition is heavily skewed towards Private Room listings, which make up 50.9% of the 159 active rentals. This indicates strong guest preference for privacy and space.
- Looking at the property type distribution in Bhopal, House properties are the most common (40.3%), reflecting the local real estate landscape.
- Houses represent a significant 40.3% portion, catering likely to families or larger groups.
- The presence of 20.8% Hotel/Boutique listings indicates integration with traditional hospitality.
- Smaller segments like outdoor/unique, others, unique stays (combined 6.9%) offer potential for unique stay experiences.
Bhopal Airbnb Room Capacity Analysis (2026): Bedroom Distribution
Distribution of Listings by Number of Bedrooms
Room Capacity Insights for Bhopal
- The dominant room capacity in Bhopal is 1 bedroom listings, making up 27% of the market. This suggests a strong demand for properties suitable for couples or solo travelers.
- Together, 1 bedroom and 2 bedrooms properties represent 49.6% of the active Airbnb listings in Bhopal, indicating a high concentration in these sizes.
- A significant 20.7% of listings offer 3+ bedrooms, catering to larger groups and families seeking more space in Bhopal.
Bhopal Vacation Rental Guest Capacity Trends (2026)
Distribution of Listings by Guest Capacity
Guest Capacity Insights for Bhopal
- The most common guest capacity trend in Bhopal vacation rentals is listings accommodating 2 guests (15.1%). This suggests the primary traveler segment is likely couples or solo travelers.
- Properties designed for 2 guests and 6 guests dominate the Bhopal STR market, accounting for 27.7% of listings.
- 27.1% of properties accommodate 6+ guests, serving the market segment for larger families or group travel in Bhopal.
- On average, properties in Bhopal are equipped to host 3.1 guests.
Bhopal Airbnb Booking Patterns (2026): Available vs. Booked Days
Available Days Distribution
Booked Days Distribution
Booking Pattern Insights for Bhopal
- The most common availability pattern in Bhopal falls within the 271-366 days range, representing 81.8% of listings. This suggests many properties have significant open periods on their calendars.
- Approximately 96.3% of listings show high availability (181+ days open annually), indicating potential for increased bookings or specific owner usage patterns.
- For booked days, the 1-30 days range is most frequent in Bhopal (44%), reflecting common guest stay durations or potential owner blocking patterns.
- A notable 3.8% of properties secure long booking periods (181+ days booked per year), highlighting successful long-term rental strategies or significant owner usage.
Bhopal Airbnb Minimum Stay Requirements Analysis
Distribution of Listings by Minimum Night Requirement
1 Night
153 listings
96.2% of total
2 Nights
1 listings
0.6% of total
4-6 Nights
1 listings
0.6% of total
7-29 Nights
1 listings
0.6% of total
30+ Nights
3 listings
1.9% of total
Key Insights
- The most prevalent minimum stay requirement in Bhopal is 1 Night, adopted by 96.2% of listings. This highlights the market's preference for shorter, flexible bookings.
- A strong majority (96.8%) of the Bhopal Airbnb data shows acceptance of very short stays (1-2 nights), indicating a dynamic, high-turnover market.
- Dedicated monthly rentals (30+ nights) represent a small niche (1.9%), possibly an untapped area for hosts.
Recommendations
- Align with the market by considering a 1 Night minimum stay, as 96.2% of Bhopal hosts use this setting.
- Adjust minimum nights based on seasonality – potentially shorter during low season and longer during peak demand periods in Bhopal.
Bhopal Airbnb Cancellation Policy Trends Analysis (2026)
Limited
1 listings
0.6% of total
Flexible
108 listings
67.9% of total
Moderate
33 listings
20.8% of total
Firm
8 listings
5% of total
Strict
9 listings
5.7% of total
Cancellation Policy Insights for Bhopal
- The prevailing Airbnb cancellation policy trend in Bhopal is Flexible, used by 67.9% of listings.
- The market strongly favors guest-friendly terms, with 88.7% of listings offering Flexible or Moderate policies. This suggests guests in Bhopal may expect booking flexibility.
- Strict cancellation policies are quite rare (5.7%), potentially making listings with this policy less competitive unless justified by high demand or property type.
Recommendations for Hosts
- Consider adopting a Flexible policy to align with the 67.9% market standard in Bhopal.
- Given the high prevalence of Flexible policies (67.9%), offering this can enhance booking appeal, especially during shoulder seasons.
- Using a Strict policy might deter some guests, as only 5.7% of listings use it. Evaluate if potential revenue protection outweighs possible lower booking rates.
- Regularly review your cancellation policy against competitors and market demand shifts in Bhopal.
Bhopal STR Booking Lead Time Analysis (2026)
Average Booking Lead Time by Month
Booking Lead Time Insights for Bhopal
- The overall average booking lead time for vacation rentals in Bhopal is 22 days.
- Guests book furthest in advance for stays during November (average 29 days), likely coinciding with peak travel demand or local events.
- The shortest booking windows occur for stays in July (average 6 days), indicating more last-minute travel plans during this time.
- Seasonally, Spring (20 days avg.) sees the longest lead times, while Summer (8 days avg.) has the shortest, reflecting typical travel planning cycles.
Recommendations for Hosts
- Use the overall average lead time (22 days) as a baseline for your pricing and availability strategy in Bhopal.
- During July, focus on last-minute booking availability and promotions, as guests book with very short notice (6 days avg.).
- Target marketing efforts for the Spring season well in advance (at least 20 days) to capture early planners.
- Monitor your own booking lead times against these Bhopal averages to identify opportunities for dynamic pricing adjustments.
Popular & Essential Airbnb Amenities in Bhopal (2026)
Amenity Prevalence
Amenity Insights for Bhopal
- Popular amenities like Air conditioning, Wifi, Free parking on premises are common but not universal. Offering these can provide a competitive edge.
- Warning: Wifi is not universally provided but is considered essential globally. Ensure reliable Wifi is offered.
Recommendations for Hosts
- Consider adding popular differentiators like Air conditioning or Wifi to increase appeal.
- Highlight unique or less common amenities you offer (e.g., hot tub, dedicated workspace, EV charger) in your listing description and photos.
- Regularly check competitor amenities in Bhopal to stay competitive.
Bhopal Airbnb Guest Demographics & Profile Analysis (2026)
Guest Profile Summary for Bhopal
- The typical guest profile for Airbnb in Bhopal consists of primarily domestic travelers (85%), often arriving from nearby Bengaluru, typically belonging to the Post-2000s (Gen Z/Alpha) group (50%), primarily speaking English or Hindi.
- Domestic travelers account for 85.3% of guests.
- Key international markets include India (85.3%) and United States (7.1%).
- Top languages spoken are English (43%) followed by Hindi (40.4%).
- A significant demographic segment is the Post-2000s (Gen Z/Alpha) group, representing 50% of guests.
Recommendations for Hosts
- Target domestic marketing efforts towards travelers from Bengaluru and New Delhi.
- Tailor amenities and listing descriptions to appeal to the dominant Post-2000s (Gen Z/Alpha) demographic (e.g., highlight fast WiFi, smart home features, local guides).
- Highlight unique local experiences or amenities relevant to the primary guest profile.
- Consider seasonal promotions aligned with peak travel times for key origin markets.