Munnar Airbnb Market Analysis 2026: Short Term Rental Data & Vacation Rental Statistics in Kerala, India
Is Airbnb profitable in Munnar in 2026? Explore comprehensive Airbnb analytics for Munnar, Kerala, India to uncover income potential. This 2026 STR market report for Munnar, based on AirROI data from February 2025 to January 2026, reveals key trends in the niche market of 40 active listings.
Whether you're considering an Airbnb investment in Munnar, optimizing your existing vacation rental, or exploring rental arbitrage opportunities, understanding the Munnar Airbnb data is crucial. Leveraging the low regulation environment is key to maximizing your short term rental income potential. Let's dive into the specifics.
Key Munnar Airbnb Performance Metrics Overview
Monthly Airbnb Revenue Variations & Income Potential in Munnar (2026)
Understanding the monthly revenue variations for Airbnb listings in Munnar is key to maximizing your short term rental income potential. Seasonality significantly impacts earnings. Our analysis, based on data from the past 12 months, shows that the peak revenue month for STRs in Munnar is typically May, while January often presents the lowest earnings, highlighting opportunities for strategic pricing adjustments during shoulder and low seasons. Explore the typical Airbnb income in Munnar across different performance tiers:
- Best-in-class properties (Top 10%) achieve $2,492+ monthly, often utilizing dynamic pricing and superior guest experiences.
- Strong performing properties (Top 25%) earn $952 or more, indicating effective management and desirable locations/amenities.
- Typical properties (Median) generate around $363 per month, representing the average market performance.
- Entry-level properties (Bottom 25%) see earnings around $139, often with potential for optimization.
Average Monthly Airbnb Earnings Trend in Munnar
Munnar Airbnb Occupancy Rate Trends (2026)
Maximize your bookings by understanding the Munnar STR occupancy trends. Seasonal demand shifts significantly influence how often properties are booked. Typically, Februarysees the highest demand (peak season occupancy), while January experiences the lowest (low season). Effective strategies, like adjusting minimum stays or offering promotions, can boost occupancy during slower periods. Here's how different property tiers perform in Munnar:
- Best-in-class properties (Top 10%) achieve 62%+ occupancy, indicating high desirability and potentially optimized availability.
- Strong performing properties (Top 25%) maintain 37% or higher occupancy, suggesting good market fit and guest satisfaction.
- Typical properties (Median) have an occupancy rate around 18%.
- Entry-level properties (Bottom 25%) average 9% occupancy, potentially facing higher vacancy.
Average Monthly Occupancy Rate Trend in Munnar
Average Daily Rate (ADR) Airbnb Trends in Munnar (2026)
Effective short term rental pricing strategy in Munnar involves understanding monthly ADR fluctuations. The Average Daily Rate (ADR) for Airbnb in Munnar typically peaks in September and dips lowest during November. Leveraging Airbnb dynamic pricing tools or strategies based on this seasonality can significantly boost revenue. Here's a look at the typical nightly rates achieved:
- Best-in-class properties (Top 10%) command rates of $165+ per night, often due to premium features or locations.
- Strong performing properties (Top 25%) achieve nightly rates of $118 or more.
- Typical properties (Median) charge around $56 per night.
- Entry-level properties (Bottom 25%) earn around $35 per night.
Average Daily Rate (ADR) Trend by Month in Munnar
Get Live Munnar Market Intelligence 👇

Explore Real-time Analytics
Airbnb Seasonality Analysis & Trends in Munnar (2026)
Peak Season (May, February, September)
- Revenue averages $951 per month
- Occupancy rates average 30.8%
- Daily rates average $84
Shoulder Season
- Revenue averages $829 per month
- Occupancy maintains around 25.0%
- Daily rates hold near $82
Low Season (January, November, December)
- Revenue drops to average $574 per month
- Occupancy decreases to average 23.4%
- Daily rates adjust to average $77
Seasonality Insights for Munnar
- The Airbnb seasonality in Munnar shows highly seasonal trends requiring careful strategy. While the sections above show seasonal averages, it's also insightful to look at the extremes:
- During the high season, the absolute peak month showcases Munnar's highest earning potential, with monthly revenues capable of climbing to $967, occupancy reaching a high of 36.6%, and ADRs peaking at $85.
- Conversely, the slowest single month of the year, typically falling within the low season, marks the market's lowest point. In this month, revenue might dip to $326, occupancy could drop to 17.5%, and ADRs may adjust down to $76.
- Understanding both the seasonal averages and these monthly peaks and troughs in revenue, occupancy, and ADR is crucial for maximizing your Airbnb profit potential in Munnar.
Seasonal Strategies for Maximizing Profit
- Peak Season: Maximize revenue through premium pricing and potentially longer minimum stays. Ensure high availability.
- Low Season: Offer competitive pricing, special promotions (e.g., extended stay discounts), and flexible cancellation policies. Target off-season travelers like remote workers or budget-conscious guests.
- Shoulder Seasons: Implement dynamic pricing that balances peak and low rates. Target weekend travelers or specific events. Offer slightly more flexible terms than peak season.
- Regularly analyze your own performance against these Munnar seasonality benchmarks and adjust your pricing and availability strategy accordingly.
Best Areas for Airbnb Investment in Munnar (2026)
Exploring the top neighborhoods for short-term rentals in Munnar? This section highlights key areas, outlining why they are attractive for hosts and guests, along with notable local attractions. Consider these locations based on your target guest profile and investment strategy.
| Neighborhood / Area | Why Host Here? (Target Guests & Appeal) | Key Attractions & Landmarks |
|---|---|---|
| Munnar Town | The central hub of Munnar, known for its accessibility to tea museums, shops, and local dining. It’s a great place for tourists who want to explore the region while having easy access to amenities. | Tea Museum, Munnar Market, Blossom Park, Kundala Lake, Attukal Waterfalls |
| Chithirapuram | A picturesque village located just a few kilometers from Munnar, known for its beautiful landscapes and serene atmosphere. Popular for those seeking a quiet retreat amidst nature. | Chithirapuram Church, Pallivasal Falls, Eucalyptus forests, Everyday Life of Local People, Cultural Tours |
| Eravikulam National Park | Famous for its rich wildlife including the Nilgiri Tahr and stunning views of the Western Ghats. Ideal for eco-tourists and nature lovers. | Nilgiri Tahr, Anamudi Peak, Nature Trails, Bird Watching, Scenic Views |
| Mattupetty | Known for its serene lake and lush green surroundings, Mattupetty is ideal for boating and experiencing the local flora and fauna. Close proximity to animal sanctuaries makes it attractive to wildlife enthusiasts. | Mattupetty Dam, Boating, Echo Point, Shooting Point, Kerala Farm |
| Kundala | A beautiful location with stunning landscapes and the famous Kundala Lake, perfect for picnics and photoshoots. Offers a tranquil escape. | Kundala Lake, Kundala Tea Plantation, Adventure Park, Scenic Boat Rides, Photography Spots |
| Top Station | The highest point in Munnar, offering breathtaking views of the valley and hills. Attractive for those seeking adventure and stunning scenic views. | Top Station Viewpoint, Trekking Trails, Tea Gardens, Nature Walks, Valley Views |
| Valparai | A bit further from Munnar but known for its cool climate and surrounding tea estates. A hidden gem for travelers seeking off-the-beaten-path experiences. | Valparai Tea Estates, Aliyar Dam, Monkey Falls, Kanalparai, Nirar Dam |
| Anamudi | The highest peak in South India, located near Munnar, attracts adventure seekers and trekkers. Known for its rich biodiversity and challenging trekking routes. | Anamudi Peak, Trekking Routes, Biodiversity, Flora and Fauna, Scenic Landscapes |
Understanding Airbnb License Requirements & STR Laws in Munnar (2026)
While Munnar, Kerala, India currently shows low STR regulations, specific Airbnb license requirements might still exist or change. Always verify the latest short term rental regulations and Airbnb license requirements directly with local government authorities for Munnar to ensure full compliance before hosting.
(Source: AirROI data, 2026, finding no licensed listings among those analyzed)
Top Performing Airbnb Properties in Munnar (2026)
Benchmark your potential! Explore examples of top-performing Airbnb properties in Munnarbased on Trailing Twelve Month (TTM) revenue. Analyze their characteristics, revenue, occupancy rate, and ADR to understand what drives success in this market.
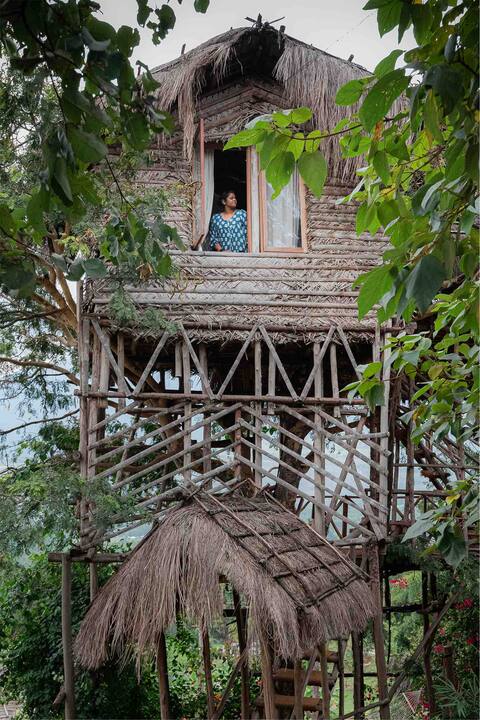
Erumadam - The Treehouse (Adults Only)
Entire Place • 1 bedroom
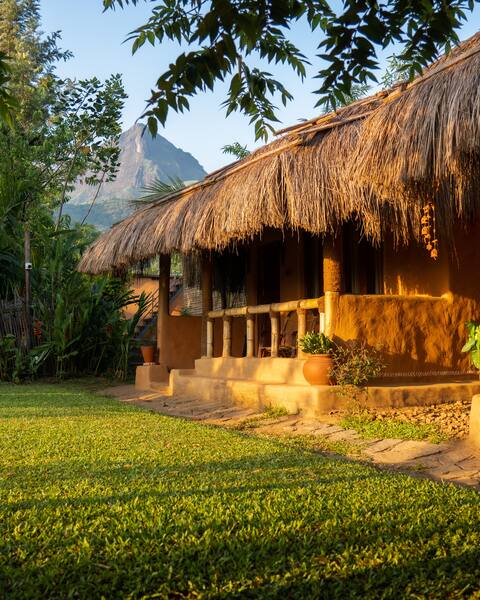
Adobe by The Mudhouse Marayoor
Entire Place • 1 bedroom
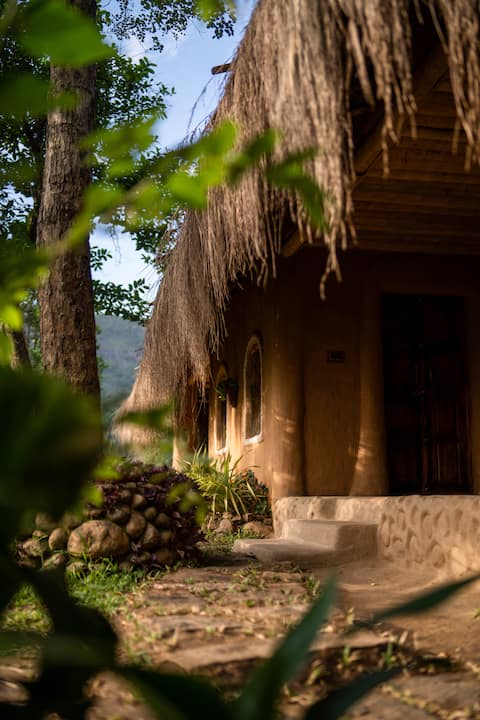
Cob 1 by The Mudhouse Marayoo
Entire Place • 1 bedroom

Cottage for Family - Munnar's Hidden Magic
Entire Place • 3 bedrooms
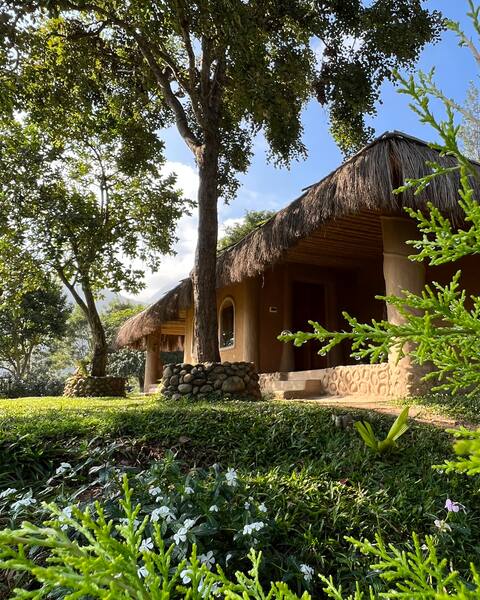
Cob 2 by The Mudhouse Marayoor
Entire Place • 1 bedroom

heavenvalleys tree house munnar mankulam road
Private Room • 2 bedrooms
Note: Performance varies based on location, size, amenities, seasonality, and management quality. Data reflects the past 12 months.
Top Performing Airbnb Hosts in Munnar (2026)
Learn from the best! This table showcases top-performing Airbnb hosts in Munnar based on the number of properties managed and estimated total revenue over the past year. Analyze their scale and performance metrics.
| Host Name | Properties | Grossing Revenue | Stay Reviews | Avg Rating |
|---|---|---|---|---|
| Roopa | 4 | $115,063 | 399 | 4.84/5.0 |
| Vinitha | 3 | $24,072 | 59 | 4.76/5.0 |
| Senthil Kumar | 2 | $12,072 | 110 | 4.84/5.0 |
| Haseeb | 2 | $11,463 | 5 | 4.75/5.0 |
| Shyam | 5 | $11,319 | 782 | 4.46/5.0 |
| Jomon Joseph | 1 | $11,066 | 67 | 4.93/5.0 |
| Manu | 2 | $7,128 | 130 | 4.77/5.0 |
| Henry | 1 | $5,288 | 6 | 4.17/5.0 |
| Shanu | 2 | $4,382 | 17 | 3.73/5.0 |
| Joseph Jitty | 3 | $3,297 | 53 | 4.94/5.0 |
Analyzing the strategies of top hosts, such as their property selection, pricing, and guest communication, can offer valuable lessons for optimizing your own Airbnb operations in Munnar.
Dive Deeper: Advanced Munnar STR Market Data (2026)
Ready to unlock more insights? AirROI provides access to advanced metrics and comprehensive Airbnb data for Munnar. Explore detailed analytics beyond this report to refine your investment strategy, optimize pricing, and maximize your vacation rental profits.
Explore Advanced MetricsMunnar Short-Term Rental Market Composition (2026): Property & Room Types
Room Type Distribution
Property Type Distribution
Market Composition Insights for Munnar
- The Munnar Airbnb market composition is heavily skewed towards Private Room listings, which make up 57.5% of the 40 active rentals. This indicates strong guest preference for privacy and space.
- Looking at the property type distribution in Munnar, House properties are the most common (55%), reflecting the local real estate landscape.
- Houses represent a significant 55% portion, catering likely to families or larger groups.
- The presence of 30% Hotel/Boutique listings indicates integration with traditional hospitality.
- Smaller segments like outdoor/unique, apartment/condo (combined 5.0%) offer potential for unique stay experiences.
Munnar Airbnb Room Capacity Analysis (2026): Bedroom Distribution
Distribution of Listings by Number of Bedrooms
Room Capacity Insights for Munnar
- The dominant room capacity in Munnar is 1 bedroom listings, making up 42.5% of the market. This suggests a strong demand for properties suitable for couples or solo travelers.
- Together, 1 bedroom and 3 bedrooms properties represent 55.0% of the active Airbnb listings in Munnar, indicating a high concentration in these sizes.
- A significant 22.5% of listings offer 3+ bedrooms, catering to larger groups and families seeking more space in Munnar.
Munnar Vacation Rental Guest Capacity Trends (2026)
Distribution of Listings by Guest Capacity
Guest Capacity Insights for Munnar
- The most common guest capacity trend in Munnar vacation rentals is listings accommodating 2 guests (22.5%). This suggests the primary traveler segment is likely couples or solo travelers.
- Properties designed for 2 guests and 8+ guests dominate the Munnar STR market, accounting for 42.5% of listings.
- 27.5% of properties accommodate 6+ guests, serving the market segment for larger families or group travel in Munnar.
- On average, properties in Munnar are equipped to host 3.1 guests.
Munnar Airbnb Booking Patterns (2026): Available vs. Booked Days
Available Days Distribution
Booked Days Distribution
Booking Pattern Insights for Munnar
- The most common availability pattern in Munnar falls within the 271-366 days range, representing 82.5% of listings. This suggests many properties have significant open periods on their calendars.
- Approximately 92.5% of listings show high availability (181+ days open annually), indicating potential for increased bookings or specific owner usage patterns.
- For booked days, the 1-30 days range is most frequent in Munnar (45%), reflecting common guest stay durations or potential owner blocking patterns.
- A notable 7.5% of properties secure long booking periods (181+ days booked per year), highlighting successful long-term rental strategies or significant owner usage.
Munnar Airbnb Minimum Stay Requirements Analysis
Distribution of Listings by Minimum Night Requirement
1 Night
39 listings
97.5% of total
30+ Nights
1 listings
2.5% of total
Key Insights
- The most prevalent minimum stay requirement in Munnar is 1 Night, adopted by 97.5% of listings. This highlights the market's preference for shorter, flexible bookings.
- A strong majority (97.5%) of the Munnar Airbnb data shows acceptance of very short stays (1-2 nights), indicating a dynamic, high-turnover market.
- Dedicated monthly rentals (30+ nights) represent a small niche (2.5%), possibly an untapped area for hosts.
Recommendations
- Align with the market by considering a 1 Night minimum stay, as 97.5% of Munnar hosts use this setting.
- Adjust minimum nights based on seasonality – potentially shorter during low season and longer during peak demand periods in Munnar.
Munnar Airbnb Cancellation Policy Trends Analysis (2026)
Limited
1 listings
2.6% of total
Flexible
8 listings
20.5% of total
Moderate
16 listings
41% of total
Firm
9 listings
23.1% of total
Strict
5 listings
12.8% of total
Cancellation Policy Insights for Munnar
- The prevailing Airbnb cancellation policy trend in Munnar is Moderate, used by 41% of listings.
- There's a relatively balanced mix between guest-friendly (61.5%) and stricter (35.9%) policies, offering choices for different guest needs.
Recommendations for Hosts
- Consider adopting a Moderate policy to align with the 41% market standard in Munnar.
- Using a Strict policy might deter some guests, as only 12.8% of listings use it. Evaluate if potential revenue protection outweighs possible lower booking rates.
- Regularly review your cancellation policy against competitors and market demand shifts in Munnar.
Munnar STR Booking Lead Time Analysis (2026)
Average Booking Lead Time by Month
Booking Lead Time Insights for Munnar
- The overall average booking lead time for vacation rentals in Munnar is 16 days.
- Guests book furthest in advance for stays during January (average 28 days), likely coinciding with peak travel demand or local events.
- The shortest booking windows occur for stays in July (average 8 days), indicating more last-minute travel plans during this time.
- Seasonally, Winter (22 days avg.) sees the longest lead times, while Summer (11 days avg.) has the shortest, reflecting typical travel planning cycles.
Recommendations for Hosts
- Use the overall average lead time (16 days) as a baseline for your pricing and availability strategy in Munnar.
- For January stays, consider implementing length-of-stay discounts or slightly higher rates for bookings made less than 28 days out to capitalize on advance planning.
- During July, focus on last-minute booking availability and promotions, as guests book with very short notice (8 days avg.).
- Target marketing efforts for the Winter season well in advance (at least 22 days) to capture early planners.
- Monitor your own booking lead times against these Munnar averages to identify opportunities for dynamic pricing adjustments.
Popular & Essential Airbnb Amenities in Munnar (2026)
Amenity Prevalence
Amenity Insights for Munnar
- Popular amenities like Wifi, Free parking on premises, Essentials are common but not universal. Offering these can provide a competitive edge.
- Warning: Wifi is not universally provided but is considered essential globally. Ensure reliable Wifi is offered.
Recommendations for Hosts
- Consider adding popular differentiators like Wifi or Free parking on premises to increase appeal.
- Highlight unique or less common amenities you offer (e.g., hot tub, dedicated workspace, EV charger) in your listing description and photos.
- Regularly check competitor amenities in Munnar to stay competitive.
Munnar Airbnb Guest Demographics & Profile Analysis (2026)
Guest Profile Summary for Munnar
- The typical guest profile for Airbnb in Munnar consists of a mix of domestic (46%) and international guests, with top international origins including United States, typically belonging to the Post-2000s (Gen Z/Alpha) group (50%), primarily speaking English or Hindi.
- Domestic travelers account for 45.7% of guests.
- Key international markets include India (45.7%) and United States (11.4%).
- Top languages spoken are English (41.7%) followed by Hindi (26.2%).
- A significant demographic segment is the Post-2000s (Gen Z/Alpha) group, representing 50% of guests.
Recommendations for Hosts
- Balance marketing efforts between domestic and international channels based on the guest mix.
- Tailor amenities and listing descriptions to appeal to the dominant Post-2000s (Gen Z/Alpha) demographic (e.g., highlight fast WiFi, smart home features, local guides).
- Highlight unique local experiences or amenities relevant to the primary guest profile.
- Consider seasonal promotions aligned with peak travel times for key origin markets.
Nearby Short-Term Rental Market Comparison
How does the Munnar Airbnb market stack up against its neighbors? Compare key performance metrics like average monthly revenue, ADR, and occupancy rates in surrounding areas to understand the broader regional STR landscape.
| Market | Active Properties | Monthly Revenue | Daily Rate | Avg. Occupancy |
|---|---|---|---|---|
| Munambam | 10 | $1,444 | $118.22 | 35% |
| Muhamma | 10 | $935 | $233.98 | 20% |
| Pothamedu | 13 | $920 | $128.46 | 26% |
| Vilpatti | 42 | $721 | $102.89 | 28% |
| Adimali | 11 | $677 | $83.99 | 31% |
| Ambalappuzha | 11 | $674 | $112.64 | 25% |
| Achanakal hatty | 15 | $667 | $77.56 | 29% |
| Lovedale | 17 | $634 | $150.15 | 22% |
| Udhagamandalam | 203 | $621 | $100.87 | 23% |
| Vazhikadavu | 12 | $528 | $83.81 | 24% |