Edava Airbnb Market Analysis 2026: Short Term Rental Data & Vacation Rental Statistics in Kerala, India
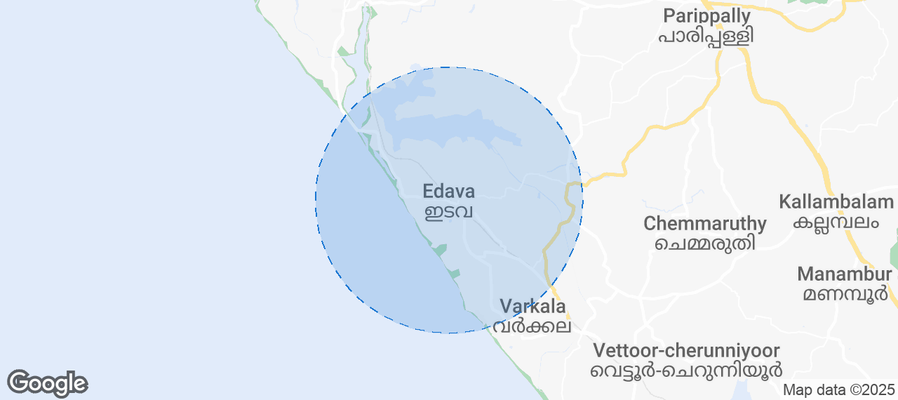
Is Airbnb profitable in Edava in 2026? Explore comprehensive Airbnb analytics for Edava, Kerala, India to uncover income potential. This 2026 STR market report for Edava, based on AirROI data from February 2025 to January 2026, reveals key trends in the niche market of 19 active listings.
Whether you're considering an Airbnb investment in Edava, optimizing your existing vacation rental, or exploring rental arbitrage opportunities, understanding the Edava Airbnb data is crucial. Leveraging the low regulation environment is key to maximizing your short term rental income potential. Let's dive into the specifics.
Key Edava Airbnb Performance Metrics Overview
Monthly Airbnb Revenue Variations & Income Potential in Edava (2026)
Understanding the monthly revenue variations for Airbnb listings in Edava is key to maximizing your short term rental income potential. Seasonality significantly impacts earnings. Our analysis, based on data from the past 12 months, shows that the peak revenue month for STRs in Edava is typically February, while July often presents the lowest earnings, highlighting opportunities for strategic pricing adjustments during shoulder and low seasons. Explore the typical Airbnb income in Edava across different performance tiers:
- Best-in-class properties (Top 10%) achieve $3,218+ monthly, often utilizing dynamic pricing and superior guest experiences.
- Strong performing properties (Top 25%) earn $1,466 or more, indicating effective management and desirable locations/amenities.
- Typical properties (Median) generate around $758 per month, representing the average market performance.
- Entry-level properties (Bottom 25%) see earnings around $368, often with potential for optimization.
Average Monthly Airbnb Earnings Trend in Edava
Edava Airbnb Occupancy Rate Trends (2026)
Maximize your bookings by understanding the Edava STR occupancy trends. Seasonal demand shifts significantly influence how often properties are booked. Typically, Decembersees the highest demand (peak season occupancy), while June experiences the lowest (low season). Effective strategies, like adjusting minimum stays or offering promotions, can boost occupancy during slower periods. Here's how different property tiers perform in Edava:
- Best-in-class properties (Top 10%) achieve 58%+ occupancy, indicating high desirability and potentially optimized availability.
- Strong performing properties (Top 25%) maintain 41% or higher occupancy, suggesting good market fit and guest satisfaction.
- Typical properties (Median) have an occupancy rate around 30%.
- Entry-level properties (Bottom 25%) average 18% occupancy, potentially facing higher vacancy.
Average Monthly Occupancy Rate Trend in Edava
Average Daily Rate (ADR) Airbnb Trends in Edava (2026)
Effective short term rental pricing strategy in Edava involves understanding monthly ADR fluctuations. The Average Daily Rate (ADR) for Airbnb in Edava typically peaks in February and dips lowest during September. Leveraging Airbnb dynamic pricing tools or strategies based on this seasonality can significantly boost revenue. Here's a look at the typical nightly rates achieved:
- Best-in-class properties (Top 10%) command rates of $270+ per night, often due to premium features or locations.
- Strong performing properties (Top 25%) achieve nightly rates of $155 or more.
- Typical properties (Median) charge around $79 per night.
- Entry-level properties (Bottom 25%) earn around $50 per night.
Average Daily Rate (ADR) Trend by Month in Edava
Get Live Edava Market Intelligence 👇
Explore Real-time Analytics
Airbnb Seasonality Analysis & Trends in Edava (2026)
Peak Season (February, December, November)
- Revenue averages $1,873 per month
- Occupancy rates average 48.2%
- Daily rates average $115
Shoulder Season
- Revenue averages $1,156 per month
- Occupancy maintains around 30.0%
- Daily rates hold near $110
Low Season (April, June, July)
- Revenue drops to average $743 per month
- Occupancy decreases to average 20.2%
- Daily rates adjust to average $107
Seasonality Insights for Edava
- The Airbnb seasonality in Edava shows highly seasonal trends requiring careful strategy. While the sections above show seasonal averages, it's also insightful to look at the extremes:
- During the high season, the absolute peak month showcases Edava's highest earning potential, with monthly revenues capable of climbing to $2,329, occupancy reaching a high of 55.6%, and ADRs peaking at $134.
- Conversely, the slowest single month of the year, typically falling within the low season, marks the market's lowest point. In this month, revenue might dip to $689, occupancy could drop to 16.7%, and ADRs may adjust down to $99.
- Understanding both the seasonal averages and these monthly peaks and troughs in revenue, occupancy, and ADR is crucial for maximizing your Airbnb profit potential in Edava.
Seasonal Strategies for Maximizing Profit
- Peak Season: Maximize revenue through premium pricing and potentially longer minimum stays. Ensure high availability.
- Low Season: Offer competitive pricing, special promotions (e.g., extended stay discounts), and flexible cancellation policies. Target off-season travelers like remote workers or budget-conscious guests.
- Shoulder Seasons: Implement dynamic pricing that balances peak and low rates. Target weekend travelers or specific events. Offer slightly more flexible terms than peak season.
- Regularly analyze your own performance against these Edava seasonality benchmarks and adjust your pricing and availability strategy accordingly.
Best Areas for Airbnb Investment in Edava (2026)
Exploring the top neighborhoods for short-term rentals in Edava? This section highlights key areas, outlining why they are attractive for hosts and guests, along with notable local attractions. Consider these locations based on your target guest profile and investment strategy.
| Neighborhood / Area | Why Host Here? (Target Guests & Appeal) | Key Attractions & Landmarks |
|---|---|---|
| Kappil Beach | A beautiful and serene beach with golden sand and coconut palms, Kappil Beach is perfect for tourists looking for relaxation and scenic views. It's still relatively less commercialized compared to other beaches, providing a peaceful experience. | Kappil Beach, Kappil River, Backwater cruises, Nearby resorts, Local seafood shacks |
| Edava Beach | Known for its calm and quiet ambiance, Edava Beach attracts visitors who prefer a less crowded beach experience. It's ideal for swimming and sunbathing, making it a great spot for family vacations. | Edava Beach, Local fishing villages, Sunset views, Water sports, Nature trails |
| Varkala Cliff | Famous for its stunning cliffs and beaches, Varkala is popular among backpackers and tourists. The cliffs offer breathtaking views of the Arabian Sea and are lined with cafes and shops. | Varkala Beach, Papanasam Beach, Janardhana Swamy Temple, Cliffside cafes, Ayurvedic spas |
| Paravur Lake | A tranquil spot perfect for nature lovers, Paravur Lake offers opportunities for boating and sightseeing in a natural setting away from the hustle and bustle. | Paravur Lake, Backwater tours, Fishing villages, Local birdwatching spots, Coconut groves |
| Anjengo Fort | This historical site is an attractor for tourists interested in history and culture. The remnants of the fort offer a glimpse into the colonial past of Kerala. | Anjengo Fort, Nearby beach, Historical significance, Local festivals, Scenic views |
| Kaduvinal Palli | A lesser-known area with beautiful natural landscapes, it appeals to eco-tourists and those seeking peace and tranquility in the Kerala backwaters. | Nature walks, Local villages, Traditional Kerala houses, Canoeing, Bird watching |
| Puthenthope Beach | A quiet beach located south of Thiruvananthapuram, it's great for those seeking solitude and relaxation, away from commercial beach tourism. | Puthenthope Beach, Sunrises, Fishing boats, Local cafes, Coconut groves |
| Sivagiri Mutt | This spiritual center attracts many visitors for its ashram and serene surroundings. It has cultural and religious significance, drawing pilgrims and tourists alike. | Sivagiri Mutt, Varkala Beach, Meditation centers, Festivals, Spiritual retreats |
Understanding Airbnb License Requirements & STR Laws in Edava (2026)
While Edava, Kerala, India currently shows low STR regulations, specific Airbnb license requirements might still exist or change. Always verify the latest short term rental regulations and Airbnb license requirements directly with local government authorities for Edava to ensure full compliance before hosting.
(Source: AirROI data, 2026, finding no licensed listings among those analyzed)
Top Performing Airbnb Properties in Edava (2026)
Benchmark your potential! Explore examples of top-performing Airbnb properties in Edavabased on Trailing Twelve Month (TTM) revenue. Analyze their characteristics, revenue, occupancy rate, and ADR to understand what drives success in this market.
Coconut Cove- Luxury 4BR Beach Villa Varkala
Entire Place • 4 bedrooms
Baywatch - Luxury 3BR beach villa in Varkala
Entire Place • 3 bedrooms
Cliffside - Luxury 2BR Beach villa in Varkala
Entire Place • 2 bedrooms
Honeymoon suite - Private 1BH
Entire Place • 1 bedroom
1BR Sea side room Varkala
Private Room • N/A
Sea-facing 1 bedroom top floor in villa,varkala
Private Room • N/A
Note: Performance varies based on location, size, amenities, seasonality, and management quality. Data reflects the past 12 months.
Top Performing Airbnb Hosts in Edava (2026)
Learn from the best! This table showcases top-performing Airbnb hosts in Edava based on the number of properties managed and estimated total revenue over the past year. Analyze their scale and performance metrics.
| Host Name | Properties | Grossing Revenue | Stay Reviews | Avg Rating |
|---|---|---|---|---|
| William | 7 | $170,002 | 283 | 4.55/5.0 |
| Govind | 3 | $26,442 | 46 | 4.61/5.0 |
| Voye Homes | 2 | $19,222 | 23 | 4.50/5.0 |
| Madhav Mansion | 3 | $7,680 | 9 | 5.00/5.0 |
| Bhaskaran | 1 | $6,071 | 116 | 4.97/5.0 |
| Muhajir | 2 | $3,271 | 17 | 4.79/5.0 |
| Shivani | 1 | $371 | 4 | 5.00/5.0 |
Analyzing the strategies of top hosts, such as their property selection, pricing, and guest communication, can offer valuable lessons for optimizing your own Airbnb operations in Edava.
Dive Deeper: Advanced Edava STR Market Data (2026)
Ready to unlock more insights? AirROI provides access to advanced metrics and comprehensive Airbnb data for Edava. Explore detailed analytics beyond this report to refine your investment strategy, optimize pricing, and maximize your vacation rental profits.
Explore Advanced MetricsEdava Short-Term Rental Market Composition (2026): Property & Room Types
Room Type Distribution
Property Type Distribution
Market Composition Insights for Edava
- The Edava Airbnb market composition is heavily skewed towards Entire Home/Apt listings, which make up 52.6% of the 19 active rentals. This indicates strong guest preference for privacy and space.
- However, a notable 47.4% share for Private Rooms suggests opportunities for budget-conscious travelers or hosts renting out spare rooms.
- Looking at the property type distribution in Edava, House properties are the most common (78.9%), reflecting the local real estate landscape.
- Houses represent a significant 78.9% portion, catering likely to families or larger groups.
- The presence of 21.1% Hotel/Boutique listings indicates integration with traditional hospitality.
Edava Airbnb Room Capacity Analysis (2026): Bedroom Distribution
Distribution of Listings by Number of Bedrooms
Room Capacity Insights for Edava
- The dominant room capacity in Edava is 1 bedroom listings, making up 31.6% of the market. This suggests a strong demand for properties suitable for couples or solo travelers.
- Together, 1 bedroom and 2 bedrooms properties represent 47.4% of the active Airbnb listings in Edava, indicating a high concentration in these sizes.
- A significant 26.3% of listings offer 3+ bedrooms, catering to larger groups and families seeking more space in Edava.
Edava Vacation Rental Guest Capacity Trends (2026)
Distribution of Listings by Guest Capacity
Guest Capacity Insights for Edava
- The most common guest capacity trend in Edava vacation rentals is listings accommodating 2 guests (36.8%). This suggests the primary traveler segment is likely couples or solo travelers.
- Properties designed for 2 guests and 6 guests dominate the Edava STR market, accounting for 47.3% of listings.
- A significant 42.1% of listings cater specifically to 1-2 guests, highlighting strong demand from couples and solo travelers in Edava.
- 26.3% of properties accommodate 6+ guests, serving the market segment for larger families or group travel in Edava.
- On average, properties in Edava are equipped to host 3.0 guests.
Edava Airbnb Booking Patterns (2026): Available vs. Booked Days
Available Days Distribution
Booked Days Distribution
Booking Pattern Insights for Edava
- The most common availability pattern in Edava falls within the 271-366 days range, representing 52.6% of listings. This suggests many properties have significant open periods on their calendars.
- Approximately 94.7% of listings show high availability (181+ days open annually), indicating potential for increased bookings or specific owner usage patterns.
- For booked days, the 31-90 days range is most frequent in Edava (42.1%), reflecting common guest stay durations or potential owner blocking patterns.
- A notable 10.5% of properties secure long booking periods (181+ days booked per year), highlighting successful long-term rental strategies or significant owner usage.
Edava Airbnb Minimum Stay Requirements Analysis
Distribution of Listings by Minimum Night Requirement
1 Night
17 listings
89.5% of total
30+ Nights
2 listings
10.5% of total
Key Insights
- The most prevalent minimum stay requirement in Edava is 1 Night, adopted by 89.5% of listings. This highlights the market's preference for shorter, flexible bookings.
- A strong majority (89.5%) of the Edava Airbnb data shows acceptance of very short stays (1-2 nights), indicating a dynamic, high-turnover market.
- A significant segment (10.5%) caters to monthly stays (30+ nights) in Edava, pointing to opportunities in the extended-stay market.
Recommendations
- Align with the market by considering a 1 Night minimum stay, as 89.5% of Edava hosts use this setting.
- Explore offering discounts for stays of 30+ nights to attract the 10.5% of the market seeking extended stays.
- Adjust minimum nights based on seasonality – potentially shorter during low season and longer during peak demand periods in Edava.
Edava Airbnb Cancellation Policy Trends Analysis (2026)
Flexible
8 listings
42.1% of total
Moderate
7 listings
36.8% of total
Firm
4 listings
21.1% of total
Cancellation Policy Insights for Edava
- The prevailing Airbnb cancellation policy trend in Edava is Flexible, used by 42.1% of listings.
- The market strongly favors guest-friendly terms, with 78.9% of listings offering Flexible or Moderate policies. This suggests guests in Edava may expect booking flexibility.
Recommendations for Hosts
- Consider adopting a Flexible policy to align with the 42.1% market standard in Edava.
- Regularly review your cancellation policy against competitors and market demand shifts in Edava.
Edava STR Booking Lead Time Analysis (2026)
Average Booking Lead Time by Month
Booking Lead Time Insights for Edava
- The overall average booking lead time for vacation rentals in Edava is 29 days.
- Guests book furthest in advance for stays during December (average 42 days), likely coinciding with peak travel demand or local events.
- The shortest booking windows occur for stays in June (average 11 days), indicating more last-minute travel plans during this time.
- Seasonally, Winter (34 days avg.) sees the longest lead times, while Summer (16 days avg.) has the shortest, reflecting typical travel planning cycles.
Recommendations for Hosts
- Use the overall average lead time (29 days) as a baseline for your pricing and availability strategy in Edava.
- For December stays, consider implementing length-of-stay discounts or slightly higher rates for bookings made less than 42 days out to capitalize on advance planning.
- During June, focus on last-minute booking availability and promotions, as guests book with very short notice (11 days avg.).
- Target marketing efforts for the Winter season well in advance (at least 34 days) to capture early planners.
- Monitor your own booking lead times against these Edava averages to identify opportunities for dynamic pricing adjustments.
Popular & Essential Airbnb Amenities in Edava (2026)
Amenity Prevalence
Amenity Insights for Edava
- Essential amenities in Edava that guests expect include: Air conditioning, Wifi. Lacking these (any) could significantly impact bookings.
- Popular amenities like Free parking on premises, Beach access, Dedicated workspace are common but not universal. Offering these can provide a competitive edge.
Recommendations for Hosts
- Ensure your listing includes all essential amenities for Edava: Air conditioning, Wifi.
- Consider adding popular differentiators like Free parking on premises or Beach access to increase appeal.
- Highlight unique or less common amenities you offer (e.g., hot tub, dedicated workspace, EV charger) in your listing description and photos.
- Regularly check competitor amenities in Edava to stay competitive.
Edava Airbnb Guest Demographics & Profile Analysis (2026)
Guest Profile Summary for Edava
- The typical guest profile for Airbnb in Edava consists of primarily domestic travelers (74%), often arriving from nearby Bengaluru, typically belonging to the Post-2000s (Gen Z/Alpha) group (50%), primarily speaking English or Hindi.
- Domestic travelers account for 73.7% of guests.
- Key international markets include India (73.7%) and United States (7.9%).
- Top languages spoken are English (46.2%) followed by Hindi (35.9%).
- A significant demographic segment is the Post-2000s (Gen Z/Alpha) group, representing 50% of guests.
Recommendations for Hosts
- Target domestic marketing efforts towards travelers from Bengaluru and Mumbai.
- Tailor amenities and listing descriptions to appeal to the dominant Post-2000s (Gen Z/Alpha) demographic (e.g., highlight fast WiFi, smart home features, local guides).
- Highlight unique local experiences or amenities relevant to the primary guest profile.
- Consider seasonal promotions aligned with peak travel times for key origin markets.
Nearby Short-Term Rental Market Comparison
How does the Edava Airbnb market stack up against its neighbors? Compare key performance metrics like average monthly revenue, ADR, and occupancy rates in surrounding areas to understand the broader regional STR landscape.
| Market | Active Properties | Monthly Revenue | Daily Rate | Avg. Occupancy |
|---|---|---|---|---|
| Muhamma | 10 | $935 | $233.98 | 20% |
| Ambalappuzha | 11 | $674 | $112.64 | 25% |
| Vazhikadavu | 12 | $528 | $83.81 | 24% |
| Varkala | 212 | $456 | $64.79 | 29% |
| Poopalli | 14 | $447 | $145.43 | 18% |
| Chottupara | 11 | $415 | $109.04 | 18% |
| Kuttikkanam | 13 | $403 | $108.34 | 19% |
| Thrippunithura | 15 | $364 | $45.72 | 30% |
| Ernakulam | 310 | $361 | $50.47 | 30% |
| Kattoor | 13 | $347 | $105.78 | 24% |