Konchady Airbnb Market Analysis 2025: Short Term Rental Data & Vacation Rental Statistics in Karnataka, India
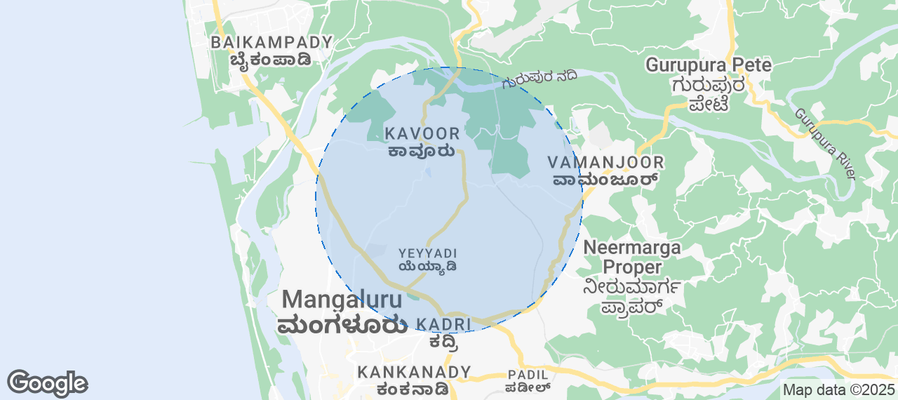
Is Airbnb profitable in Konchady in 2025? Explore comprehensive Airbnb analytics for Konchady, Karnataka, India to uncover income potential. This 2025 STR market report for Konchady, based on AirROI data from November 2024 to October 2025, reveals key trends in the niche market of 19 active listings.
Whether you're considering an Airbnb investment in Konchady, optimizing your existing vacation rental, or exploring rental arbitrage opportunities, understanding the Konchady Airbnb data is crucial. Leveraging the low regulation environment is key to maximizing your short term rental income potential. Let's dive into the specifics.
Key Konchady Airbnb Performance Metrics Overview
Monthly Airbnb Revenue Variations & Income Potential in Konchady (2025)
Understanding the monthly revenue variations for Airbnb listings in Konchady is key to maximizing your short term rental income potential. Seasonality significantly impacts earnings. Our analysis, based on data from the past 12 months, shows that the peak revenue month for STRs in Konchady is typically December, while June often presents the lowest earnings, highlighting opportunities for strategic pricing adjustments during shoulder and low seasons. Explore the typical Airbnb income in Konchady across different performance tiers:
- Best-in-class properties (Top 10%) achieve $797+ monthly, often utilizing dynamic pricing and superior guest experiences.
- Strong performing properties (Top 25%) earn $619 or more, indicating effective management and desirable locations/amenities.
- Typical properties (Median) generate around $388 per month, representing the average market performance.
- Entry-level properties (Bottom 25%) see earnings around $268, often with potential for optimization.
Average Monthly Airbnb Earnings Trend in Konchady
Konchady Airbnb Occupancy Rate Trends (2025)
Maximize your bookings by understanding the Konchady STR occupancy trends. Seasonal demand shifts significantly influence how often properties are booked. Typically, Decembersees the highest demand (peak season occupancy), while June experiences the lowest (low season). Effective strategies, like adjusting minimum stays or offering promotions, can boost occupancy during slower periods. Here's how different property tiers perform in Konchady:
- Best-in-class properties (Top 10%) achieve 75%+ occupancy, indicating high desirability and potentially optimized availability.
- Strong performing properties (Top 25%) maintain 54% or higher occupancy, suggesting good market fit and guest satisfaction.
- Typical properties (Median) have an occupancy rate around 38%.
- Entry-level properties (Bottom 25%) average 27% occupancy, potentially facing higher vacancy.
Average Monthly Occupancy Rate Trend in Konchady
Average Daily Rate (ADR) Airbnb Trends in Konchady (2025)
Effective short term rental pricing strategy in Konchady involves understanding monthly ADR fluctuations. The Average Daily Rate (ADR) for Airbnb in Konchady typically peaks in January and dips lowest during July. Leveraging Airbnb dynamic pricing tools or strategies based on this seasonality can significantly boost revenue. Here's a look at the typical nightly rates achieved:
- Best-in-class properties (Top 10%) command rates of $46+ per night, often due to premium features or locations.
- Strong performing properties (Top 25%) achieve nightly rates of $41 or more.
- Typical properties (Median) charge around $32 per night.
- Entry-level properties (Bottom 25%) earn around $30 per night.
Average Daily Rate (ADR) Trend by Month in Konchady
Get Live Konchady Market Intelligence 👇
Explore Real-time Analytics
Airbnb Seasonality Analysis & Trends in Konchady (2025)
Peak Season (December, April, May)
- Revenue averages $632 per month
- Occupancy rates average 57.5%
- Daily rates average $39
Shoulder Season
- Revenue averages $448 per month
- Occupancy maintains around 40.1%
- Daily rates hold near $39
Low Season (June, July, September)
- Revenue drops to average $315 per month
- Occupancy decreases to average 27.8%
- Daily rates adjust to average $38
Seasonality Insights for Konchady
- The Airbnb seasonality in Konchady shows highly seasonal trends requiring careful strategy. While the sections above show seasonal averages, it's also insightful to look at the extremes:
- During the high season, the absolute peak month showcases Konchady's highest earning potential, with monthly revenues capable of climbing to $711, occupancy reaching a high of 61.3%, and ADRs peaking at $40.
- Conversely, the slowest single month of the year, typically falling within the low season, marks the market's lowest point. In this month, revenue might dip to $243, occupancy could drop to 23.1%, and ADRs may adjust down to $37.
- Understanding both the seasonal averages and these monthly peaks and troughs in revenue, occupancy, and ADR is crucial for maximizing your Airbnb profit potential in Konchady.
Seasonal Strategies for Maximizing Profit
- Peak Season: Maximize revenue through premium pricing and potentially longer minimum stays. Ensure high availability.
- Low Season: Offer competitive pricing, special promotions (e.g., extended stay discounts), and flexible cancellation policies. Target off-season travelers like remote workers or budget-conscious guests.
- Shoulder Seasons: Implement dynamic pricing that balances peak and low rates. Target weekend travelers or specific events. Offer slightly more flexible terms than peak season.
- Regularly analyze your own performance against these Konchady seasonality benchmarks and adjust your pricing and availability strategy accordingly.
Best Areas for Airbnb Investment in Konchady (2025)
Exploring the top neighborhoods for short-term rentals in Konchady? This section highlights key areas, outlining why they are attractive for hosts and guests, along with notable local attractions. Consider these locations based on your target guest profile and investment strategy.
| Neighborhood / Area | Why Host Here? (Target Guests & Appeal) | Key Attractions & Landmarks |
|---|---|---|
| Kaup Beach | A picturesque beach famous for its stunning lighthouse and serene atmosphere, making it an ideal spot for travelers seeking relaxation and coastal beauty. | Kaup Lighthouse, Kaup Beach Park, Sankaranarayana Temple |
| Malpe Beach | A popular beach destination known for its water sports and lively atmosphere, perfect for tourists looking for adventure and leisure activities by the sea. | Malpe Beach, St. Mary's Island, Malpe Fishing Harbour, Kudlu Teertha Falls |
| Udupi | Known for its rich cultural heritage and temples, Udupi attracts pilgrims and tourists alike, making it a great area for hosting guests interested in exploring South Indian culture. | Sri Krishna Temple, Manipal End Point Park, Udupi Cuisine |
| Kundapura | A coastal town with beautiful beaches and a tranquil environment, ideal for guests who prefer a less crowded getaway while still enjoying the beauty of Karnataka’s coastline. | Kundapura Beach, 48th-Kadadi Beach, Balarama Temple |
| Sakleshpur | Nestled in the Western Ghats, this hill station is famous for its coffee plantations and scenic beauty, attracting nature lovers and adventure enthusiasts. | Manjarabad Fort, Bababudangiri, Coffe Plantations |
| Agumbe | Known as the 'Cherrapunji of the South', Agumbe is famous for its rainforests and biodiversity, drawing in visitors who are interested in ecological tourism and trekking. | Agumbe Rainforest Research Station, Onake Abbi Falls, Koodlu Theertha Falls |
| Coorg (Kodagu) | Famed for its coffee estates and natural beauty, Coorg is a prime destination for tourists seeking a getaway in lush green hills, making it perfect for Airbnb investments. | Abbey Falls, Raja's Seat, Dubare Elephant Camp |
| Hampi | A UNESCO World Heritage Site known for its ancient temples and ruins, Hampi attracts history enthusiasts and travelers looking for a unique experience in Karnataka. | Virupaksha Temple, Vijaya Vitthala Temple, Hampi Bazaar |
Understanding Airbnb License Requirements & STR Laws in Konchady (2025)
While Konchady, Karnataka, India currently shows low STR regulations, specific Airbnb license requirements might still exist or change. Always verify the latest short term rental regulations and Airbnb license requirements directly with local government authorities for Konchady to ensure full compliance before hosting.
(Source: AirROI data, 2025, finding no licensed listings among those analyzed)
Top Performing Airbnb Properties in Konchady (2025)
Benchmark your potential! Explore examples of top-performing Airbnb properties in Konchadybased on Trailing Twelve Month (TTM) revenue. Analyze their characteristics, revenue, occupancy rate, and ADR to understand what drives success in this market.
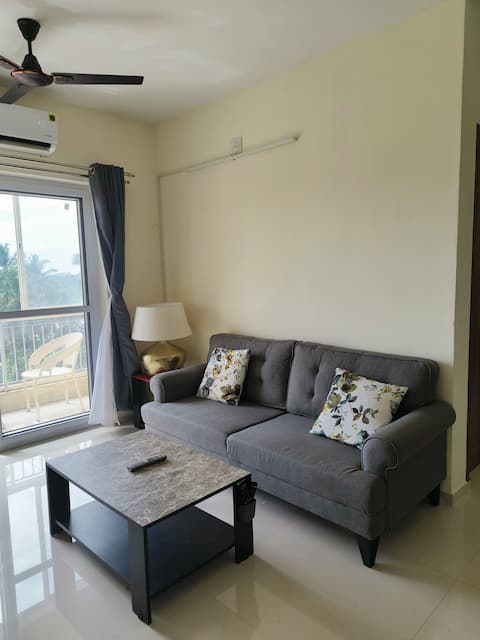
Luxury AC Apartment With Scenic Views Only Family
Entire Place • 2 bedrooms
2 BHK AC APARTMENT @LONG FIELD. YEYYADI.
Entire Place • 2 bedrooms
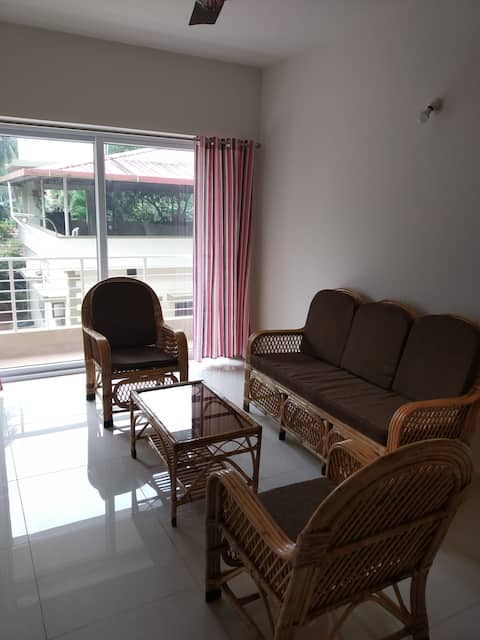
Sharanya - home away from home
Entire Place • 2 bedrooms
Home stay/service apartment Calm locality
Entire Place • 2 bedrooms
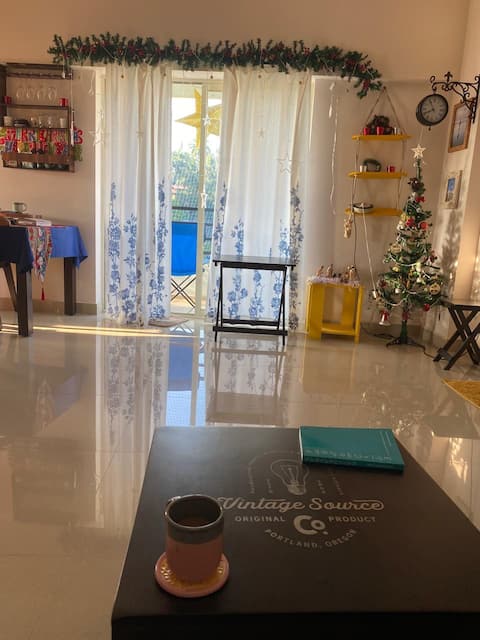
Longfield apartments; 2 BHK, well furnished flat
Entire Place • 2 bedrooms
Nirvana Stay, Furnished flat with AC for Family
Entire Place • 2 bedrooms
Note: Performance varies based on location, size, amenities, seasonality, and management quality. Data reflects the past 12 months.
Top Performing Airbnb Hosts in Konchady (2025)
Learn from the best! This table showcases top-performing Airbnb hosts in Konchady based on the number of properties managed and estimated total revenue over the past year. Analyze their scale and performance metrics.
| Host Name | Properties | Grossing Revenue | Stay Reviews | Avg Rating |
|---|---|---|---|---|
| Preethi | 4 | $18,452 | 155 | 4.90/5.0 |
| Rita | 2 | $10,865 | 147 | 4.95/5.0 |
| Donald | 3 | $9,204 | 185 | 4.87/5.0 |
| Archana Nayak | 1 | $8,204 | 71 | 4.90/5.0 |
| Jesintha | 1 | $8,137 | 61 | 4.85/5.0 |
| Janice | 1 | $8,030 | 14 | 5.00/5.0 |
| Nithesh | 1 | $7,772 | 69 | 4.91/5.0 |
| Vishnu Suryanarayan | 1 | $5,737 | 15 | 4.87/5.0 |
| Bellevue | 1 | $5,478 | 24 | 4.96/5.0 |
| Runa | 1 | $3,701 | 37 | 4.84/5.0 |
Analyzing the strategies of top hosts, such as their property selection, pricing, and guest communication, can offer valuable lessons for optimizing your own Airbnb operations in Konchady.
Dive Deeper: Advanced Konchady STR Market Data (2025)
Ready to unlock more insights? AirROI provides access to advanced metrics and comprehensive Airbnb data for Konchady. Explore detailed analytics beyond this report to refine your investment strategy, optimize pricing, and maximize your vacation rental profits.
Explore Advanced MetricsKonchady Short-Term Rental Market Composition (2025): Property & Room Types
Room Type Distribution
Property Type Distribution
Market Composition Insights for Konchady
- The Konchady Airbnb market composition is heavily skewed towards Entire Home/Apt listings, which make up 100% of the 19 active rentals. This indicates strong guest preference for privacy and space.
- Looking at the property type distribution in Konchady, Apartment/Condo properties are the most common (73.7%), reflecting the local real estate landscape.
- Houses represent a significant 21.1% portion, catering likely to families or larger groups.
- The presence of 5.3% Hotel/Boutique listings indicates integration with traditional hospitality.
Konchady Airbnb Room Capacity Analysis (2025): Bedroom Distribution
Distribution of Listings by Number of Bedrooms
Room Capacity Insights for Konchady
- The dominant room capacity in Konchady is 2 bedrooms listings, making up 78.9% of the market. This suggests a strong demand for properties suitable for couples or solo travelers.
- Together, 2 bedrooms and 3 bedrooms properties represent 100.0% of the active Airbnb listings in Konchady, indicating a high concentration in these sizes.
- A significant 21.1% of listings offer 3+ bedrooms, catering to larger groups and families seeking more space in Konchady.
Konchady Vacation Rental Guest Capacity Trends (2025)
Distribution of Listings by Guest Capacity
Guest Capacity Insights for Konchady
- The most common guest capacity trend in Konchady vacation rentals is listings accommodating 6 guests (47.4%). This suggests the primary traveler segment is likely larger groups.
- Properties designed for 6 guests and 8+ guests dominate the Konchady STR market, accounting for 73.7% of listings.
- 73.7% of properties accommodate 6+ guests, serving the market segment for larger families or group travel in Konchady.
- On average, properties in Konchady are equipped to host 6.0 guests.
Konchady Airbnb Booking Patterns (2025): Available vs. Booked Days
Available Days Distribution
Booked Days Distribution
Booking Pattern Insights for Konchady
- The most common availability pattern in Konchady falls within the 181-270 days range, representing 52.6% of listings. This suggests many properties have significant open periods on their calendars.
- Approximately 78.9% of listings show high availability (181+ days open annually), indicating potential for increased bookings or specific owner usage patterns.
- For booked days, the 91-180 days range is most frequent in Konchady (52.6%), reflecting common guest stay durations or potential owner blocking patterns.
- A notable 21.0% of properties secure long booking periods (181+ days booked per year), highlighting successful long-term rental strategies or significant owner usage.
Konchady Airbnb Minimum Stay Requirements Analysis
Distribution of Listings by Minimum Night Requirement
1 Night
14 listings
73.7% of total
2 Nights
2 listings
10.5% of total
3 Nights
2 listings
10.5% of total
4-6 Nights
1 listings
5.3% of total
Key Insights
- The most prevalent minimum stay requirement in Konchady is 1 Night, adopted by 73.7% of listings. This highlights the market's preference for shorter, flexible bookings.
- A strong majority (84.2%) of the Konchady Airbnb data shows acceptance of very short stays (1-2 nights), indicating a dynamic, high-turnover market.
Recommendations
- Align with the market by considering a 1 Night minimum stay, as 73.7% of Konchady hosts use this setting.
- Adjust minimum nights based on seasonality – potentially shorter during low season and longer during peak demand periods in Konchady.
Konchady Airbnb Cancellation Policy Trends Analysis (2025)
Flexible
5 listings
26.3% of total
Moderate
3 listings
15.8% of total
Firm
11 listings
57.9% of total
Cancellation Policy Insights for Konchady
- The prevailing Airbnb cancellation policy trend in Konchady is Firm, used by 57.9% of listings.
- A majority (57.9%) of hosts in Konchady utilize Firm or Strict policies, indicating a market where hosts prioritize booking security.
Recommendations for Hosts
- Consider adopting a Firm policy to align with the 57.9% market standard in Konchady.
- Regularly review your cancellation policy against competitors and market demand shifts in Konchady.
Konchady STR Booking Lead Time Analysis (2025)
Average Booking Lead Time by Month
Booking Lead Time Insights for Konchady
- The overall average booking lead time for vacation rentals in Konchady is 19 days.
- Guests book furthest in advance for stays during December (average 31 days), likely coinciding with peak travel demand or local events.
- The shortest booking windows occur for stays in July (average 9 days), indicating more last-minute travel plans during this time.
- Seasonally, Winter (24 days avg.) sees the longest lead times, while Summer (14 days avg.) has the shortest, reflecting typical travel planning cycles.
Recommendations for Hosts
- Use the overall average lead time (19 days) as a baseline for your pricing and availability strategy in Konchady.
- For December stays, consider implementing length-of-stay discounts or slightly higher rates for bookings made less than 31 days out to capitalize on advance planning.
- During July, focus on last-minute booking availability and promotions, as guests book with very short notice (9 days avg.).
- Target marketing efforts for the Winter season well in advance (at least 24 days) to capture early planners.
- Monitor your own booking lead times against these Konchady averages to identify opportunities for dynamic pricing adjustments.
Popular & Essential Airbnb Amenities in Konchady (2025)
Amenity Prevalence
Amenity Insights for Konchady
- Essential amenities in Konchady that guests expect include: Air conditioning, Refrigerator, Dishes and silverware, Kitchen, TV. Lacking these (any) could significantly impact bookings.
- Popular amenities like Washer, Hot water, Free parking on premises are common but not universal. Offering these can provide a competitive edge.
- Warning: Wifi is not universally provided but is considered essential globally. Ensure reliable Wifi is offered.
Recommendations for Hosts
- Ensure your listing includes all essential amenities for Konchady: Air conditioning, Refrigerator, Dishes and silverware, Kitchen, TV.
- Consider adding popular differentiators like Washer or Hot water to increase appeal.
- Highlight unique or less common amenities you offer (e.g., hot tub, dedicated workspace, EV charger) in your listing description and photos.
- Regularly check competitor amenities in Konchady to stay competitive.
Konchady Airbnb Guest Demographics & Profile Analysis (2025)
Guest Profile Summary for Konchady
- The typical guest profile for Airbnb in Konchady consists of primarily domestic travelers (86%), often arriving from nearby Bengaluru, typically belonging to the Post-2000s (Gen Z/Alpha) group (50%), primarily speaking English or Hindi.
- Domestic travelers account for 85.5% of guests.
- Key international markets include India (85.5%) and United States (4.8%).
- Top languages spoken are English (41.4%) followed by Hindi (31.4%).
- A significant demographic segment is the Post-2000s (Gen Z/Alpha) group, representing 50% of guests.
Recommendations for Hosts
- Target domestic marketing efforts towards travelers from Bengaluru and Mumbai.
- Tailor amenities and listing descriptions to appeal to the dominant Post-2000s (Gen Z/Alpha) demographic (e.g., highlight fast WiFi, smart home features, local guides).
- Highlight unique local experiences or amenities relevant to the primary guest profile.
- Consider seasonal promotions aligned with peak travel times for key origin markets.
Nearby Short-Term Rental Market Comparison
How does the Konchady Airbnb market stack up against its neighbors? Compare key performance metrics like average monthly revenue, ADR, and occupancy rates in surrounding areas to understand the broader regional STR landscape.
| Market | Active Properties | Monthly Revenue | Daily Rate | Avg. Occupancy |
|---|---|---|---|---|
| Suntikoppa | 12 | $1,772 | $240.07 | 23% |
| Hoode | 10 | $815 | $117.92 | 29% |
| Chemanchery | 10 | $641 | $98.85 | 24% |
| Tenka | 11 | $546 | $69.44 | 40% |
| Thottam | 10 | $454 | $125.54 | 25% |
| Madikeri | 224 | $371 | $64.05 | 24% |
| Udupi | 44 | $368 | $63.81 | 32% |
| Kozhikode | 46 | $361 | $67.32 | 26% |
| Mangaluru | 105 | $317 | $43.71 | 33% |
| Chikkamagaluru | 81 | $261 | $63.16 | 19% |