Bangalore Airbnb Market Analysis 2026: Short Term Rental Data & Vacation Rental Statistics in Karnataka, India
Is Airbnb profitable in Bangalore in 2026? Explore comprehensive Airbnb analytics for Bangalore, Karnataka, India to uncover income potential. This 2026 STR market report for Bangalore, based on AirROI data from February 2025 to January 2026, reveals key trends in the niche market of 83 active listings.
Whether you're considering an Airbnb investment in Bangalore, optimizing your existing vacation rental, or exploring rental arbitrage opportunities, understanding the Bangalore Airbnb data is crucial. Leveraging the low regulation environment is key to maximizing your short term rental income potential. Let's dive into the specifics.
Key Bangalore Airbnb Performance Metrics Overview
Monthly Airbnb Revenue Variations & Income Potential in Bangalore (2026)
Understanding the monthly revenue variations for Airbnb listings in Bangalore is key to maximizing your short term rental income potential. Seasonality significantly impacts earnings. Our analysis, based on data from the past 12 months, shows that the peak revenue month for STRs in Bangalore is typically February, while October often presents the lowest earnings, highlighting opportunities for strategic pricing adjustments during shoulder and low seasons. Explore the typical Airbnb income in Bangalore across different performance tiers:
- Best-in-class properties (Top 10%) achieve $633+ monthly, often utilizing dynamic pricing and superior guest experiences.
- Strong performing properties (Top 25%) earn $397 or more, indicating effective management and desirable locations/amenities.
- Typical properties (Median) generate around $207 per month, representing the average market performance.
- Entry-level properties (Bottom 25%) see earnings around $95, often with potential for optimization.
Average Monthly Airbnb Earnings Trend in Bangalore
Bangalore Airbnb Occupancy Rate Trends (2026)
Maximize your bookings by understanding the Bangalore STR occupancy trends. Seasonal demand shifts significantly influence how often properties are booked. Typically, Februarysees the highest demand (peak season occupancy), while October experiences the lowest (low season). Effective strategies, like adjusting minimum stays or offering promotions, can boost occupancy during slower periods. Here's how different property tiers perform in Bangalore:
- Best-in-class properties (Top 10%) achieve 73%+ occupancy, indicating high desirability and potentially optimized availability.
- Strong performing properties (Top 25%) maintain 52% or higher occupancy, suggesting good market fit and guest satisfaction.
- Typical properties (Median) have an occupancy rate around 28%.
- Entry-level properties (Bottom 25%) average 12% occupancy, potentially facing higher vacancy.
Average Monthly Occupancy Rate Trend in Bangalore
Average Daily Rate (ADR) Airbnb Trends in Bangalore (2026)
Effective short term rental pricing strategy in Bangalore involves understanding monthly ADR fluctuations. The Average Daily Rate (ADR) for Airbnb in Bangalore typically peaks in June and dips lowest during March. Leveraging Airbnb dynamic pricing tools or strategies based on this seasonality can significantly boost revenue. Here's a look at the typical nightly rates achieved:
- Best-in-class properties (Top 10%) command rates of $51+ per night, often due to premium features or locations.
- Strong performing properties (Top 25%) achieve nightly rates of $41 or more.
- Typical properties (Median) charge around $24 per night.
- Entry-level properties (Bottom 25%) earn around $18 per night.
Average Daily Rate (ADR) Trend by Month in Bangalore
Get Live Bangalore Market Intelligence 👇

Explore Real-time Analytics
Airbnb Seasonality Analysis & Trends in Bangalore (2026)
Peak Season (February, August, March)
- Revenue averages $372 per month
- Occupancy rates average 39.7%
- Daily rates average $31
Shoulder Season
- Revenue averages $290 per month
- Occupancy maintains around 35.2%
- Daily rates hold near $32
Low Season (January, October, November)
- Revenue drops to average $207 per month
- Occupancy decreases to average 26.0%
- Daily rates adjust to average $30
Seasonality Insights for Bangalore
- The Airbnb seasonality in Bangalore shows highly seasonal trends requiring careful strategy. While the sections above show seasonal averages, it's also insightful to look at the extremes:
- During the high season, the absolute peak month showcases Bangalore's highest earning potential, with monthly revenues capable of climbing to $403, occupancy reaching a high of 42.7%, and ADRs peaking at $33.
- Conversely, the slowest single month of the year, typically falling within the low season, marks the market's lowest point. In this month, revenue might dip to $170, occupancy could drop to 22.2%, and ADRs may adjust down to $30.
- Understanding both the seasonal averages and these monthly peaks and troughs in revenue, occupancy, and ADR is crucial for maximizing your Airbnb profit potential in Bangalore.
Seasonal Strategies for Maximizing Profit
- Peak Season: Maximize revenue through premium pricing and potentially longer minimum stays. Ensure high availability.
- Low Season: Offer competitive pricing, special promotions (e.g., extended stay discounts), and flexible cancellation policies. Target off-season travelers like remote workers or budget-conscious guests.
- Shoulder Seasons: Implement dynamic pricing that balances peak and low rates. Target weekend travelers or specific events. Offer slightly more flexible terms than peak season.
- Regularly analyze your own performance against these Bangalore seasonality benchmarks and adjust your pricing and availability strategy accordingly.
Best Areas for Airbnb Investment in Bangalore (2026)
Exploring the top neighborhoods for short-term rentals in Bangalore? This section highlights key areas, outlining why they are attractive for hosts and guests, along with notable local attractions. Consider these locations based on your target guest profile and investment strategy.
| Neighborhood / Area | Why Host Here? (Target Guests & Appeal) | Key Attractions & Landmarks |
|---|---|---|
| Indiranagar | Trendy neighborhood known for its upscale dining, nightlife, and boutique shopping. It attracts young professionals and expats, making it a prime location for short-term rentals. | Indiranagar 100 Feet Road, Brewsky, Toit Brewery, The Humming Tree, Shanti Nagar |
| Koramangala | Popular area among IT professionals, with many cafes and restaurants. It's one of the most sought-after neighborhoods for both short and long-term rentals due to its vibrant atmosphere. | Koramangala Indoor Stadium, Forum Mall, The 2 Sisters Cafe, The Humming Tree, Social |
| MG Road | Central location with easy accessibility to various attractions. A bustling commercial area preferred by tourists and business travelers. | Brigade Road, Landmark, UB City Mall, Cubbon Park, Vidhana Soudha |
| Whitefield | Known as a tech hub with several IT parks, it attracts business travelers. This area has also seen a growth in fine dining and shopping, making it a good Airbnb location. | Phoenix MarketCity, International Tech Park, Malleswaram, VR Bengaluru |
| Jayanagar | Residential and commercial mix that offers a more authentic local experience. Popular among families and slightly quieter than more central districts. | Ragigudda Anjaneya Temple, Jayanagar Shopping Complex, Narayana Rao Park, Jayanagar 4th Block |
| Bangalore Cantonment | Historical area with many heritage buildings and close to several attractions. It attracts a mix of locals and tourists. | Cubbon Park, Bangalore Palace, Vidhana Soudha |
| Sankey Tank | A scenic area known for its beautiful lake and parks. It offers a peaceful retreat away from the hustle and bustle, desired by travelers looking for a more serene environment. | Sankey Tank Park, Sankey Tank Boat Club, Shivaji Park |
| Ulsoor | Popular for its proximity to the city center and beautiful lake. It attracts both locals and tourists looking for a unique residential experience. | Ulsoor Lake, Halasuru Someshwara Temple, Mahatma Gandhi Road |
Understanding Airbnb License Requirements & STR Laws in Bangalore (2026)
While Bangalore, Karnataka, India currently shows low STR regulations, specific Airbnb license requirements might still exist or change. Always verify the latest short term rental regulations and Airbnb license requirements directly with local government authorities for Bangalore to ensure full compliance before hosting.
(Source: AirROI data, 2026, based on 4% licensed listings)
Top Performing Airbnb Properties in Bangalore (2026)
Benchmark your potential! Explore examples of top-performing Airbnb properties in Bangalorebased on Trailing Twelve Month (TTM) revenue. Analyze their characteristics, revenue, occupancy rate, and ADR to understand what drives success in this market.

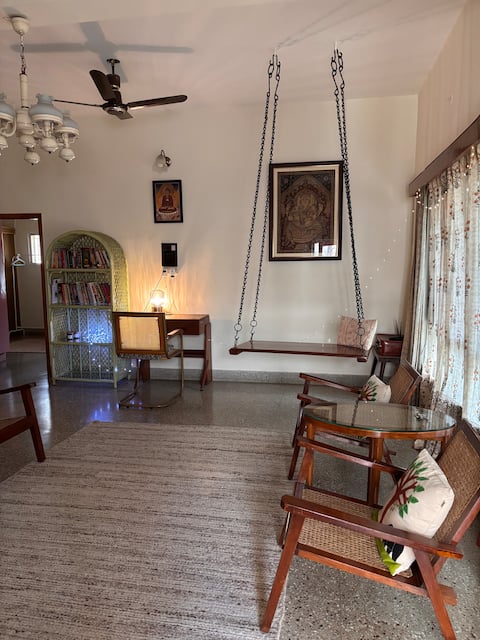
Refined Home with Terrace in Prime Location!
Entire Place • 2 bedrooms
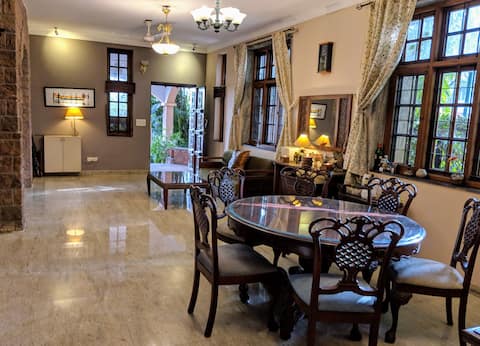
Spacious 1BHK in an 80s bungalow in South BLR
Entire Place • 1 bedroom
Capacious room in a dreamhouse w/ private balcony.
Private Room • N/A

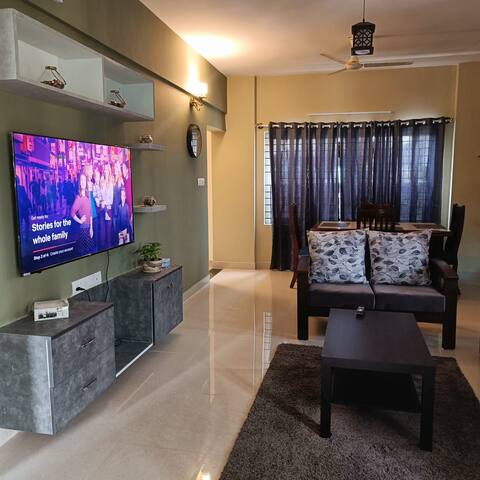
Downtown Delight 2 bhk Central Bangalore
Entire Place • 2 bedrooms
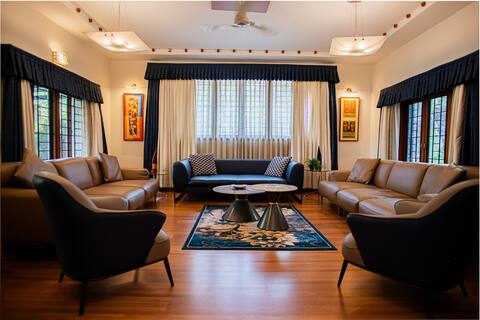
A Beautiful luxury house with a home theater
Entire Place • 4 bedrooms
Delightful Getaway with Terrace in Prime Location
Entire Place • 2 bedrooms
Note: Performance varies based on location, size, amenities, seasonality, and management quality. Data reflects the past 12 months.
Top Performing Airbnb Hosts in Bangalore (2026)
Learn from the best! This table showcases top-performing Airbnb hosts in Bangalore based on the number of properties managed and estimated total revenue over the past year. Analyze their scale and performance metrics.
| Host Name | Properties | Grossing Revenue | Stay Reviews | Avg Rating |
|---|---|---|---|---|
| Sumukha | 17 | $26,386 | 363 | 4.40/5.0 |
| Asgar | 11 | $26,285 | 2045 | 4.86/5.0 |
| Viswa | 12 | $25,305 | 73 | 4.78/5.0 |
| Susan | 2 | $15,857 | 197 | 4.89/5.0 |
| Vishnu Vardhan | 3 | $11,864 | 373 | 4.75/5.0 |
| Hema | 2 | $11,074 | 133 | 4.94/5.0 |
| Pooja | 3 | $8,668 | 81 | 4.81/5.0 |
| Alok | 1 | $7,685 | 143 | 4.92/5.0 |
| Mayura | 1 | $6,575 | 43 | 4.79/5.0 |
| Lalitha | 1 | $6,532 | 48 | 4.77/5.0 |
Analyzing the strategies of top hosts, such as their property selection, pricing, and guest communication, can offer valuable lessons for optimizing your own Airbnb operations in Bangalore.
Dive Deeper: Advanced Bangalore STR Market Data (2026)
Ready to unlock more insights? AirROI provides access to advanced metrics and comprehensive Airbnb data for Bangalore. Explore detailed analytics beyond this report to refine your investment strategy, optimize pricing, and maximize your vacation rental profits.
Explore Advanced MetricsBangalore Short-Term Rental Market Composition (2026): Property & Room Types
Room Type Distribution
Property Type Distribution
Market Composition Insights for Bangalore
- The Bangalore Airbnb market composition is heavily skewed towards Entire Home/Apt listings, which make up 89.2% of the 83 active rentals. This indicates strong guest preference for privacy and space.
- Looking at the property type distribution in Bangalore, Apartment/Condo properties are the most common (57.8%), reflecting the local real estate landscape.
- Houses represent a significant 36.1% portion, catering likely to families or larger groups.
- The presence of 6% Hotel/Boutique listings indicates integration with traditional hospitality.
Bangalore Airbnb Room Capacity Analysis (2026): Bedroom Distribution
Distribution of Listings by Number of Bedrooms
Room Capacity Insights for Bangalore
- The dominant room capacity in Bangalore is 1 bedroom listings, making up 61.4% of the market. This suggests a strong demand for properties suitable for couples or solo travelers.
- Together, 1 bedroom and 2 bedrooms properties represent 89.1% of the active Airbnb listings in Bangalore, indicating a high concentration in these sizes.
- With over half the market (61.4%) consisting of studios or 1-bedroom units, Bangalore is particularly well-suited for individuals or couples.
- Listings with 3+ bedrooms (4.8%) represent a smaller niche, potentially indicating an underserved market for larger group accommodations in Bangalore.
Bangalore Vacation Rental Guest Capacity Trends (2026)
Distribution of Listings by Guest Capacity
Guest Capacity Insights for Bangalore
- The most common guest capacity trend in Bangalore vacation rentals is listings accommodating 4 guests (31.3%). This suggests the primary traveler segment is likely small families or groups.
- Properties designed for 4 guests and 2 guests dominate the Bangalore STR market, accounting for 54.2% of listings.
- 14.4% of properties accommodate 6+ guests, serving the market segment for larger families or group travel in Bangalore.
- On average, properties in Bangalore are equipped to host 3.4 guests.
Bangalore Airbnb Booking Patterns (2026): Available vs. Booked Days
Available Days Distribution
Booked Days Distribution
Booking Pattern Insights for Bangalore
- The most common availability pattern in Bangalore falls within the 271-366 days range, representing 57.8% of listings. This suggests many properties have significant open periods on their calendars.
- Approximately 91.5% of listings show high availability (181+ days open annually), indicating potential for increased bookings or specific owner usage patterns.
- For booked days, the 91-180 days range is most frequent in Bangalore (36.1%), reflecting common guest stay durations or potential owner blocking patterns.
- A notable 8.4% of properties secure long booking periods (181+ days booked per year), highlighting successful long-term rental strategies or significant owner usage.
Bangalore Airbnb Minimum Stay Requirements Analysis
Distribution of Listings by Minimum Night Requirement
1 Night
59 listings
71.1% of total
2 Nights
10 listings
12% of total
3 Nights
1 listings
1.2% of total
30+ Nights
13 listings
15.7% of total
Key Insights
- The most prevalent minimum stay requirement in Bangalore is 1 Night, adopted by 71.1% of listings. This highlights the market's preference for shorter, flexible bookings.
- A strong majority (83.1%) of the Bangalore Airbnb data shows acceptance of very short stays (1-2 nights), indicating a dynamic, high-turnover market.
- A significant segment (15.7%) caters to monthly stays (30+ nights) in Bangalore, pointing to opportunities in the extended-stay market.
Recommendations
- Align with the market by considering a 1 Night minimum stay, as 71.1% of Bangalore hosts use this setting.
- Explore offering discounts for stays of 30+ nights to attract the 15.7% of the market seeking extended stays.
- Adjust minimum nights based on seasonality – potentially shorter during low season and longer during peak demand periods in Bangalore.
Bangalore Airbnb Cancellation Policy Trends Analysis (2026)
Limited
1 listings
1.2% of total
Flexible
27 listings
32.5% of total
Moderate
18 listings
21.7% of total
Firm
4 listings
4.8% of total
Strict
33 listings
39.8% of total
Cancellation Policy Insights for Bangalore
- The prevailing Airbnb cancellation policy trend in Bangalore is Strict, used by 39.8% of listings.
- There's a relatively balanced mix between guest-friendly (54.2%) and stricter (44.6%) policies, offering choices for different guest needs.
Recommendations for Hosts
- Consider adopting a Strict policy to align with the 39.8% market standard in Bangalore.
- With 39.8% using Strict terms, this is a viable option in Bangalore, particularly for high-value properties or during peak demand periods.
- Regularly review your cancellation policy against competitors and market demand shifts in Bangalore.
Bangalore STR Booking Lead Time Analysis (2026)
Average Booking Lead Time by Month
Booking Lead Time Insights for Bangalore
- The overall average booking lead time for vacation rentals in Bangalore is 10 days.
- Guests book furthest in advance for stays during August (average 25 days), likely coinciding with peak travel demand or local events.
- The shortest booking windows occur for stays in October (average 5 days), indicating more last-minute travel plans during this time.
- Seasonally, Summer (14 days avg.) sees the longest lead times, while Fall (6 days avg.) has the shortest, reflecting typical travel planning cycles.
Recommendations for Hosts
- Use the overall average lead time (10 days) as a baseline for your pricing and availability strategy in Bangalore.
- For August stays, consider implementing length-of-stay discounts or slightly higher rates for bookings made less than 25 days out to capitalize on advance planning.
- Target marketing efforts for the Summer season well in advance (at least 14 days) to capture early planners.
- Monitor your own booking lead times against these Bangalore averages to identify opportunities for dynamic pricing adjustments.
Popular & Essential Airbnb Amenities in Bangalore (2026)
Amenity Prevalence
Amenity Insights for Bangalore
- Essential amenities in Bangalore that guests expect include: Wifi. Lacking these (this) could significantly impact bookings.
- Popular amenities like Hot water, Kitchen, TV are common but not universal. Offering these can provide a competitive edge.
Recommendations for Hosts
- Ensure your listing includes all essential amenities for Bangalore: Wifi.
- Consider adding popular differentiators like Hot water or Kitchen to increase appeal.
- Highlight unique or less common amenities you offer (e.g., hot tub, dedicated workspace, EV charger) in your listing description and photos.
- Regularly check competitor amenities in Bangalore to stay competitive.
Bangalore Airbnb Guest Demographics & Profile Analysis (2026)
Guest Profile Summary for Bangalore
- The typical guest profile for Airbnb in Bangalore consists of primarily domestic travelers (81%), often arriving from nearby Bengaluru, typically belonging to the Post-2000s (Gen Z/Alpha) group (50%), primarily speaking English or Hindi.
- Domestic travelers account for 80.6% of guests.
- Key international markets include India (80.6%) and United States (8.8%).
- Top languages spoken are English (39.6%) followed by Hindi (27.9%).
- A significant demographic segment is the Post-2000s (Gen Z/Alpha) group, representing 50% of guests.
Recommendations for Hosts
- Target domestic marketing efforts towards travelers from Bengaluru and Chennai.
- Tailor amenities and listing descriptions to appeal to the dominant Post-2000s (Gen Z/Alpha) demographic (e.g., highlight fast WiFi, smart home features, local guides).
- Highlight unique local experiences or amenities relevant to the primary guest profile.
- Consider seasonal promotions aligned with peak travel times for key origin markets.
Nearby Short-Term Rental Market Comparison
How does the Bangalore Airbnb market stack up against its neighbors? Compare key performance metrics like average monthly revenue, ADR, and occupancy rates in surrounding areas to understand the broader regional STR landscape.
| Market | Active Properties | Monthly Revenue | Daily Rate | Avg. Occupancy |
|---|---|---|---|---|
| Kadirenahalli | 12 | $1,153 | $108.45 | 36% |
| Chikkabidarakallu | 10 | $794 | $491.62 | 28% |
| Achanakal hatty | 15 | $667 | $77.56 | 29% |
| Lovedale | 17 | $634 | $150.15 | 22% |
| Udhagamandalam | 203 | $621 | $100.87 | 23% |
| Coonoor | 61 | $515 | $103.42 | 24% |
| Yercaud | 79 | $472 | $110.48 | 20% |
| Vythiri | 223 | $416 | $84.04 | 20% |
| Kotagiri | 53 | $396 | $109.53 | 17% |
| Ooty | 35 | $380 | $98.29 | 20% |