Srinagar Airbnb Market Analysis 2026: Short Term Rental Data & Vacation Rental Statistics in Jammu and Kashmir, India
Is Airbnb profitable in Srinagar in 2026? Explore comprehensive Airbnb analytics for Srinagar, Jammu and Kashmir, India to uncover income potential. This 2026 STR market report for Srinagar, based on AirROI data from February 2025 to January 2026, reveals key trends in the market of 248 active listings.
Whether you're considering an Airbnb investment in Srinagar, optimizing your existing vacation rental, or exploring rental arbitrage opportunities, understanding the Srinagar Airbnb data is crucial. Leveraging the low regulation environment is key to maximizing your short term rental income potential. Let's dive into the specifics.
Key Srinagar Airbnb Performance Metrics Overview
Monthly Airbnb Revenue Variations & Income Potential in Srinagar (2026)
Understanding the monthly revenue variations for Airbnb listings in Srinagar is key to maximizing your short term rental income potential. Seasonality significantly impacts earnings. Our analysis, based on data from the past 12 months, shows that the peak revenue month for STRs in Srinagar is typically April, while November often presents the lowest earnings, highlighting opportunities for strategic pricing adjustments during shoulder and low seasons. Explore the typical Airbnb income in Srinagar across different performance tiers:
- Best-in-class properties (Top 10%) achieve $1,651+ monthly, often utilizing dynamic pricing and superior guest experiences.
- Strong performing properties (Top 25%) earn $790 or more, indicating effective management and desirable locations/amenities.
- Typical properties (Median) generate around $313 per month, representing the average market performance.
- Entry-level properties (Bottom 25%) see earnings around $130, often with potential for optimization.
Average Monthly Airbnb Earnings Trend in Srinagar
Srinagar Airbnb Occupancy Rate Trends (2026)
Maximize your bookings by understanding the Srinagar STR occupancy trends. Seasonal demand shifts significantly influence how often properties are booked. Typically, Aprilsees the highest demand (peak season occupancy), while November experiences the lowest (low season). Effective strategies, like adjusting minimum stays or offering promotions, can boost occupancy during slower periods. Here's how different property tiers perform in Srinagar:
- Best-in-class properties (Top 10%) achieve 53%+ occupancy, indicating high desirability and potentially optimized availability.
- Strong performing properties (Top 25%) maintain 34% or higher occupancy, suggesting good market fit and guest satisfaction.
- Typical properties (Median) have an occupancy rate around 20%.
- Entry-level properties (Bottom 25%) average 9% occupancy, potentially facing higher vacancy.
Average Monthly Occupancy Rate Trend in Srinagar
Average Daily Rate (ADR) Airbnb Trends in Srinagar (2026)
Effective short term rental pricing strategy in Srinagar involves understanding monthly ADR fluctuations. The Average Daily Rate (ADR) for Airbnb in Srinagar typically peaks in June and dips lowest during January. Leveraging Airbnb dynamic pricing tools or strategies based on this seasonality can significantly boost revenue. Here's a look at the typical nightly rates achieved:
- Best-in-class properties (Top 10%) command rates of $157+ per night, often due to premium features or locations.
- Strong performing properties (Top 25%) achieve nightly rates of $89 or more.
- Typical properties (Median) charge around $46 per night.
- Entry-level properties (Bottom 25%) earn around $27 per night.
Average Daily Rate (ADR) Trend by Month in Srinagar
Get Live Srinagar Market Intelligence 👇

Explore Real-time Analytics
Airbnb Seasonality Analysis & Trends in Srinagar (2026)
Peak Season (April, March, February)
- Revenue averages $921 per month
- Occupancy rates average 34.0%
- Daily rates average $94
Shoulder Season
- Revenue averages $610 per month
- Occupancy maintains around 21.5%
- Daily rates hold near $85
Low Season (January, July, November)
- Revenue drops to average $448 per month
- Occupancy decreases to average 19.3%
- Daily rates adjust to average $78
Seasonality Insights for Srinagar
- The Airbnb seasonality in Srinagar shows highly seasonal trends requiring careful strategy. While the sections above show seasonal averages, it's also insightful to look at the extremes:
- During the high season, the absolute peak month showcases Srinagar's highest earning potential, with monthly revenues capable of climbing to $1,143, occupancy reaching a high of 39.3%, and ADRs peaking at $100.
- Conversely, the slowest single month of the year, typically falling within the low season, marks the market's lowest point. In this month, revenue might dip to $415, occupancy could drop to 17.2%, and ADRs may adjust down to $71.
- Understanding both the seasonal averages and these monthly peaks and troughs in revenue, occupancy, and ADR is crucial for maximizing your Airbnb profit potential in Srinagar.
Seasonal Strategies for Maximizing Profit
- Peak Season: Maximize revenue through premium pricing and potentially longer minimum stays. Ensure high availability.
- Low Season: Offer competitive pricing, special promotions (e.g., extended stay discounts), and flexible cancellation policies. Target off-season travelers like remote workers or budget-conscious guests.
- Shoulder Seasons: Implement dynamic pricing that balances peak and low rates. Target weekend travelers or specific events. Offer slightly more flexible terms than peak season.
- Regularly analyze your own performance against these Srinagar seasonality benchmarks and adjust your pricing and availability strategy accordingly.
Best Areas for Airbnb Investment in Srinagar (2026)
Exploring the top neighborhoods for short-term rentals in Srinagar? This section highlights key areas, outlining why they are attractive for hosts and guests, along with notable local attractions. Consider these locations based on your target guest profile and investment strategy.
| Neighborhood / Area | Why Host Here? (Target Guests & Appeal) | Key Attractions & Landmarks |
|---|---|---|
| Dal Lake | A picturesque lake surrounded by the stunning Himalayan mountains, Dal Lake is the jewel of Srinagar, attracting tourists for its beauty and houseboats. | Shikara rides, Houseboats, Nigeen Lake, Mughal Gardens, Floating gardens |
| Old City | Rich in history and culture, the Old City of Srinagar offers traditional Kashmiri architecture, vibrant bazaars, and ancient mosques, attracting culturally inclined visitors. | Jama Masjid, Shankaracharya Temple, Hari Parbat, Kashmiri handicrafts shops, Traditional markets |
| Pahalgam | A scenic town known for its breathtaking landscapes, Pahalgam serves as a base for the Amarnath Yatra and is a hub for adventure tourism and nature lovers. | Betaab Valley, Aru Valley, Lidder River, Trekking trails, Gulmarg Nearby |
| Gulmarg | Famous for skiing in winter and trekking in summer, Gulmarg is a sought-after destination for adventure lovers and offers stunning views of snow-capped peaks. | Gulmarg Gondola, Golf Course, Meadows, Skiing and Snowboarding, Trekking routes |
| Sonmarg | Known as the 'Meadow of Gold', Sonmarg offers breathtaking landscapes and is a starting point for several trekking routes, attracting nature enthusiasts. | Thajiwas Glacier, Sindh River, Trekking routes, Scenic beauty, Adventure sports |
| Shankaracharya Hill | A place of both spiritual and touristic importance, offers panoramic views of the valley and is a popular destination for those seeking tranquility and beauty. | Shankaracharya Temple, Viewpoints, Nature walks, Photography spots, Cultural significance |
| Nigeen Lake | A quieter alternative to Dal Lake, Nigeen Lake attracts visitors looking for a more serene environment, perfect for relaxation and enjoying nature. | Houseboats, Shikaras, Lakeside walks, Watersports, Garden views |
| Boulevard Road | A popular area alongside Dal Lake featuring shops, hotels, and restaurants. It serves as a central hub for tourists looking for amenities and access to local attractions. | Lakeside cafes, Shops and Souvenir stores, Waterfront parks, Access to boat rentals, Hotels and guesthouses |
Understanding Airbnb License Requirements & STR Laws in Srinagar (2026)
While Srinagar, Jammu and Kashmir, India currently shows low STR regulations, specific Airbnb license requirements might still exist or change. Always verify the latest short term rental regulations and Airbnb license requirements directly with local government authorities for Srinagar to ensure full compliance before hosting.
(Source: AirROI data, 2026, based on 1% licensed listings)
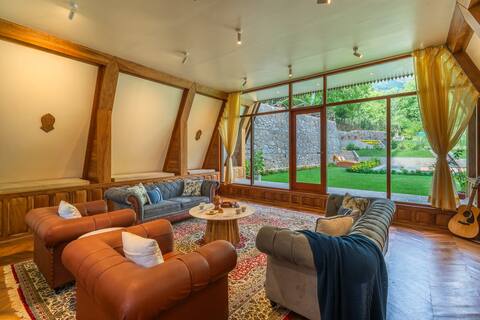
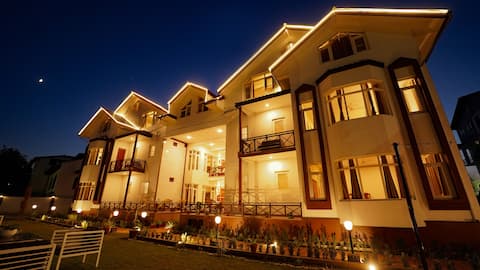
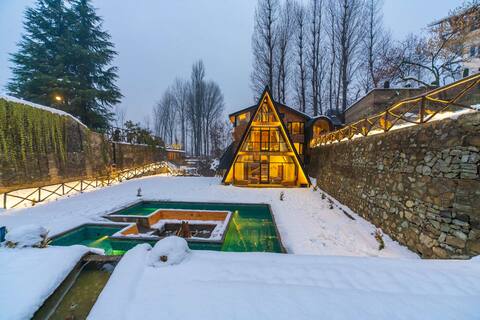
Top Performing Airbnb Properties in Srinagar (2026)
Benchmark your potential! Explore examples of top-performing Airbnb properties in Srinagarbased on Trailing Twelve Month (TTM) revenue. Analyze their characteristics, revenue, occupancy rate, and ADR to understand what drives success in this market.

Villa 67 -Full Villa
Entire Place • 7 bedrooms
7BR Ultra Luxury Villa w/Lawn &Firepit in Srinagar
Private Room • 7 bedrooms

Midsummer Moon – Scenic 5BR Villa @ Srinagar
Entire Place • 5 bedrooms
Walisons Homestay, Abelia -3 BHK- Ground Floor
Entire Place • 3 bedrooms
2BR Ultra Luxury Villa w/Lawn &Firepit in Srinagar
Private Room • 2 bedrooms

StayVista Luxury 9BR in Srinagar | Lawn & Firepit
Entire Place • 9 bedrooms
Note: Performance varies based on location, size, amenities, seasonality, and management quality. Data reflects the past 12 months.
Top Performing Airbnb Hosts in Srinagar (2026)
Learn from the best! This table showcases top-performing Airbnb hosts in Srinagar based on the number of properties managed and estimated total revenue over the past year. Analyze their scale and performance metrics.
| Host Name | Properties | Grossing Revenue | Stay Reviews | Avg Rating |
|---|---|---|---|---|
| Manpreet | 6 | $109,828 | 27 | 4.88/5.0 |
| Omer Mehraj | 4 | $63,569 | 109 | 4.96/5.0 |
| Gursimran | 5 | $57,549 | 17 | 4.17/5.0 |
| Faisal | 4 | $54,330 | 47 | 4.78/5.0 |
| Ahmer | 4 | $45,130 | 49 | 4.95/5.0 |
| Padsha | 6 | $35,957 | 379 | 4.81/5.0 |
| Prithvi | 4 | $30,106 | 166 | 4.86/5.0 |
| Sama Homestays | 4 | $24,762 | 16 | 5.00/5.0 |
| Mehek | 1 | $23,073 | 4 | 4.75/5.0 |
| Devika | 6 | $22,989 | 14 | 5.00/5.0 |
Analyzing the strategies of top hosts, such as their property selection, pricing, and guest communication, can offer valuable lessons for optimizing your own Airbnb operations in Srinagar.
Dive Deeper: Advanced Srinagar STR Market Data (2026)
Ready to unlock more insights? AirROI provides access to advanced metrics and comprehensive Airbnb data for Srinagar. Explore detailed analytics beyond this report to refine your investment strategy, optimize pricing, and maximize your vacation rental profits.
Explore Advanced MetricsSrinagar Short-Term Rental Market Composition (2026): Property & Room Types
Room Type Distribution
Property Type Distribution
Market Composition Insights for Srinagar
- The Srinagar Airbnb market composition is heavily skewed towards Private Room listings, which make up 62.1% of the 248 active rentals. This indicates strong guest preference for privacy and space.
- Looking at the property type distribution in Srinagar, House properties are the most common (48.8%), reflecting the local real estate landscape.
- Houses represent a significant 48.8% portion, catering likely to families or larger groups.
- The presence of 26.6% Hotel/Boutique listings indicates integration with traditional hospitality.
- Smaller segments like others (combined 1.2%) offer potential for unique stay experiences.
Srinagar Airbnb Room Capacity Analysis (2026): Bedroom Distribution
Distribution of Listings by Number of Bedrooms
Room Capacity Insights for Srinagar
- The dominant room capacity in Srinagar is 2 bedrooms listings, making up 20.2% of the market. This suggests a strong demand for properties suitable for couples or solo travelers.
- Together, 2 bedrooms and 3 bedrooms properties represent 39.2% of the active Airbnb listings in Srinagar, indicating a high concentration in these sizes.
- A significant 41.6% of listings offer 3+ bedrooms, catering to larger groups and families seeking more space in Srinagar.
Srinagar Vacation Rental Guest Capacity Trends (2026)
Distribution of Listings by Guest Capacity
Guest Capacity Insights for Srinagar
- The most common guest capacity trend in Srinagar vacation rentals is listings accommodating 8+ guests (24.6%). This suggests the primary traveler segment is likely larger groups.
- Properties designed for 8+ guests and 6 guests dominate the Srinagar STR market, accounting for 33.5% of listings.
- 34.3% of properties accommodate 6+ guests, serving the market segment for larger families or group travel in Srinagar.
- On average, properties in Srinagar are equipped to host 3.4 guests.
Srinagar Airbnb Booking Patterns (2026): Available vs. Booked Days
Available Days Distribution
Booked Days Distribution
Booking Pattern Insights for Srinagar
- The most common availability pattern in Srinagar falls within the 271-366 days range, representing 91.1% of listings. This suggests many properties have significant open periods on their calendars.
- Approximately 100.0% of listings show high availability (181+ days open annually), indicating potential for increased bookings or specific owner usage patterns.
- For booked days, the 1-30 days range is most frequent in Srinagar (55.2%), reflecting common guest stay durations or potential owner blocking patterns.
Srinagar Airbnb Minimum Stay Requirements Analysis
Distribution of Listings by Minimum Night Requirement
1 Night
222 listings
89.5% of total
2 Nights
14 listings
5.6% of total
7-29 Nights
2 listings
0.8% of total
30+ Nights
10 listings
4% of total
Key Insights
- The most prevalent minimum stay requirement in Srinagar is 1 Night, adopted by 89.5% of listings. This highlights the market's preference for shorter, flexible bookings.
- A strong majority (95.1%) of the Srinagar Airbnb data shows acceptance of very short stays (1-2 nights), indicating a dynamic, high-turnover market.
Recommendations
- Align with the market by considering a 1 Night minimum stay, as 89.5% of Srinagar hosts use this setting.
- Adjust minimum nights based on seasonality – potentially shorter during low season and longer during peak demand periods in Srinagar.
Srinagar Airbnb Cancellation Policy Trends Analysis (2026)
Super Strict 30 Days
1 listings
0.4% of total
Limited
3 listings
1.2% of total
Flexible
78 listings
32% of total
Moderate
78 listings
32% of total
Firm
68 listings
27.9% of total
Strict
16 listings
6.6% of total
Cancellation Policy Insights for Srinagar
- The prevailing Airbnb cancellation policy trend in Srinagar is Flexible, used by 32% of listings.
- There's a relatively balanced mix between guest-friendly (64.0%) and stricter (34.5%) policies, offering choices for different guest needs.
- Strict cancellation policies are quite rare (6.6%), potentially making listings with this policy less competitive unless justified by high demand or property type.
Recommendations for Hosts
- Consider adopting a Flexible policy to align with the 32% market standard in Srinagar.
- Using a Strict policy might deter some guests, as only 6.6% of listings use it. Evaluate if potential revenue protection outweighs possible lower booking rates.
- Regularly review your cancellation policy against competitors and market demand shifts in Srinagar.
Srinagar STR Booking Lead Time Analysis (2026)
Average Booking Lead Time by Month
Booking Lead Time Insights for Srinagar
- The overall average booking lead time for vacation rentals in Srinagar is 28 days.
- Guests book furthest in advance for stays during May (average 37 days), likely coinciding with peak travel demand or local events.
- The shortest booking windows occur for stays in August (average 17 days), indicating more last-minute travel plans during this time.
- Seasonally, Spring (30 days avg.) sees the longest lead times, while Summer (23 days avg.) has the shortest, reflecting typical travel planning cycles.
Recommendations for Hosts
- Use the overall average lead time (28 days) as a baseline for your pricing and availability strategy in Srinagar.
- Target marketing efforts for the Spring season well in advance (at least 30 days) to capture early planners.
- Monitor your own booking lead times against these Srinagar averages to identify opportunities for dynamic pricing adjustments.
Popular & Essential Airbnb Amenities in Srinagar (2026)
Amenity Prevalence
Amenity Insights for Srinagar
- Essential amenities in Srinagar that guests expect include: Wifi. Lacking these (this) could significantly impact bookings.
- Popular amenities like Free parking on premises, Hot water, Heating are common but not universal. Offering these can provide a competitive edge.
Recommendations for Hosts
- Ensure your listing includes all essential amenities for Srinagar: Wifi.
- Prioritize adding missing essentials: Wifi.
- Consider adding popular differentiators like Free parking on premises or Hot water to increase appeal.
- Highlight unique or less common amenities you offer (e.g., hot tub, dedicated workspace, EV charger) in your listing description and photos.
- Regularly check competitor amenities in Srinagar to stay competitive.
Srinagar Airbnb Guest Demographics & Profile Analysis (2026)
Guest Profile Summary for Srinagar
- The typical guest profile for Airbnb in Srinagar consists of primarily domestic travelers (75%), often arriving from nearby Bengaluru, typically belonging to the Post-2000s (Gen Z/Alpha) group (50%), primarily speaking English or Hindi.
- Domestic travelers account for 75.0% of guests.
- Key international markets include India (75%) and United States (5.6%).
- Top languages spoken are English (40.5%) followed by Hindi (31.5%).
- A significant demographic segment is the Post-2000s (Gen Z/Alpha) group, representing 50% of guests.
Recommendations for Hosts
- Target domestic marketing efforts towards travelers from Bengaluru and New Delhi.
- Tailor amenities and listing descriptions to appeal to the dominant Post-2000s (Gen Z/Alpha) demographic (e.g., highlight fast WiFi, smart home features, local guides).
- Highlight unique local experiences or amenities relevant to the primary guest profile.
- Consider seasonal promotions aligned with peak travel times for key origin markets.
Nearby Short-Term Rental Market Comparison
How does the Srinagar Airbnb market stack up against its neighbors? Compare key performance metrics like average monthly revenue, ADR, and occupancy rates in surrounding areas to understand the broader regional STR landscape.
| Market | Active Properties | Monthly Revenue | Daily Rate | Avg. Occupancy |
|---|---|---|---|---|
| Tangmarg | 16 | $821 | $281.52 | 20% |
| Kalabagh | 16 | $402 | $120.30 | 22% |
| Tailbal(Habak Shanpora) | 18 | $312 | $66.44 | 26% |
| Blue Area | 16 | $295 | $46.04 | 32% |
| Pahalgam | 10 | $279 | $145.67 | 18% |
| Zone III | 18 | $278 | $99.63 | 15% |
| Murree | 42 | $241 | $92.69 | 18% |
| Islamabad | 528 | $205 | $60.63 | 24% |
| Bourbon | 15 | $204 | $109.41 | 14% |
| Zone IV | 68 | $195 | $55.24 | 21% |