Pagog Airbnb Market Analysis 2026: Short Term Rental Data & Vacation Rental Statistics in Himachal Pradesh, India
Is Airbnb profitable in Pagog in 2026? Explore comprehensive Airbnb analytics for Pagog, Himachal Pradesh, India to uncover income potential. This 2026 STR market report for Pagog, based on AirROI data from February 2025 to January 2026, reveals key trends in the niche market of 19 active listings.
Whether you're considering an Airbnb investment in Pagog, optimizing your existing vacation rental, or exploring rental arbitrage opportunities, understanding the Pagog Airbnb data is crucial. Leveraging the low regulation environment is key to maximizing your short term rental income potential. Let's dive into the specifics.
Key Pagog Airbnb Performance Metrics Overview
Monthly Airbnb Revenue Variations & Income Potential in Pagog (2026)
Understanding the monthly revenue variations for Airbnb listings in Pagog is key to maximizing your short term rental income potential. Seasonality significantly impacts earnings. Our analysis, based on data from the past 12 months, shows that the peak revenue month for STRs in Pagog is typically September, while January often presents the lowest earnings, highlighting opportunities for strategic pricing adjustments during shoulder and low seasons. Explore the typical Airbnb income in Pagog across different performance tiers:
- Best-in-class properties (Top 10%) achieve $454+ monthly, often utilizing dynamic pricing and superior guest experiences.
- Strong performing properties (Top 25%) earn $253 or more, indicating effective management and desirable locations/amenities.
- Typical properties (Median) generate around $136 per month, representing the average market performance.
- Entry-level properties (Bottom 25%) see earnings around $86, often with potential for optimization.
Average Monthly Airbnb Earnings Trend in Pagog
Pagog Airbnb Occupancy Rate Trends (2026)
Maximize your bookings by understanding the Pagog STR occupancy trends. Seasonal demand shifts significantly influence how often properties are booked. Typically, Septembersees the highest demand (peak season occupancy), while January experiences the lowest (low season). Effective strategies, like adjusting minimum stays or offering promotions, can boost occupancy during slower periods. Here's how different property tiers perform in Pagog:
- Best-in-class properties (Top 10%) achieve 47%+ occupancy, indicating high desirability and potentially optimized availability.
- Strong performing properties (Top 25%) maintain 24% or higher occupancy, suggesting good market fit and guest satisfaction.
- Typical properties (Median) have an occupancy rate around 14%.
- Entry-level properties (Bottom 25%) average 10% occupancy, potentially facing higher vacancy.
Average Monthly Occupancy Rate Trend in Pagog
Average Daily Rate (ADR) Airbnb Trends in Pagog (2026)
Effective short term rental pricing strategy in Pagog involves understanding monthly ADR fluctuations. The Average Daily Rate (ADR) for Airbnb in Pagog typically peaks in December and dips lowest during March. Leveraging Airbnb dynamic pricing tools or strategies based on this seasonality can significantly boost revenue. Here's a look at the typical nightly rates achieved:
- Best-in-class properties (Top 10%) command rates of $77+ per night, often due to premium features or locations.
- Strong performing properties (Top 25%) achieve nightly rates of $51 or more.
- Typical properties (Median) charge around $32 per night.
- Entry-level properties (Bottom 25%) earn around $23 per night.
Average Daily Rate (ADR) Trend by Month in Pagog
Get Live Pagog Market Intelligence 👇

Explore Real-time Analytics
Airbnb Seasonality Analysis & Trends in Pagog (2026)
Peak Season (September, July, June)
- Revenue averages $294 per month
- Occupancy rates average 32.4%
- Daily rates average $44
Shoulder Season
- Revenue averages $199 per month
- Occupancy maintains around 18.6%
- Daily rates hold near $43
Low Season (January, April, August)
- Revenue drops to average $96 per month
- Occupancy decreases to average 11.1%
- Daily rates adjust to average $43
Seasonality Insights for Pagog
- The Airbnb seasonality in Pagog shows highly seasonal trends requiring careful strategy. While the sections above show seasonal averages, it's also insightful to look at the extremes:
- During the high season, the absolute peak month showcases Pagog's highest earning potential, with monthly revenues capable of climbing to $327, occupancy reaching a high of 56.6%, and ADRs peaking at $47.
- Conversely, the slowest single month of the year, typically falling within the low season, marks the market's lowest point. In this month, revenue might dip to $59, occupancy could drop to 7.0%, and ADRs may adjust down to $39.
- Understanding both the seasonal averages and these monthly peaks and troughs in revenue, occupancy, and ADR is crucial for maximizing your Airbnb profit potential in Pagog.
Seasonal Strategies for Maximizing Profit
- Peak Season: Maximize revenue through premium pricing and potentially longer minimum stays. Ensure high availability.
- Low Season: Offer competitive pricing, special promotions (e.g., extended stay discounts), and flexible cancellation policies. Target off-season travelers like remote workers or budget-conscious guests.
- Shoulder Seasons: Implement dynamic pricing that balances peak and low rates. Target weekend travelers or specific events. Offer slightly more flexible terms than peak season.
- Regularly analyze your own performance against these Pagog seasonality benchmarks and adjust your pricing and availability strategy accordingly.
Best Areas for Airbnb Investment in Pagog (2026)
Exploring the top neighborhoods for short-term rentals in Pagog? This section highlights key areas, outlining why they are attractive for hosts and guests, along with notable local attractions. Consider these locations based on your target guest profile and investment strategy.
| Neighborhood / Area | Why Host Here? (Target Guests & Appeal) | Key Attractions & Landmarks |
|---|---|---|
| Manali | A popular hill station known for its scenic beauty and adventure sports. A prime destination for tourists looking for snow, nature, and outdoor activities. | Hidimba Devi Temple, Solang Valley, Manali Sanctuary, Old Manali Village, Beas River, Rohtang Pass |
| Shimla | The capital city of Himachal Pradesh, famous for its colonial architecture and pleasant climate. Ideal for families and couples looking to experience historical charm amidst nature. | The Ridge, Mall Road, Jakhoo Temple, Christ Church, Viceregal Lodge, Summer Hill |
| Dharamshala | Home to the Dalai Lama, this area is known for its Tibetan culture and stunning mountain views. Attracts tourists interested in spirituality and hiking. | McLeod Ganj, Namgyal Monastery, Bhagsunag Waterfall, Triund Trek, Dharamkot, Tsuglagkhang Complex |
| Kullu | Known for its lush green valleys and rivers. Ideal for adventure seekers and those wishing to explore the natural beauty of Himachal Pradesh. | Kullu Valley, Raghunath Temple, Beas River Rafting, Great Himalayan National Park, Basheshwar Mahadev Temple |
| Narkanda | A quaint town known for apple orchards and skiing in winter. Great for tourists looking for a less commercialized experience in the mountains. | Hatu Peak, Narkanda Ski Resort, Apple Orchards, Kacheri Temple, Narkanda Village |
| Kasauli | A serene hill station offering a peaceful getaway with colonial charm. Excellent for those looking to escape the hustle and bustle of city life. | Monkey Point, Christ Church, Kasauli Brewery, Manki Point, Kasauli Mall |
| Chamba | A historical town known for its ancient temples and stunning landscapes. Attractions include rich culture, heritage, and outdoor activities. | Bhuri Singh Museum, Chamera Lake, Khajjiar, Chamba Chaugan, Lakshmi Narayan Temple |
| Dalhousie | A picturesque hill station known for its colonial architecture and scenic hikes. Popular with families and couples looking for tranquility and beauty. | Khajjiar, Dainkund Peak, Garam Sadak, St. Francis Church, Panchpula |
Understanding Airbnb License Requirements & STR Laws in Pagog (2026)
While Pagog, Himachal Pradesh, India currently shows low STR regulations, specific Airbnb license requirements might still exist or change. Always verify the latest short term rental regulations and Airbnb license requirements directly with local government authorities for Pagog to ensure full compliance before hosting.
(Source: AirROI data, 2026, finding no licensed listings among those analyzed)
Top Performing Airbnb Properties in Pagog (2026)
Benchmark your potential! Explore examples of top-performing Airbnb properties in Pagogbased on Trailing Twelve Month (TTM) revenue. Analyze their characteristics, revenue, occupancy rate, and ADR to understand what drives success in this market.
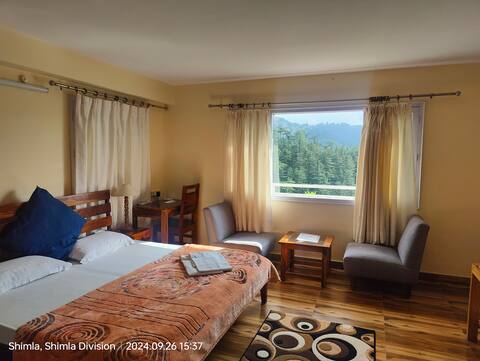
Vatsalyam Serviced Apartment - Work from Home
Entire Place • 1 bedroom

3 Bedroom | Living Area | Balcony | Serene View
Entire Place • 3 bedrooms
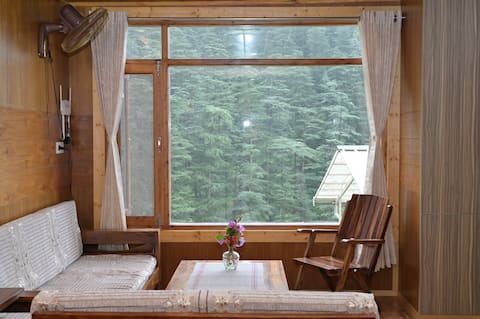
King Bed Charming 2Bhk - With Mesmerizing View
Entire Place • 2 bedrooms

6 Bedroom Home | Amazing View|Elysium Castle
Entire Place • 6 bedrooms

Anand Niketan Deluxe Appartments in Shimla
Entire Place • 1 bedroom

Anand Niketan Deluxe Family Appartments Shimla
Entire Place • 2 bedrooms
Note: Performance varies based on location, size, amenities, seasonality, and management quality. Data reflects the past 12 months.
Top Performing Airbnb Hosts in Pagog (2026)
Learn from the best! This table showcases top-performing Airbnb hosts in Pagog based on the number of properties managed and estimated total revenue over the past year. Analyze their scale and performance metrics.
| Host Name | Properties | Grossing Revenue | Stay Reviews | Avg Rating |
|---|---|---|---|---|
| Balak Ram | 2 | $3,645 | 165 | 4.86/5.0 |
| Asheesh | 2 | $3,129 | 49 | 5.00/5.0 |
| Ritu | 2 | $3,098 | 67 | 4.79/5.0 |
| Jitender | 2 | $2,332 | 46 | 4.58/5.0 |
| Yamini | 3 | $2,167 | 138 | 4.87/5.0 |
| Deepak | 1 | $2,099 | 112 | 4.95/5.0 |
| Muninder | 1 | $818 | 14 | 4.71/5.0 |
| Kartik | 1 | $573 | 1 | Not Rated |
| Purnima | 1 | $290 | 6 | 4.83/5.0 |
| Surender | 1 | $263 | 1 | Not Rated |
Analyzing the strategies of top hosts, such as their property selection, pricing, and guest communication, can offer valuable lessons for optimizing your own Airbnb operations in Pagog.
Dive Deeper: Advanced Pagog STR Market Data (2026)
Ready to unlock more insights? AirROI provides access to advanced metrics and comprehensive Airbnb data for Pagog. Explore detailed analytics beyond this report to refine your investment strategy, optimize pricing, and maximize your vacation rental profits.
Explore Advanced MetricsPagog Short-Term Rental Market Composition (2026): Property & Room Types
Room Type Distribution
Property Type Distribution
Market Composition Insights for Pagog
- The Pagog Airbnb market composition is heavily skewed towards Entire Home/Apt listings, which make up 52.6% of the 19 active rentals. This indicates strong guest preference for privacy and space.
- However, a notable 47.4% share for Private Rooms suggests opportunities for budget-conscious travelers or hosts renting out spare rooms.
- Looking at the property type distribution in Pagog, Apartment/Condo properties are the most common (36.8%), reflecting the local real estate landscape.
- Houses represent a significant 21.1% portion, catering likely to families or larger groups.
- The presence of 21.1% Hotel/Boutique listings indicates integration with traditional hospitality.
Pagog Airbnb Room Capacity Analysis (2026): Bedroom Distribution
Distribution of Listings by Number of Bedrooms
Room Capacity Insights for Pagog
- The dominant room capacity in Pagog is 2 bedrooms listings, making up 36.8% of the market. This suggests a strong demand for properties suitable for couples or solo travelers.
- Together, 2 bedrooms and 5+ bedrooms properties represent 52.6% of the active Airbnb listings in Pagog, indicating a high concentration in these sizes.
- A significant 36.9% of listings offer 3+ bedrooms, catering to larger groups and families seeking more space in Pagog.
Pagog Vacation Rental Guest Capacity Trends (2026)
Distribution of Listings by Guest Capacity
Guest Capacity Insights for Pagog
- The most common guest capacity trend in Pagog vacation rentals is listings accommodating 6 guests (21.1%). This suggests the primary traveler segment is likely larger groups.
- Properties designed for 6 guests and 2 guests dominate the Pagog STR market, accounting for 36.9% of listings.
- 31.6% of properties accommodate 6+ guests, serving the market segment for larger families or group travel in Pagog.
- On average, properties in Pagog are equipped to host 3.0 guests.
Pagog Airbnb Booking Patterns (2026): Available vs. Booked Days
Available Days Distribution
Booked Days Distribution
Booking Pattern Insights for Pagog
- The most common availability pattern in Pagog falls within the 271-366 days range, representing 100% of listings. This suggests many properties have significant open periods on their calendars.
- Approximately 100.0% of listings show high availability (181+ days open annually), indicating potential for increased bookings or specific owner usage patterns.
- For booked days, the 1-30 days range is most frequent in Pagog (57.9%), reflecting common guest stay durations or potential owner blocking patterns.
Pagog Airbnb Minimum Stay Requirements Analysis
Distribution of Listings by Minimum Night Requirement
1 Night
16 listings
84.2% of total
2 Nights
1 listings
5.3% of total
3 Nights
1 listings
5.3% of total
30+ Nights
1 listings
5.3% of total
Key Insights
- The most prevalent minimum stay requirement in Pagog is 1 Night, adopted by 84.2% of listings. This highlights the market's preference for shorter, flexible bookings.
- A strong majority (89.5%) of the Pagog Airbnb data shows acceptance of very short stays (1-2 nights), indicating a dynamic, high-turnover market.
Recommendations
- Align with the market by considering a 1 Night minimum stay, as 84.2% of Pagog hosts use this setting.
- Explore offering discounts for stays of 30+ nights to attract the 5.3% of the market seeking extended stays.
- Adjust minimum nights based on seasonality – potentially shorter during low season and longer during peak demand periods in Pagog.
Pagog Airbnb Cancellation Policy Trends Analysis (2026)
Limited
1 listings
5.3% of total
Flexible
4 listings
21.1% of total
Moderate
7 listings
36.8% of total
Firm
7 listings
36.8% of total
Cancellation Policy Insights for Pagog
- The prevailing Airbnb cancellation policy trend in Pagog is Moderate, used by 36.8% of listings.
- There's a relatively balanced mix between guest-friendly (57.9%) and stricter (36.8%) policies, offering choices for different guest needs.
Recommendations for Hosts
- Consider adopting a Moderate policy to align with the 36.8% market standard in Pagog.
- Regularly review your cancellation policy against competitors and market demand shifts in Pagog.
Pagog STR Booking Lead Time Analysis (2026)
Average Booking Lead Time by Month
Booking Lead Time Insights for Pagog
- The overall average booking lead time for vacation rentals in Pagog is 26 days.
- Guests book furthest in advance for stays during September (average 70 days), likely coinciding with peak travel demand or local events.
- The shortest booking windows occur for stays in October (average 1 days), indicating more last-minute travel plans during this time.
- Seasonally, Summer (29 days avg.) sees the longest lead times, while Spring (19 days avg.) has the shortest, reflecting typical travel planning cycles.
Recommendations for Hosts
- Use the overall average lead time (26 days) as a baseline for your pricing and availability strategy in Pagog.
- For September stays, consider implementing length-of-stay discounts or slightly higher rates for bookings made less than 70 days out to capitalize on advance planning.
- During October, focus on last-minute booking availability and promotions, as guests book with very short notice (1 days avg.).
- Target marketing efforts for the Summer season well in advance (at least 29 days) to capture early planners.
- Monitor your own booking lead times against these Pagog averages to identify opportunities for dynamic pricing adjustments.
Popular & Essential Airbnb Amenities in Pagog (2026)
Amenity Prevalence
Amenity Insights for Pagog
- Popular amenities like TV, Wifi, First aid kit are common but not universal. Offering these can provide a competitive edge.
- Warning: Wifi is not universally provided but is considered essential globally. Ensure reliable Wifi is offered.
Recommendations for Hosts
- Consider adding popular differentiators like TV or Wifi to increase appeal.
- Highlight unique or less common amenities you offer (e.g., hot tub, dedicated workspace, EV charger) in your listing description and photos.
- Regularly check competitor amenities in Pagog to stay competitive.
Pagog Airbnb Guest Demographics & Profile Analysis (2026)
Guest Profile Summary for Pagog
- The typical guest profile for Airbnb in Pagog consists of primarily domestic travelers (69%), often arriving from nearby New Delhi, typically belonging to the Post-2000s (Gen Z/Alpha) group (50%), primarily speaking English or Hindi.
- Domestic travelers account for 69.2% of guests.
- Key international markets include India (69.2%) and United Kingdom (11.5%).
- Top languages spoken are English (45.2%) followed by Hindi (32.3%).
- A significant demographic segment is the Post-2000s (Gen Z/Alpha) group, representing 50% of guests.
Recommendations for Hosts
- Target domestic marketing efforts towards travelers from New Delhi and Bengaluru.
- Tailor amenities and listing descriptions to appeal to the dominant Post-2000s (Gen Z/Alpha) demographic (e.g., highlight fast WiFi, smart home features, local guides).
- Highlight unique local experiences or amenities relevant to the primary guest profile.
- Consider seasonal promotions aligned with peak travel times for key origin markets.
Nearby Short-Term Rental Market Comparison
How does the Pagog Airbnb market stack up against its neighbors? Compare key performance metrics like average monthly revenue, ADR, and occupancy rates in surrounding areas to understand the broader regional STR landscape.
| Market | Active Properties | Monthly Revenue | Daily Rate | Avg. Occupancy |
|---|---|---|---|---|
| Parwanoo | 45 | $1,207 | $217.38 | 21% |
| barlowganj | 21 | $851 | $206.15 | 24% |
| Kasauli | 96 | $845 | $230.62 | 18% |
| Jabarkhet | 28 | $765 | $98.72 | 29% |
| bluchor hill | 28 | $762 | $152.00 | 21% |
| Mashobra | 10 | $739 | $247.62 | 16% |
| Narkanda | 17 | $592 | $128.48 | 16% |
| Dharampur | 94 | $581 | $139.92 | 17% |
| Garkhal | 55 | $578 | $194.60 | 19% |
| bhatta | 48 | $565 | $100.82 | 26% |