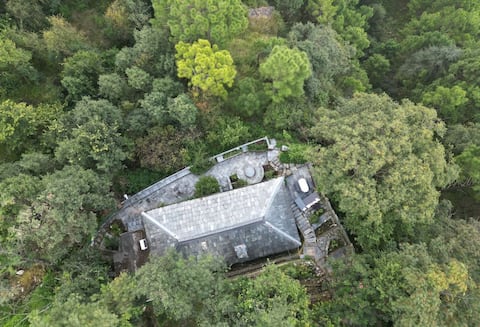
Dharamshala Airbnb Market Analysis 2026: Short Term Rental Data & Vacation Rental Statistics in Himachal Pradesh, India
Is Airbnb profitable in Dharamshala in 2026? Explore comprehensive Airbnb analytics for Dharamshala, Himachal Pradesh, India to uncover income potential. This 2026 STR market report for Dharamshala, based on AirROI data from February 2025 to January 2026, reveals key trends in the niche market of 193 active listings.
Whether you're considering an Airbnb investment in Dharamshala, optimizing your existing vacation rental, or exploring rental arbitrage opportunities, understanding the Dharamshala Airbnb data is crucial. Leveraging the low regulation environment is key to maximizing your short term rental income potential. Let's dive into the specifics.
Key Dharamshala Airbnb Performance Metrics Overview
Monthly Airbnb Revenue Variations & Income Potential in Dharamshala (2026)
Understanding the monthly revenue variations for Airbnb listings in Dharamshala is key to maximizing your short term rental income potential. Seasonality significantly impacts earnings. Our analysis, based on data from the past 12 months, shows that the peak revenue month for STRs in Dharamshala is typically June, while August often presents the lowest earnings, highlighting opportunities for strategic pricing adjustments during shoulder and low seasons. Explore the typical Airbnb income in Dharamshala across different performance tiers:
- Best-in-class properties (Top 10%) achieve $977+ monthly, often utilizing dynamic pricing and superior guest experiences.
- Strong performing properties (Top 25%) earn $550 or more, indicating effective management and desirable locations/amenities.
- Typical properties (Median) generate around $248 per month, representing the average market performance.
- Entry-level properties (Bottom 25%) see earnings around $111, often with potential for optimization.
Average Monthly Airbnb Earnings Trend in Dharamshala
Dharamshala Airbnb Occupancy Rate Trends (2026)
Maximize your bookings by understanding the Dharamshala STR occupancy trends. Seasonal demand shifts significantly influence how often properties are booked. Typically, Aprilsees the highest demand (peak season occupancy), while January experiences the lowest (low season). Effective strategies, like adjusting minimum stays or offering promotions, can boost occupancy during slower periods. Here's how different property tiers perform in Dharamshala:
- Best-in-class properties (Top 10%) achieve 61%+ occupancy, indicating high desirability and potentially optimized availability.
- Strong performing properties (Top 25%) maintain 39% or higher occupancy, suggesting good market fit and guest satisfaction.
- Typical properties (Median) have an occupancy rate around 22%.
- Entry-level properties (Bottom 25%) average 10% occupancy, potentially facing higher vacancy.
Average Monthly Occupancy Rate Trend in Dharamshala
Average Daily Rate (ADR) Airbnb Trends in Dharamshala (2026)
Effective short term rental pricing strategy in Dharamshala involves understanding monthly ADR fluctuations. The Average Daily Rate (ADR) for Airbnb in Dharamshala typically peaks in June and dips lowest during September. Leveraging Airbnb dynamic pricing tools or strategies based on this seasonality can significantly boost revenue. Here's a look at the typical nightly rates achieved:
- Best-in-class properties (Top 10%) command rates of $90+ per night, often due to premium features or locations.
- Strong performing properties (Top 25%) achieve nightly rates of $51 or more.
- Typical properties (Median) charge around $34 per night.
- Entry-level properties (Bottom 25%) earn around $24 per night.
Average Daily Rate (ADR) Trend by Month in Dharamshala
Get Live Dharamshala Market Intelligence 👇

Explore Real-time Analytics
Airbnb Seasonality Analysis & Trends in Dharamshala (2026)
Peak Season (June, May, March)
- Revenue averages $538 per month
- Occupancy rates average 32.4%
- Daily rates average $50
Shoulder Season
- Revenue averages $444 per month
- Occupancy maintains around 29.2%
- Daily rates hold near $49
Low Season (January, August, September)
- Revenue drops to average $309 per month
- Occupancy decreases to average 21.7%
- Daily rates adjust to average $48
Seasonality Insights for Dharamshala
- The Airbnb seasonality in Dharamshala shows moderate seasonality with distinct peak and low periods. While the sections above show seasonal averages, it's also insightful to look at the extremes:
- During the high season, the absolute peak month showcases Dharamshala's highest earning potential, with monthly revenues capable of climbing to $556, occupancy reaching a high of 34.6%, and ADRs peaking at $51.
- Conversely, the slowest single month of the year, typically falling within the low season, marks the market's lowest point. In this month, revenue might dip to $287, occupancy could drop to 19.2%, and ADRs may adjust down to $47.
- Understanding both the seasonal averages and these monthly peaks and troughs in revenue, occupancy, and ADR is crucial for maximizing your Airbnb profit potential in Dharamshala.
Seasonal Strategies for Maximizing Profit
- Peak Season: Maximize revenue through premium pricing and potentially longer minimum stays. Ensure high availability.
- Low Season: Offer competitive pricing, special promotions (e.g., extended stay discounts), and flexible cancellation policies. Target off-season travelers like remote workers or budget-conscious guests.
- Shoulder Seasons: Implement dynamic pricing that balances peak and low rates. Target weekend travelers or specific events. Offer slightly more flexible terms than peak season.
- Regularly analyze your own performance against these Dharamshala seasonality benchmarks and adjust your pricing and availability strategy accordingly.
Best Areas for Airbnb Investment in Dharamshala (2026)
Exploring the top neighborhoods for short-term rentals in Dharamshala? This section highlights key areas, outlining why they are attractive for hosts and guests, along with notable local attractions. Consider these locations based on your target guest profile and investment strategy.
| Neighborhood / Area | Why Host Here? (Target Guests & Appeal) | Key Attractions & Landmarks |
|---|---|---|
| McLeod Ganj | A popular tourist destination known for its Tibetan culture, monasteries, and stunning views of the Himalayas. It attracts backpackers and spiritual seekers, making it ideal for Airbnb rentals. | Tsuglagkhang Complex, Bhagsu Waterfall, Bhagsunath Temple, Tibetan Museum, Dharamkot Trek, Namgyal Monastery |
| Dharamshala | The administrative headquarters of the district and home to many Tibetan institutions. It has a mix of visitors from spiritual seekers to adventure tourists. | Kangra Valley, Dharamshala Cricket Stadium, Gyuto Monastery, War Memorial, St. John's Church, Norbulingka Institute |
| Forsyth Ganj | A quieter neighborhood that offers a more local experience of Dharamshala. It is surrounded by nature and typically has less tourist traffic. | Local cafes, Nature trails, Dharamshala tea gardens, Traditional markets, Hermitages, Local temples |
| Naddi | Known for its panoramic views of the Dhauladhar range and a serene environment, Naddi attracts peace seekers and nature lovers. | Naddi Viewpoint, Sunset views, Local trekking routes, Himalayan Nature Park, Cafes with Himachali cuisine |
| Tadok I | A burgeoning area known for scenic beauty and the tranquil environment. Ideal for rustic stays and eco-tourism. | Countryside views, Local farms, Trekking routes, Adventure sports, Cultural experiences |
| Kangra | The district surrounding Dharamshala, known for its rich history and beautiful landscapes, making it a great location for Airbnb properties. | Kangra Fort, Masroor Rock Cut Temples, Kangra Art Museum, Tea gardens, Cultural festivals, Adventure sports |
| Bhagsu | Famous for its waterfalls and temples, Bhagsu is a hotspot for young travelers and adventure enthusiasts, perfect for short-term rentals. | Bhagsu Waterfall, Bhagsunath Temple, Cafes and shops, Trekking paths to Triund, Yoga centers, Nightlife spots |
| Palampur | A bit farther but known for its natural beauty and tea gardens, Palampur attracts tourists looking for a peaceful retreat. | Tea Gardens, Bir Railway Station, Andretta Pottery, Nature walks, Trekking to nearby hills |
Understanding Airbnb License Requirements & STR Laws in Dharamshala (2026)
While Dharamshala, Himachal Pradesh, India currently shows low STR regulations, specific Airbnb license requirements might still exist or change. Always verify the latest short term rental regulations and Airbnb license requirements directly with local government authorities for Dharamshala to ensure full compliance before hosting.
(Source: AirROI data, 2026, finding no licensed listings among those analyzed)
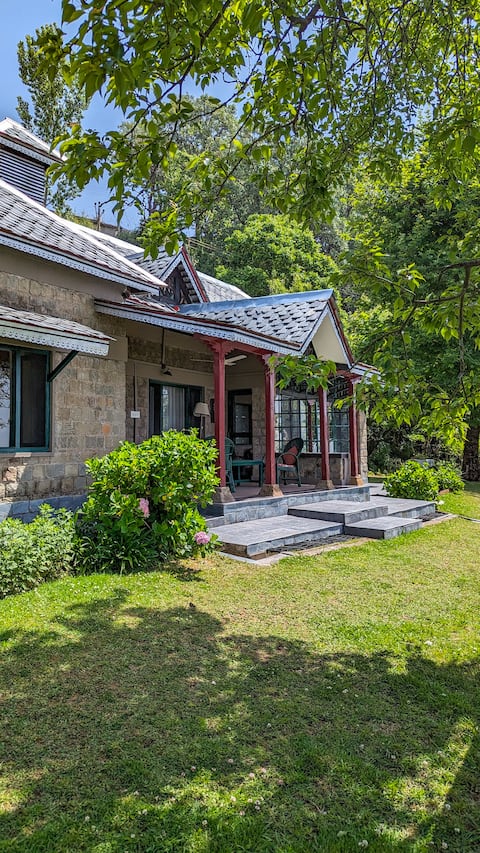
Top Performing Airbnb Properties in Dharamshala (2026)
Benchmark your potential! Explore examples of top-performing Airbnb properties in Dharamshalabased on Trailing Twelve Month (TTM) revenue. Analyze their characteristics, revenue, occupancy rate, and ADR to understand what drives success in this market.

Stonehill Manor luxury mountain cabin@Dharamshala
Entire Place • 3 bedrooms

The Cabin Dharamshala
Entire Place • 3 bedrooms

3 BHK Studio Apartment with living area in Villa
Entire Place • 3 bedrooms
Wild Fig Cottage - An Idyllic Hillside Retreat
Entire Place • 1 bedroom
The Space Above in Mcleodganj
Entire Place • 1 bedroom
Daya Meher 2 BHK Stone Cottage near Mcleodganj
Entire Place • 2 bedrooms
Note: Performance varies based on location, size, amenities, seasonality, and management quality. Data reflects the past 12 months.
Top Performing Airbnb Hosts in Dharamshala (2026)
Learn from the best! This table showcases top-performing Airbnb hosts in Dharamshala based on the number of properties managed and estimated total revenue over the past year. Analyze their scale and performance metrics.
| Host Name | Properties | Grossing Revenue | Stay Reviews | Avg Rating |
|---|---|---|---|---|
| Payal | 7 | $52,365 | 432 | 4.93/5.0 |
| Ekta | 12 | $39,153 | 86 | 4.89/5.0 |
| Gursimran | 1 | $30,539 | 8 | 4.75/5.0 |
| Sumit | 5 | $29,852 | 234 | 4.67/5.0 |
| Lakshit | 1 | $27,989 | 17 | 4.71/5.0 |
| Arjun | 1 | $27,593 | 69 | 4.83/5.0 |
| Torty | 1 | $20,517 | 83 | 4.96/5.0 |
| Hushstays | 1 | $18,719 | 3 | 5.00/5.0 |
| Shikha | 2 | $16,311 | 166 | 4.93/5.0 |
| Rajesh | 4 | $14,228 | 103 | 4.67/5.0 |
Analyzing the strategies of top hosts, such as their property selection, pricing, and guest communication, can offer valuable lessons for optimizing your own Airbnb operations in Dharamshala.
Dive Deeper: Advanced Dharamshala STR Market Data (2026)
Ready to unlock more insights? AirROI provides access to advanced metrics and comprehensive Airbnb data for Dharamshala. Explore detailed analytics beyond this report to refine your investment strategy, optimize pricing, and maximize your vacation rental profits.
Explore Advanced MetricsDharamshala Short-Term Rental Market Composition (2026): Property & Room Types
Room Type Distribution
Property Type Distribution
Market Composition Insights for Dharamshala
- The Dharamshala Airbnb market composition is heavily skewed towards Private Room listings, which make up 56.5% of the 193 active rentals. This indicates strong guest preference for privacy and space.
- Looking at the property type distribution in Dharamshala, House properties are the most common (40.4%), reflecting the local real estate landscape.
- Houses represent a significant 40.4% portion, catering likely to families or larger groups.
- The presence of 31.6% Hotel/Boutique listings indicates integration with traditional hospitality.
- Smaller segments like outdoor/unique, others, unique stays (combined 8.4%) offer potential for unique stay experiences.
Dharamshala Airbnb Room Capacity Analysis (2026): Bedroom Distribution
Distribution of Listings by Number of Bedrooms
Room Capacity Insights for Dharamshala
- The dominant room capacity in Dharamshala is 1 bedroom listings, making up 33.2% of the market. This suggests a strong demand for properties suitable for couples or solo travelers.
- Together, 1 bedroom and 2 bedrooms properties represent 52.4% of the active Airbnb listings in Dharamshala, indicating a high concentration in these sizes.
Dharamshala Vacation Rental Guest Capacity Trends (2026)
Distribution of Listings by Guest Capacity
Guest Capacity Insights for Dharamshala
- The most common guest capacity trend in Dharamshala vacation rentals is listings accommodating 2 guests (21.2%). This suggests the primary traveler segment is likely couples or solo travelers.
- Properties designed for 2 guests and 8+ guests dominate the Dharamshala STR market, accounting for 30.0% of listings.
- 16.5% of properties accommodate 6+ guests, serving the market segment for larger families or group travel in Dharamshala.
- On average, properties in Dharamshala are equipped to host 2.4 guests.
Dharamshala Airbnb Booking Patterns (2026): Available vs. Booked Days
Available Days Distribution
Booked Days Distribution
Booking Pattern Insights for Dharamshala
- The most common availability pattern in Dharamshala falls within the 271-366 days range, representing 79.3% of listings. This suggests many properties have significant open periods on their calendars.
- Approximately 94.8% of listings show high availability (181+ days open annually), indicating potential for increased bookings or specific owner usage patterns.
- For booked days, the 31-90 days range is most frequent in Dharamshala (42%), reflecting common guest stay durations or potential owner blocking patterns.
- A notable 5.7% of properties secure long booking periods (181+ days booked per year), highlighting successful long-term rental strategies or significant owner usage.
Dharamshala Airbnb Minimum Stay Requirements Analysis
Distribution of Listings by Minimum Night Requirement
1 Night
159 listings
82.4% of total
2 Nights
14 listings
7.3% of total
4-6 Nights
1 listings
0.5% of total
7-29 Nights
3 listings
1.6% of total
30+ Nights
16 listings
8.3% of total
Key Insights
- The most prevalent minimum stay requirement in Dharamshala is 1 Night, adopted by 82.4% of listings. This highlights the market's preference for shorter, flexible bookings.
- A strong majority (89.7%) of the Dharamshala Airbnb data shows acceptance of very short stays (1-2 nights), indicating a dynamic, high-turnover market.
Recommendations
- Align with the market by considering a 1 Night minimum stay, as 82.4% of Dharamshala hosts use this setting.
- Explore offering discounts for stays of 30+ nights to attract the 8.3% of the market seeking extended stays.
- Adjust minimum nights based on seasonality – potentially shorter during low season and longer during peak demand periods in Dharamshala.
Dharamshala Airbnb Cancellation Policy Trends Analysis (2026)
Limited
11 listings
5.7% of total
Super Strict 30 Days
2 listings
1% of total
Flexible
72 listings
37.3% of total
Moderate
33 listings
17.1% of total
Firm
39 listings
20.2% of total
Strict
36 listings
18.7% of total
Cancellation Policy Insights for Dharamshala
- The prevailing Airbnb cancellation policy trend in Dharamshala is Flexible, used by 37.3% of listings.
- There's a relatively balanced mix between guest-friendly (54.4%) and stricter (38.9%) policies, offering choices for different guest needs.
Recommendations for Hosts
- Consider adopting a Flexible policy to align with the 37.3% market standard in Dharamshala.
- Regularly review your cancellation policy against competitors and market demand shifts in Dharamshala.
Dharamshala STR Booking Lead Time Analysis (2026)
Average Booking Lead Time by Month
Booking Lead Time Insights for Dharamshala
- The overall average booking lead time for vacation rentals in Dharamshala is 18 days.
- Guests book furthest in advance for stays during September (average 24 days), likely coinciding with peak travel demand or local events.
- The shortest booking windows occur for stays in August (average 12 days), indicating more last-minute travel plans during this time.
- Seasonally, Fall (21 days avg.) sees the longest lead times, while Spring (18 days avg.) has the shortest, reflecting typical travel planning cycles.
Recommendations for Hosts
- Use the overall average lead time (18 days) as a baseline for your pricing and availability strategy in Dharamshala.
- Target marketing efforts for the Fall season well in advance (at least 21 days) to capture early planners.
- Monitor your own booking lead times against these Dharamshala averages to identify opportunities for dynamic pricing adjustments.
Popular & Essential Airbnb Amenities in Dharamshala (2026)
Amenity Prevalence
Amenity Insights for Dharamshala
- Essential amenities in Dharamshala that guests expect include: Wifi. Lacking these (this) could significantly impact bookings.
- Popular amenities like Hot water, Essentials, Dedicated workspace are common but not universal. Offering these can provide a competitive edge.
Recommendations for Hosts
- Ensure your listing includes all essential amenities for Dharamshala: Wifi.
- Prioritize adding missing essentials: Wifi.
- Consider adding popular differentiators like Hot water or Essentials to increase appeal.
- Highlight unique or less common amenities you offer (e.g., hot tub, dedicated workspace, EV charger) in your listing description and photos.
- Regularly check competitor amenities in Dharamshala to stay competitive.
Dharamshala Airbnb Guest Demographics & Profile Analysis (2026)
Guest Profile Summary for Dharamshala
- The typical guest profile for Airbnb in Dharamshala consists of a mix of domestic (54%) and international guests, often arriving from nearby New Delhi, typically belonging to the Post-2000s (Gen Z/Alpha) group (50%), primarily speaking English or Hindi.
- Domestic travelers account for 53.7% of guests.
- Key international markets include India (53.7%) and United States (14.9%).
- Top languages spoken are English (43.2%) followed by Hindi (25.6%).
- A significant demographic segment is the Post-2000s (Gen Z/Alpha) group, representing 50% of guests.
Recommendations for Hosts
- Balance marketing efforts between domestic and international channels based on the guest mix.
- Tailor amenities and listing descriptions to appeal to the dominant Post-2000s (Gen Z/Alpha) demographic (e.g., highlight fast WiFi, smart home features, local guides).
- Highlight unique local experiences or amenities relevant to the primary guest profile.
- Consider seasonal promotions aligned with peak travel times for key origin markets.
Nearby Short-Term Rental Market Comparison
How does the Dharamshala Airbnb market stack up against its neighbors? Compare key performance metrics like average monthly revenue, ADR, and occupancy rates in surrounding areas to understand the broader regional STR landscape.