Morjim Airbnb Market Analysis 2026: Short Term Rental Data & Vacation Rental Statistics in Goa, India
Is Airbnb profitable in Morjim in 2026? Explore comprehensive Airbnb analytics for Morjim, Goa, India to uncover income potential. This 2026 STR market report for Morjim, based on AirROI data from February 2025 to January 2026, reveals key trends in the market of 201 active listings.
Whether you're considering an Airbnb investment in Morjim, optimizing your existing vacation rental, or exploring rental arbitrage opportunities, understanding the Morjim Airbnb data is crucial. Navigating the high regulation landscape is key to maximizing your short term rental income potential. Let's dive into the specifics.
Key Morjim Airbnb Performance Metrics Overview
Monthly Airbnb Revenue Variations & Income Potential in Morjim (2026)
Understanding the monthly revenue variations for Airbnb listings in Morjim is key to maximizing your short term rental income potential. Seasonality significantly impacts earnings. Our analysis, based on data from the past 12 months, shows that the peak revenue month for STRs in Morjim is typically December, while April often presents the lowest earnings, highlighting opportunities for strategic pricing adjustments during shoulder and low seasons. Explore the typical Airbnb income in Morjim across different performance tiers:
- Best-in-class properties (Top 10%) achieve $2,075+ monthly, often utilizing dynamic pricing and superior guest experiences.
- Strong performing properties (Top 25%) earn $853 or more, indicating effective management and desirable locations/amenities.
- Typical properties (Median) generate around $351 per month, representing the average market performance.
- Entry-level properties (Bottom 25%) see earnings around $144, often with potential for optimization.
Average Monthly Airbnb Earnings Trend in Morjim
Morjim Airbnb Occupancy Rate Trends (2026)
Maximize your bookings by understanding the Morjim STR occupancy trends. Seasonal demand shifts significantly influence how often properties are booked. Typically, Februarysees the highest demand (peak season occupancy), while May experiences the lowest (low season). Effective strategies, like adjusting minimum stays or offering promotions, can boost occupancy during slower periods. Here's how different property tiers perform in Morjim:
- Best-in-class properties (Top 10%) achieve 70%+ occupancy, indicating high desirability and potentially optimized availability.
- Strong performing properties (Top 25%) maintain 43% or higher occupancy, suggesting good market fit and guest satisfaction.
- Typical properties (Median) have an occupancy rate around 24%.
- Entry-level properties (Bottom 25%) average 13% occupancy, potentially facing higher vacancy.
Average Monthly Occupancy Rate Trend in Morjim
Average Daily Rate (ADR) Airbnb Trends in Morjim (2026)
Effective short term rental pricing strategy in Morjim involves understanding monthly ADR fluctuations. The Average Daily Rate (ADR) for Airbnb in Morjim typically peaks in December and dips lowest during September. Leveraging Airbnb dynamic pricing tools or strategies based on this seasonality can significantly boost revenue. Here's a look at the typical nightly rates achieved:
- Best-in-class properties (Top 10%) command rates of $124+ per night, often due to premium features or locations.
- Strong performing properties (Top 25%) achieve nightly rates of $60 or more.
- Typical properties (Median) charge around $33 per night.
- Entry-level properties (Bottom 25%) earn around $22 per night.
Average Daily Rate (ADR) Trend by Month in Morjim
Get Live Morjim Market Intelligence 👇

Explore Real-time Analytics
Airbnb Seasonality Analysis & Trends in Morjim (2026)
Peak Season (December, February, March)
- Revenue averages $1,062 per month
- Occupancy rates average 37.1%
- Daily rates average $73
Shoulder Season
- Revenue averages $839 per month
- Occupancy maintains around 29.6%
- Daily rates hold near $67
Low Season (April, August, September)
- Revenue drops to average $712 per month
- Occupancy decreases to average 29.0%
- Daily rates adjust to average $63
Seasonality Insights for Morjim
- The Airbnb seasonality in Morjim shows moderate seasonality with distinct peak and low periods. While the sections above show seasonal averages, it's also insightful to look at the extremes:
- During the high season, the absolute peak month showcases Morjim's highest earning potential, with monthly revenues capable of climbing to $1,152, occupancy reaching a high of 40.1%, and ADRs peaking at $79.
- Conversely, the slowest single month of the year, typically falling within the low season, marks the market's lowest point. In this month, revenue might dip to $693, occupancy could drop to 24.0%, and ADRs may adjust down to $59.
- Understanding both the seasonal averages and these monthly peaks and troughs in revenue, occupancy, and ADR is crucial for maximizing your Airbnb profit potential in Morjim.
Seasonal Strategies for Maximizing Profit
- Peak Season: Maximize revenue through premium pricing and potentially longer minimum stays. Ensure high availability.
- Low Season: Offer competitive pricing, special promotions (e.g., extended stay discounts), and flexible cancellation policies. Target off-season travelers like remote workers or budget-conscious guests.
- Shoulder Seasons: Implement dynamic pricing that balances peak and low rates. Target weekend travelers or specific events. Offer slightly more flexible terms than peak season.
- Regularly analyze your own performance against these Morjim seasonality benchmarks and adjust your pricing and availability strategy accordingly.
Best Areas for Airbnb Investment in Morjim (2026)
Exploring the top neighborhoods for short-term rentals in Morjim? This section highlights key areas, outlining why they are attractive for hosts and guests, along with notable local attractions. Consider these locations based on your target guest profile and investment strategy.
| Neighborhood / Area | Why Host Here? (Target Guests & Appeal) | Key Attractions & Landmarks |
|---|---|---|
| Morjim Beach | A serene and beautiful stretch of coastline popular with both domestic and international tourists, known for its calm waters and picturesque sunsets. Ideal for those looking to relax and enjoy the beach life. | Morjim Beach, Mandrem Beach, Nearby Chapora Fort, Ashwem Beach, Marinha Dourada Restaurant |
| Cafe Lilliput Zone | A lively area close to the beach with various cafes and eateries, popular among tourists seeking good food and a social atmosphere. Great for attracting younger travelers and food enthusiasts. | Cafe Lilliput, The Lazy Dog, La La Land Cafe, Turtle Beach, Artjuna Cafe |
| Mandrem | A tranquil beach area known for its natural beauty and yoga retreats, attracting wellness travelers and those seeking peace and solitude. | Mandrem Beach, Ashiyana Yoga Centre, Sweet Lake, Natural Rock Formations, Keri Beach |
| Anjuna | Famous for its vibrant nightlife and weekly flea market, Anjuna attracts a younger crowd and is known for its party scene and diverse culture. | Anjuna Beach, Anjuna Flea Market, Club Cubana, Artjuna, Silent Noise Parties |
| Arambol | A laid-back beach village famous for its bohemian vibe, popular with backpackers and those looking for an alternative lifestyle experience. | Arambol Beach, Sweet Water Lake, Arambol Mountain, Market and shops, Live music venues |
| Chapora Village | A quaint village near Chapora Fort, known for its scenic views and tranquility, attracting tourists who enjoy culture and history. | Chapora Fort, Vagator Beach, The Chapora River, Local market, Shacks and restaurants |
| Siolim | A charming village in North Goa known for its heritage and culture, ideal for travelers interested in the Goan lifestyle and local traditions. | Siolim River, Sambhaji Mandir, Local fish markets, Traditional Goan houses, Siolim Church |
| Saligao | A picturesque village with lush greenery, known for its traditional Goan architecture and peaceful environment, attracting tourists looking for authenticity. | Saligao Church, Bodgeshwar Temple, Local spice farms, Traditional Goan cuisine restaurants, Nature trails |
Understanding Airbnb License Requirements & STR Laws in Morjim (2026)
Yes, Morjim, Goa, India enforces high STR regulations. Obtaining a license and ensuring compliance is almost certainly required according to current 2026 STR laws. Always verify the latest short term rental regulations and Airbnb license requirements directly with local government authorities for Morjim to ensure full compliance before hosting.
(Source: AirROI data, 2026, based on 34% licensed listings)
Top Performing Airbnb Properties in Morjim (2026)
Benchmark your potential! Explore examples of top-performing Airbnb properties in Morjimbased on Trailing Twelve Month (TTM) revenue. Analyze their characteristics, revenue, occupancy rate, and ADR to understand what drives success in this market.
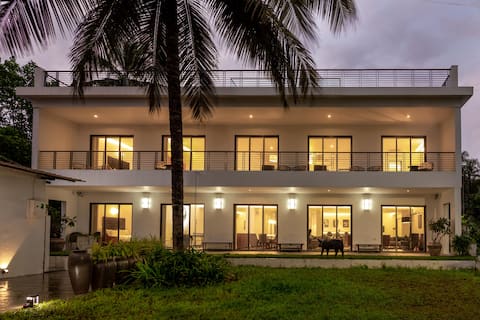
6BR, BBQ, Infi Pool - StayVista at Ashore @ Goa
Entire Place • 6 bedrooms
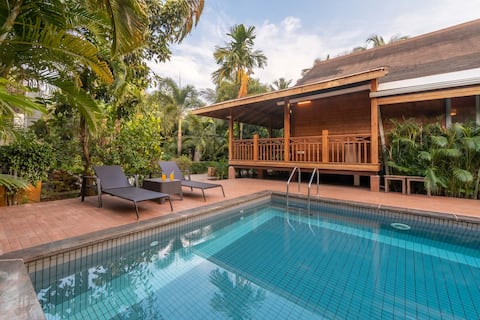
3BR Nature's Abode+W/Pvt Pool+Lawn @Morjim Beach
Entire Place • 3 bedrooms

Villa Antaliya - Walk by the beach
Entire Place • 8 bedrooms
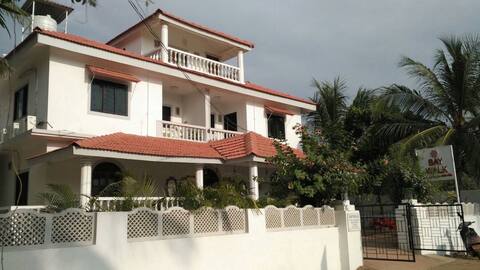
Villa Baywalk Goa | 200 meters from Morjim Beach
Entire Place • 8 bedrooms
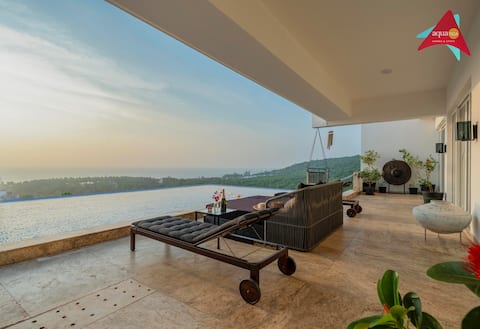
Océan View Villa, Morjim Opp Thalassa Beach
Entire Place • 4 bedrooms

CASA SINGH by Akama Homes 4bhk villa with pool
Entire Place • 4 bedrooms
Note: Performance varies based on location, size, amenities, seasonality, and management quality. Data reflects the past 12 months.
Top Performing Airbnb Hosts in Morjim (2026)
Learn from the best! This table showcases top-performing Airbnb hosts in Morjim based on the number of properties managed and estimated total revenue over the past year. Analyze their scale and performance metrics.
| Host Name | Properties | Grossing Revenue | Stay Reviews | Avg Rating |
|---|---|---|---|---|
| Aaman | 2 | $75,584 | 36 | 4.59/5.0 |
| Gaurav | 5 | $74,739 | 412 | 4.68/5.0 |
| Niyoti | 1 | $63,726 | 2 | Not Rated |
| Sahil | 2 | $58,066 | 45 | 4.47/5.0 |
| Villa Baywalk Goa | 1 | $51,151 | 48 | 4.92/5.0 |
| Amrapali | 1 | $50,718 | 4 | 5.00/5.0 |
| Akama Homes | 1 | $47,802 | 8 | 5.00/5.0 |
| Prannay | 2 | $47,621 | 20 | 4.59/5.0 |
| Lalduhawmi | 2 | $45,785 | 204 | 4.85/5.0 |
| Arpan | 4 | $35,294 | 20 | 4.70/5.0 |
Analyzing the strategies of top hosts, such as their property selection, pricing, and guest communication, can offer valuable lessons for optimizing your own Airbnb operations in Morjim.
Dive Deeper: Advanced Morjim STR Market Data (2026)
Ready to unlock more insights? AirROI provides access to advanced metrics and comprehensive Airbnb data for Morjim. Explore detailed analytics beyond this report to refine your investment strategy, optimize pricing, and maximize your vacation rental profits.
Explore Advanced MetricsMorjim Short-Term Rental Market Composition (2026): Property & Room Types
Room Type Distribution
Property Type Distribution
Market Composition Insights for Morjim
- The Morjim Airbnb market composition is heavily skewed towards Entire Home/Apt listings, which make up 54.7% of the 201 active rentals. This indicates strong guest preference for privacy and space.
- However, a notable 43.8% share for Private Rooms suggests opportunities for budget-conscious travelers or hosts renting out spare rooms.
- Looking at the property type distribution in Morjim, Apartment/Condo properties are the most common (33.8%), reflecting the local real estate landscape.
- Houses represent a significant 32.8% portion, catering likely to families or larger groups.
- The presence of 31.8% Hotel/Boutique listings indicates integration with traditional hospitality.
- Smaller segments like others, unique stays (combined 1.5%) offer potential for unique stay experiences.
Morjim Airbnb Room Capacity Analysis (2026): Bedroom Distribution
Distribution of Listings by Number of Bedrooms
Room Capacity Insights for Morjim
- The dominant room capacity in Morjim is 1 bedroom listings, making up 50.7% of the market. This suggests a strong demand for properties suitable for couples or solo travelers.
- Together, 1 bedroom and 2 bedrooms properties represent 71.6% of the active Airbnb listings in Morjim, indicating a high concentration in these sizes.
- With over half the market (50.7%) consisting of studios or 1-bedroom units, Morjim is particularly well-suited for individuals or couples.
Morjim Vacation Rental Guest Capacity Trends (2026)
Distribution of Listings by Guest Capacity
Guest Capacity Insights for Morjim
- The most common guest capacity trend in Morjim vacation rentals is listings accommodating 2 guests (33.8%). This suggests the primary traveler segment is likely couples or solo travelers.
- Properties designed for 2 guests and 4 guests dominate the Morjim STR market, accounting for 51.2% of listings.
- 19.4% of properties accommodate 6+ guests, serving the market segment for larger families or group travel in Morjim.
- On average, properties in Morjim are equipped to host 3.4 guests.
Morjim Airbnb Booking Patterns (2026): Available vs. Booked Days
Available Days Distribution
Booked Days Distribution
Booking Pattern Insights for Morjim
- The most common availability pattern in Morjim falls within the 271-366 days range, representing 81.1% of listings. This suggests many properties have significant open periods on their calendars.
- Approximately 94.0% of listings show high availability (181+ days open annually), indicating potential for increased bookings or specific owner usage patterns.
- For booked days, the 31-90 days range is most frequent in Morjim (41.3%), reflecting common guest stay durations or potential owner blocking patterns.
- A notable 6.5% of properties secure long booking periods (181+ days booked per year), highlighting successful long-term rental strategies or significant owner usage.
Morjim Airbnb Minimum Stay Requirements Analysis
Distribution of Listings by Minimum Night Requirement
1 Night
91 listings
45.3% of total
2 Nights
36 listings
17.9% of total
3 Nights
19 listings
9.5% of total
4-6 Nights
13 listings
6.5% of total
7-29 Nights
3 listings
1.5% of total
30+ Nights
39 listings
19.4% of total
Key Insights
- The most prevalent minimum stay requirement in Morjim is 1 Night, adopted by 45.3% of listings. This highlights the market's preference for shorter, flexible bookings.
- A strong majority (63.2%) of the Morjim Airbnb data shows acceptance of very short stays (1-2 nights), indicating a dynamic, high-turnover market.
- A significant segment (19.4%) caters to monthly stays (30+ nights) in Morjim, pointing to opportunities in the extended-stay market.
Recommendations
- Align with the market by considering a 1 Night minimum stay, as 45.3% of Morjim hosts use this setting.
- Explore offering discounts for stays of 30+ nights to attract the 19.4% of the market seeking extended stays.
- Adjust minimum nights based on seasonality – potentially shorter during low season and longer during peak demand periods in Morjim.
Morjim Airbnb Cancellation Policy Trends Analysis (2026)
Limited
3 listings
1.5% of total
Super Strict 30 Days
5 listings
2.5% of total
Flexible
31 listings
15.5% of total
Moderate
45 listings
22.5% of total
Firm
83 listings
41.5% of total
Strict
33 listings
16.5% of total
Cancellation Policy Insights for Morjim
- The prevailing Airbnb cancellation policy trend in Morjim is Firm, used by 41.5% of listings.
- A majority (58.0%) of hosts in Morjim utilize Firm or Strict policies, indicating a market where hosts prioritize booking security.
Recommendations for Hosts
- Consider adopting a Firm policy to align with the 41.5% market standard in Morjim.
- Regularly review your cancellation policy against competitors and market demand shifts in Morjim.
Morjim STR Booking Lead Time Analysis (2026)
Average Booking Lead Time by Month
Booking Lead Time Insights for Morjim
- The overall average booking lead time for vacation rentals in Morjim is 32 days.
- Guests book furthest in advance for stays during January (average 40 days), likely coinciding with peak travel demand or local events.
- The shortest booking windows occur for stays in June (average 14 days), indicating more last-minute travel plans during this time.
- Seasonally, Winter (40 days avg.) sees the longest lead times, while Summer (19 days avg.) has the shortest, reflecting typical travel planning cycles.
Recommendations for Hosts
- Use the overall average lead time (32 days) as a baseline for your pricing and availability strategy in Morjim.
- During June, focus on last-minute booking availability and promotions, as guests book with very short notice (14 days avg.).
- Target marketing efforts for the Winter season well in advance (at least 40 days) to capture early planners.
- Monitor your own booking lead times against these Morjim averages to identify opportunities for dynamic pricing adjustments.
Popular & Essential Airbnb Amenities in Morjim (2026)
Amenity Prevalence
Amenity Insights for Morjim
- Essential amenities in Morjim that guests expect include: Wifi, Air conditioning. Lacking these (any) could significantly impact bookings.
- Popular amenities like Hot water, Essentials, Free parking on premises are common but not universal. Offering these can provide a competitive edge.
Recommendations for Hosts
- Ensure your listing includes all essential amenities for Morjim: Wifi, Air conditioning.
- Prioritize adding missing essentials: Wifi, Air conditioning.
- Consider adding popular differentiators like Hot water or Essentials to increase appeal.
- Highlight unique or less common amenities you offer (e.g., hot tub, dedicated workspace, EV charger) in your listing description and photos.
- Regularly check competitor amenities in Morjim to stay competitive.
Morjim Airbnb Guest Demographics & Profile Analysis (2026)
Guest Profile Summary for Morjim
- The typical guest profile for Airbnb in Morjim consists of primarily domestic travelers (71%), often arriving from nearby Bengaluru, typically belonging to the Post-2000s (Gen Z/Alpha) group (50%), primarily speaking English or Hindi.
- Domestic travelers account for 71.1% of guests.
- Key international markets include India (71.1%) and United Kingdom (7.1%).
- Top languages spoken are English (41.7%) followed by Hindi (32.4%).
- A significant demographic segment is the Post-2000s (Gen Z/Alpha) group, representing 50% of guests.
Recommendations for Hosts
- Target domestic marketing efforts towards travelers from Bengaluru and Mumbai.
- Tailor amenities and listing descriptions to appeal to the dominant Post-2000s (Gen Z/Alpha) demographic (e.g., highlight fast WiFi, smart home features, local guides).
- Highlight unique local experiences or amenities relevant to the primary guest profile.
- Consider seasonal promotions aligned with peak travel times for key origin markets.
Nearby Short-Term Rental Market Comparison
How does the Morjim Airbnb market stack up against its neighbors? Compare key performance metrics like average monthly revenue, ADR, and occupancy rates in surrounding areas to understand the broader regional STR landscape.
| Market | Active Properties | Monthly Revenue | Daily Rate | Avg. Occupancy |
|---|---|---|---|---|
| Verla | 12 | $1,408 | $228.43 | 34% |
| Assagao | 307 | $1,350 | $179.91 | 34% |
| Pilern | 16 | $1,254 | $167.86 | 36% |
| Badem | 325 | $1,204 | $179.96 | 31% |
| Marna | 137 | $1,173 | $159.27 | 34% |
| Sinquerim | 113 | $1,105 | $113.10 | 39% |
| Nagoa | 96 | $1,069 | $199.63 | 25% |
| Nerul | 31 | $1,069 | $178.26 | 32% |
| Cacra | 23 | $1,046 | $126.08 | 34% |
| Vagator | 240 | $1,015 | $140.15 | 31% |