Mandrem Airbnb Market Analysis 2026: Short Term Rental Data & Vacation Rental Statistics in Goa, India
Is Airbnb profitable in Mandrem in 2026? Explore comprehensive Airbnb analytics for Mandrem, Goa, India to uncover income potential. This 2026 STR market report for Mandrem, based on AirROI data from February 2025 to January 2026, reveals key trends in the niche market of 161 active listings.
Whether you're considering an Airbnb investment in Mandrem, optimizing your existing vacation rental, or exploring rental arbitrage opportunities, understanding the Mandrem Airbnb data is crucial. Understanding the local regulations is key to maximizing your short term rental income potential. Let's dive into the specifics.
Key Mandrem Airbnb Performance Metrics Overview
Monthly Airbnb Revenue Variations & Income Potential in Mandrem (2026)
Understanding the monthly revenue variations for Airbnb listings in Mandrem is key to maximizing your short term rental income potential. Seasonality significantly impacts earnings. Our analysis, based on data from the past 12 months, shows that the peak revenue month for STRs in Mandrem is typically December, while May often presents the lowest earnings, highlighting opportunities for strategic pricing adjustments during shoulder and low seasons. Explore the typical Airbnb income in Mandrem across different performance tiers:
- Best-in-class properties (Top 10%) achieve $1,797+ monthly, often utilizing dynamic pricing and superior guest experiences.
- Strong performing properties (Top 25%) earn $770 or more, indicating effective management and desirable locations/amenities.
- Typical properties (Median) generate around $320 per month, representing the average market performance.
- Entry-level properties (Bottom 25%) see earnings around $141, often with potential for optimization.
Average Monthly Airbnb Earnings Trend in Mandrem
Mandrem Airbnb Occupancy Rate Trends (2026)
Maximize your bookings by understanding the Mandrem STR occupancy trends. Seasonal demand shifts significantly influence how often properties are booked. Typically, Februarysees the highest demand (peak season occupancy), while May experiences the lowest (low season). Effective strategies, like adjusting minimum stays or offering promotions, can boost occupancy during slower periods. Here's how different property tiers perform in Mandrem:
- Best-in-class properties (Top 10%) achieve 77%+ occupancy, indicating high desirability and potentially optimized availability.
- Strong performing properties (Top 25%) maintain 51% or higher occupancy, suggesting good market fit and guest satisfaction.
- Typical properties (Median) have an occupancy rate around 28%.
- Entry-level properties (Bottom 25%) average 14% occupancy, potentially facing higher vacancy.
Average Monthly Occupancy Rate Trend in Mandrem
Average Daily Rate (ADR) Airbnb Trends in Mandrem (2026)
Effective short term rental pricing strategy in Mandrem involves understanding monthly ADR fluctuations. The Average Daily Rate (ADR) for Airbnb in Mandrem typically peaks in February and dips lowest during September. Leveraging Airbnb dynamic pricing tools or strategies based on this seasonality can significantly boost revenue. Here's a look at the typical nightly rates achieved:
- Best-in-class properties (Top 10%) command rates of $151+ per night, often due to premium features or locations.
- Strong performing properties (Top 25%) achieve nightly rates of $64 or more.
- Typical properties (Median) charge around $36 per night.
- Entry-level properties (Bottom 25%) earn around $22 per night.
Average Daily Rate (ADR) Trend by Month in Mandrem
Get Live Mandrem Market Intelligence 👇

Explore Real-time Analytics
Airbnb Seasonality Analysis & Trends in Mandrem (2026)
Peak Season (December, February, March)
- Revenue averages $884 per month
- Occupancy rates average 42.2%
- Daily rates average $75
Shoulder Season
- Revenue averages $670 per month
- Occupancy maintains around 33.0%
- Daily rates hold near $66
Low Season (May, June, July)
- Revenue drops to average $514 per month
- Occupancy decreases to average 29.9%
- Daily rates adjust to average $68
Seasonality Insights for Mandrem
- The Airbnb seasonality in Mandrem shows highly seasonal trends requiring careful strategy. While the sections above show seasonal averages, it's also insightful to look at the extremes:
- During the high season, the absolute peak month showcases Mandrem's highest earning potential, with monthly revenues capable of climbing to $1,019, occupancy reaching a high of 50.2%, and ADRs peaking at $77.
- Conversely, the slowest single month of the year, typically falling within the low season, marks the market's lowest point. In this month, revenue might dip to $463, occupancy could drop to 25.1%, and ADRs may adjust down to $60.
- Understanding both the seasonal averages and these monthly peaks and troughs in revenue, occupancy, and ADR is crucial for maximizing your Airbnb profit potential in Mandrem.
Seasonal Strategies for Maximizing Profit
- Peak Season: Maximize revenue through premium pricing and potentially longer minimum stays. Ensure high availability.
- Low Season: Offer competitive pricing, special promotions (e.g., extended stay discounts), and flexible cancellation policies. Target off-season travelers like remote workers or budget-conscious guests.
- Shoulder Seasons: Implement dynamic pricing that balances peak and low rates. Target weekend travelers or specific events. Offer slightly more flexible terms than peak season.
- Regularly analyze your own performance against these Mandrem seasonality benchmarks and adjust your pricing and availability strategy accordingly.
Best Areas for Airbnb Investment in Mandrem (2026)
Exploring the top neighborhoods for short-term rentals in Mandrem? This section highlights key areas, outlining why they are attractive for hosts and guests, along with notable local attractions. Consider these locations based on your target guest profile and investment strategy.
| Neighborhood / Area | Why Host Here? (Target Guests & Appeal) | Key Attractions & Landmarks |
|---|---|---|
| Mandrem Beach | Known for its serene and laid-back atmosphere, Mandrem Beach attracts tourists looking for relaxation, yoga retreats, and natural beauty. It's perfect for those seeking a tranquil getaway by the sea. | Mandrem Beach, Morjim Beach, Anjuna Flea Market, Ashwem Beach, Arambol Beach, Keri Beach |
| Ashwem Beach | Ashwem Beach is popular among tourists for its stunning landscape, pristine sand, and beach shacks offering fresh seafood. It's favored by visitors for its peaceful vibe and water sports. | Ashwem Beach, Morjim Beach, Vagator Beach, Anjuna Beach, Salagola Beach, Shree Shree Keri Beach |
| Arambol | Arambol is a vibrant beach community known for its rich cultural scene and adventure sports. It's attractive to backpackers and travelers who enjoy music festivals and a bohemian lifestyle. | Arambol Beach, Sweet Water Lake, Arambol Mountain, The Haath Yoga School, Meditation Center, Arambol Carnival |
| Morjim | Morjim, known as 'Little Russia', attracts many tourists looking for a quieter beach experience. It's ideal for families and couples seeking a peaceful environment to unwind. | Morjim Beach, Ashwem Beach, Mandrem Beach, Chapora Fort, Turtle Sanctuary, River Chapora |
| Mandrem Village | Mandrem Village offers a picturesque setting with lush green landscapes and traditional Goan culture, making it appealing for visitors interested in authentic local experiences. | Mandrem Beach, Local markets, Yoga Ashrams, Bird watching, Lush greenery, Farming experiences |
| Vagator | Vagator is renowned for its vibrant nightlife and beautiful cliffs. It's popular with younger crowds seeking beach parties, music events, and adventure activities. | Vagator Beach, Chapora Fort, Nightclubs, Market stalls, Sunset views, Live music venues |
| Anjuna | Famous for its lively beach parties and the weekly flea market, Anjuna attracts a mix of tourists eager for nightlife, local crafts, and cultural experiences. | Anjuna Beach, Anjuna Flea Market, Chapora Fort, Shiva Valley Beach Shack, Baba Au Rhum Cafe, Live music venues |
| Siolim | Siolim offers a more rural experience for those wanting to escape the tourist hotspots while still being close to the beaches. It has a tranquil environment and showcases authentic Goan life. | Siolim Church, Local spice farms, Backwaters, Nearby beaches, Kayaking, Fishing tours |
Understanding Airbnb License Requirements & STR Laws in Mandrem (2026)
With 11% of listings showing registration in 2026, understanding potential Airbnb license requirements is crucial in Mandrem. Always verify the latest short term rental regulations and Airbnb license requirements directly with local government authorities for Mandrem to ensure full compliance before hosting.
(Source: AirROI data, 2026, based on 11% licensed listings)
Top Performing Airbnb Properties in Mandrem (2026)
Benchmark your potential! Explore examples of top-performing Airbnb properties in Mandrembased on Trailing Twelve Month (TTM) revenue. Analyze their characteristics, revenue, occupancy rate, and ADR to understand what drives success in this market.
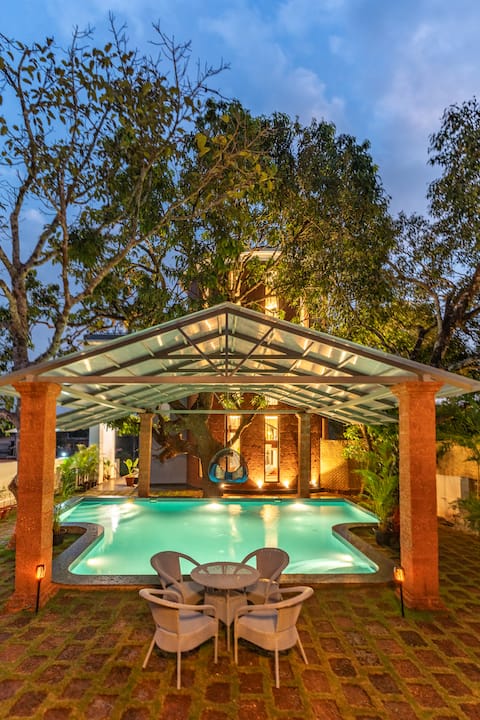
Luxury Villa, Mandrem, Goa
Entire Place • 4 bedrooms
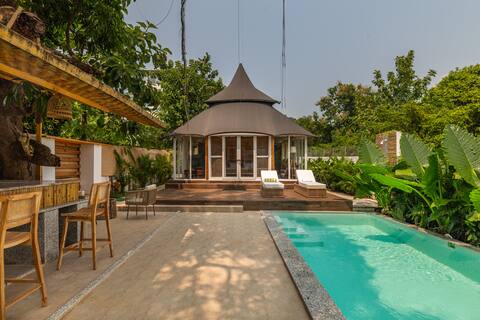
Earthscape Mandrem : Boutique Living
Entire Place • 2 bedrooms
Luxury Cottage:Nirja|Romantic Open-Air Bathtub|Goa
Entire Place • 2 bedrooms

5BHK Villa Paradiso+Pvt Pool+Wifi@Mandrem NorthGoa
Entire Place • 5 bedrooms

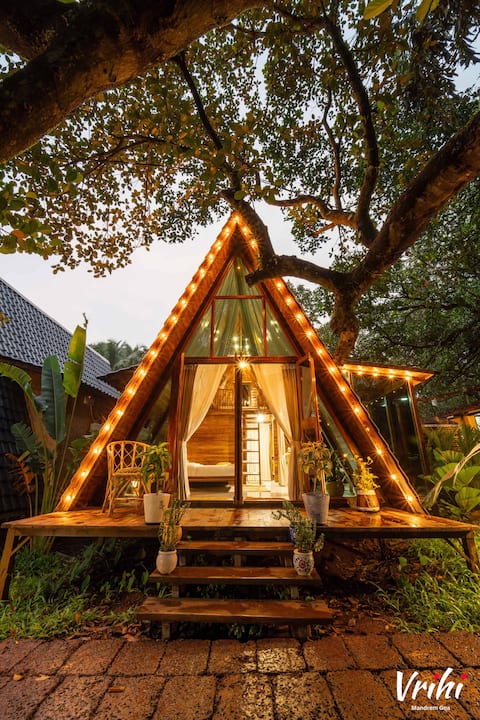
Romantic A-Frame:Aabha|Luxury Open-Air Bathtub|Goa
Entire Place • 2 bedrooms

5BHK Villa Serenity+Pvt Pool+Wifi@Mandrem NorthGoa
Entire Place • 5 bedrooms
Note: Performance varies based on location, size, amenities, seasonality, and management quality. Data reflects the past 12 months.
Top Performing Airbnb Hosts in Mandrem (2026)
Learn from the best! This table showcases top-performing Airbnb hosts in Mandrem based on the number of properties managed and estimated total revenue over the past year. Analyze their scale and performance metrics.
| Host Name | Properties | Grossing Revenue | Stay Reviews | Avg Rating |
|---|---|---|---|---|
| Sayandip | 4 | $82,647 | 373 | 4.91/5.0 |
| Aaman | 4 | $57,988 | 5 | Not Rated |
| Aditya | 1 | $48,847 | 13 | 4.77/5.0 |
| Panav | 1 | $40,384 | 43 | 4.93/5.0 |
| Shahzada | 6 | $37,113 | 152 | 4.89/5.0 |
| Lourenco | 10 | $31,674 | 179 | 4.62/5.0 |
| Gaurav | 2 | $26,674 | 59 | 4.99/5.0 |
| Stepny | 6 | $17,309 | 160 | 4.95/5.0 |
| Shivam | 7 | $14,677 | 355 | 4.68/5.0 |
| Sehran | 1 | $13,729 | 27 | 4.81/5.0 |
Analyzing the strategies of top hosts, such as their property selection, pricing, and guest communication, can offer valuable lessons for optimizing your own Airbnb operations in Mandrem.
Dive Deeper: Advanced Mandrem STR Market Data (2026)
Ready to unlock more insights? AirROI provides access to advanced metrics and comprehensive Airbnb data for Mandrem. Explore detailed analytics beyond this report to refine your investment strategy, optimize pricing, and maximize your vacation rental profits.
Explore Advanced MetricsMandrem Short-Term Rental Market Composition (2026): Property & Room Types
Room Type Distribution
Property Type Distribution
Market Composition Insights for Mandrem
- The Mandrem Airbnb market composition is heavily skewed towards Entire Home/Apt listings, which make up 67.7% of the 161 active rentals. This indicates strong guest preference for privacy and space.
- However, a notable 32.3% share for Private Rooms suggests opportunities for budget-conscious travelers or hosts renting out spare rooms.
- Looking at the property type distribution in Mandrem, Apartment/Condo properties are the most common (40.4%), reflecting the local real estate landscape.
- Houses represent a significant 26.1% portion, catering likely to families or larger groups.
- The presence of 24.8% Hotel/Boutique listings indicates integration with traditional hospitality.
- Smaller segments like others (combined 2.5%) offer potential for unique stay experiences.
Mandrem Airbnb Room Capacity Analysis (2026): Bedroom Distribution
Distribution of Listings by Number of Bedrooms
Room Capacity Insights for Mandrem
- The dominant room capacity in Mandrem is 1 bedroom listings, making up 56.5% of the market. This suggests a strong demand for properties suitable for couples or solo travelers.
- Together, 1 bedroom and 2 bedrooms properties represent 77.6% of the active Airbnb listings in Mandrem, indicating a high concentration in these sizes.
- With over half the market (56.5%) consisting of studios or 1-bedroom units, Mandrem is particularly well-suited for individuals or couples.
Mandrem Vacation Rental Guest Capacity Trends (2026)
Distribution of Listings by Guest Capacity
Guest Capacity Insights for Mandrem
- The most common guest capacity trend in Mandrem vacation rentals is listings accommodating 2 guests (37.9%). This suggests the primary traveler segment is likely couples or solo travelers.
- Properties designed for 2 guests and 3 guests dominate the Mandrem STR market, accounting for 55.3% of listings.
- 18.6% of properties accommodate 6+ guests, serving the market segment for larger families or group travel in Mandrem.
- On average, properties in Mandrem are equipped to host 3.3 guests.
Mandrem Airbnb Booking Patterns (2026): Available vs. Booked Days
Available Days Distribution
Booked Days Distribution
Booking Pattern Insights for Mandrem
- The most common availability pattern in Mandrem falls within the 271-366 days range, representing 79.5% of listings. This suggests many properties have significant open periods on their calendars.
- Approximately 91.9% of listings show high availability (181+ days open annually), indicating potential for increased bookings or specific owner usage patterns.
- For booked days, the 1-30 days range is most frequent in Mandrem (44.1%), reflecting common guest stay durations or potential owner blocking patterns.
- A notable 8.7% of properties secure long booking periods (181+ days booked per year), highlighting successful long-term rental strategies or significant owner usage.
Mandrem Airbnb Minimum Stay Requirements Analysis
Distribution of Listings by Minimum Night Requirement
1 Night
88 listings
54.7% of total
2 Nights
9 listings
5.6% of total
3 Nights
15 listings
9.3% of total
4-6 Nights
3 listings
1.9% of total
7-29 Nights
8 listings
5% of total
30+ Nights
38 listings
23.6% of total
Key Insights
- The most prevalent minimum stay requirement in Mandrem is 1 Night, adopted by 54.7% of listings. This highlights the market's preference for shorter, flexible bookings.
- A strong majority (60.3%) of the Mandrem Airbnb data shows acceptance of very short stays (1-2 nights), indicating a dynamic, high-turnover market.
- A significant segment (23.6%) caters to monthly stays (30+ nights) in Mandrem, pointing to opportunities in the extended-stay market.
Recommendations
- Align with the market by considering a 1 Night minimum stay, as 54.7% of Mandrem hosts use this setting.
- Explore offering discounts for stays of 30+ nights to attract the 23.6% of the market seeking extended stays.
- Adjust minimum nights based on seasonality – potentially shorter during low season and longer during peak demand periods in Mandrem.
Mandrem Airbnb Cancellation Policy Trends Analysis (2026)
Super Strict 30 Days
5 listings
3.1% of total
Limited
3 listings
1.9% of total
Flexible
29 listings
18% of total
Moderate
44 listings
27.3% of total
Firm
50 listings
31.1% of total
Strict
30 listings
18.6% of total
Cancellation Policy Insights for Mandrem
- The prevailing Airbnb cancellation policy trend in Mandrem is Firm, used by 31.1% of listings.
- There's a relatively balanced mix between guest-friendly (45.3%) and stricter (49.7%) policies, offering choices for different guest needs.
Recommendations for Hosts
- Consider adopting a Firm policy to align with the 31.1% market standard in Mandrem.
- Regularly review your cancellation policy against competitors and market demand shifts in Mandrem.
Mandrem STR Booking Lead Time Analysis (2026)
Average Booking Lead Time by Month
Booking Lead Time Insights for Mandrem
- The overall average booking lead time for vacation rentals in Mandrem is 25 days.
- Guests book furthest in advance for stays during January (average 48 days), likely coinciding with peak travel demand or local events.
- The shortest booking windows occur for stays in June (average 10 days), indicating more last-minute travel plans during this time.
- Seasonally, Winter (36 days avg.) sees the longest lead times, while Spring (12 days avg.) has the shortest, reflecting typical travel planning cycles.
Recommendations for Hosts
- Use the overall average lead time (25 days) as a baseline for your pricing and availability strategy in Mandrem.
- For January stays, consider implementing length-of-stay discounts or slightly higher rates for bookings made less than 48 days out to capitalize on advance planning.
- During June, focus on last-minute booking availability and promotions, as guests book with very short notice (10 days avg.).
- Target marketing efforts for the Winter season well in advance (at least 36 days) to capture early planners.
- Monitor your own booking lead times against these Mandrem averages to identify opportunities for dynamic pricing adjustments.
Popular & Essential Airbnb Amenities in Mandrem (2026)
Amenity Prevalence
Amenity Insights for Mandrem
- Essential amenities in Mandrem that guests expect include: Wifi, Air conditioning. Lacking these (any) could significantly impact bookings.
- Popular amenities like Free parking on premises, Dedicated workspace, Kitchen are common but not universal. Offering these can provide a competitive edge.
Recommendations for Hosts
- Ensure your listing includes all essential amenities for Mandrem: Wifi, Air conditioning.
- Prioritize adding missing essentials: Wifi, Air conditioning.
- Consider adding popular differentiators like Free parking on premises or Dedicated workspace to increase appeal.
- Highlight unique or less common amenities you offer (e.g., hot tub, dedicated workspace, EV charger) in your listing description and photos.
- Regularly check competitor amenities in Mandrem to stay competitive.
Mandrem Airbnb Guest Demographics & Profile Analysis (2026)
Guest Profile Summary for Mandrem
- The typical guest profile for Airbnb in Mandrem consists of a mix of domestic (62%) and international guests, often arriving from nearby Mumbai, typically belonging to the Post-2000s (Gen Z/Alpha) group (50%), primarily speaking English or Hindi.
- Domestic travelers account for 62.2% of guests.
- Key international markets include India (62.2%) and United States (6.6%).
- Top languages spoken are English (43.3%) followed by Hindi (28.7%).
- A significant demographic segment is the Post-2000s (Gen Z/Alpha) group, representing 50% of guests.
Recommendations for Hosts
- Target domestic marketing efforts towards travelers from Mumbai and Bengaluru.
- Tailor amenities and listing descriptions to appeal to the dominant Post-2000s (Gen Z/Alpha) demographic (e.g., highlight fast WiFi, smart home features, local guides).
- Highlight unique local experiences or amenities relevant to the primary guest profile.
- Consider seasonal promotions aligned with peak travel times for key origin markets.
Nearby Short-Term Rental Market Comparison
How does the Mandrem Airbnb market stack up against its neighbors? Compare key performance metrics like average monthly revenue, ADR, and occupancy rates in surrounding areas to understand the broader regional STR landscape.
| Market | Active Properties | Monthly Revenue | Daily Rate | Avg. Occupancy |
|---|---|---|---|---|
| Verla | 12 | $1,408 | $228.43 | 34% |
| Assagao | 307 | $1,350 | $179.91 | 34% |
| Pilern | 16 | $1,254 | $167.86 | 36% |
| Badem | 325 | $1,204 | $179.96 | 31% |
| Marna | 137 | $1,173 | $159.27 | 34% |
| Sinquerim | 113 | $1,105 | $113.10 | 39% |
| Nagoa | 96 | $1,069 | $199.63 | 25% |
| Nerul | 31 | $1,069 | $178.26 | 32% |
| Cacra | 23 | $1,046 | $126.08 | 34% |
| Vagator | 240 | $1,015 | $140.15 | 31% |