Betalbatim Airbnb Market Analysis 2026: Short Term Rental Data & Vacation Rental Statistics in Goa, India
Is Airbnb profitable in Betalbatim in 2026? Explore comprehensive Airbnb analytics for Betalbatim, Goa, India to uncover income potential. This 2026 STR market report for Betalbatim, based on AirROI data from February 2025 to January 2026, reveals key trends in the niche market of 59 active listings.
Whether you're considering an Airbnb investment in Betalbatim, optimizing your existing vacation rental, or exploring rental arbitrage opportunities, understanding the Betalbatim Airbnb data is crucial. Navigating the high regulation landscape is key to maximizing your short term rental income potential. Let's dive into the specifics.
Key Betalbatim Airbnb Performance Metrics Overview
Monthly Airbnb Revenue Variations & Income Potential in Betalbatim (2026)
Understanding the monthly revenue variations for Airbnb listings in Betalbatim is key to maximizing your short term rental income potential. Seasonality significantly impacts earnings. Our analysis, based on data from the past 12 months, shows that the peak revenue month for STRs in Betalbatim is typically December, while April often presents the lowest earnings, highlighting opportunities for strategic pricing adjustments during shoulder and low seasons. Explore the typical Airbnb income in Betalbatim across different performance tiers:
- Best-in-class properties (Top 10%) achieve $1,415+ monthly, often utilizing dynamic pricing and superior guest experiences.
- Strong performing properties (Top 25%) earn $695 or more, indicating effective management and desirable locations/amenities.
- Typical properties (Median) generate around $318 per month, representing the average market performance.
- Entry-level properties (Bottom 25%) see earnings around $134, often with potential for optimization.
Average Monthly Airbnb Earnings Trend in Betalbatim
Betalbatim Airbnb Occupancy Rate Trends (2026)
Maximize your bookings by understanding the Betalbatim STR occupancy trends. Seasonal demand shifts significantly influence how often properties are booked. Typically, Februarysees the highest demand (peak season occupancy), while April experiences the lowest (low season). Effective strategies, like adjusting minimum stays or offering promotions, can boost occupancy during slower periods. Here's how different property tiers perform in Betalbatim:
- Best-in-class properties (Top 10%) achieve 66%+ occupancy, indicating high desirability and potentially optimized availability.
- Strong performing properties (Top 25%) maintain 42% or higher occupancy, suggesting good market fit and guest satisfaction.
- Typical properties (Median) have an occupancy rate around 22%.
- Entry-level properties (Bottom 25%) average 10% occupancy, potentially facing higher vacancy.
Average Monthly Occupancy Rate Trend in Betalbatim
Average Daily Rate (ADR) Airbnb Trends in Betalbatim (2026)
Effective short term rental pricing strategy in Betalbatim involves understanding monthly ADR fluctuations. The Average Daily Rate (ADR) for Airbnb in Betalbatim typically peaks in December and dips lowest during July. Leveraging Airbnb dynamic pricing tools or strategies based on this seasonality can significantly boost revenue. Here's a look at the typical nightly rates achieved:
- Best-in-class properties (Top 10%) command rates of $117+ per night, often due to premium features or locations.
- Strong performing properties (Top 25%) achieve nightly rates of $74 or more.
- Typical properties (Median) charge around $49 per night.
- Entry-level properties (Bottom 25%) earn around $28 per night.
Average Daily Rate (ADR) Trend by Month in Betalbatim
Get Live Betalbatim Market Intelligence 👇

Explore Real-time Analytics
Airbnb Seasonality Analysis & Trends in Betalbatim (2026)
Peak Season (December, January, November)
- Revenue averages $789 per month
- Occupancy rates average 34.3%
- Daily rates average $67
Shoulder Season
- Revenue averages $547 per month
- Occupancy maintains around 29.4%
- Daily rates hold near $58
Low Season (April, August, September)
- Revenue drops to average $432 per month
- Occupancy decreases to average 24.2%
- Daily rates adjust to average $58
Seasonality Insights for Betalbatim
- The Airbnb seasonality in Betalbatim shows highly seasonal trends requiring careful strategy. While the sections above show seasonal averages, it's also insightful to look at the extremes:
- During the high season, the absolute peak month showcases Betalbatim's highest earning potential, with monthly revenues capable of climbing to $938, occupancy reaching a high of 39.2%, and ADRs peaking at $74.
- Conversely, the slowest single month of the year, typically falling within the low season, marks the market's lowest point. In this month, revenue might dip to $387, occupancy could drop to 21.4%, and ADRs may adjust down to $56.
- Understanding both the seasonal averages and these monthly peaks and troughs in revenue, occupancy, and ADR is crucial for maximizing your Airbnb profit potential in Betalbatim.
Seasonal Strategies for Maximizing Profit
- Peak Season: Maximize revenue through premium pricing and potentially longer minimum stays. Ensure high availability.
- Low Season: Offer competitive pricing, special promotions (e.g., extended stay discounts), and flexible cancellation policies. Target off-season travelers like remote workers or budget-conscious guests.
- Shoulder Seasons: Implement dynamic pricing that balances peak and low rates. Target weekend travelers or specific events. Offer slightly more flexible terms than peak season.
- Regularly analyze your own performance against these Betalbatim seasonality benchmarks and adjust your pricing and availability strategy accordingly.
Best Areas for Airbnb Investment in Betalbatim (2026)
Exploring the top neighborhoods for short-term rentals in Betalbatim? This section highlights key areas, outlining why they are attractive for hosts and guests, along with notable local attractions. Consider these locations based on your target guest profile and investment strategy.
| Neighborhood / Area | Why Host Here? (Target Guests & Appeal) | Key Attractions & Landmarks |
|---|---|---|
| Betalbatim Beach | A calm and serene beach destination known for its pristine sands and gentle waves. Ideal for families and couples looking for a relaxing getaway. | Betalbatim Beach, Majorda Beach, Cabo de Rama Fort, Colva Beach, Benaulim Beach |
| Gonsua Beach | Less crowded than other beaches, Gonsua offers a quiet retreat for tourists seeking tranquility by the sea. The perfect spot for beach lovers and nature enthusiasts. | Gonsua Beach, Betalbatim Beach, Cabo De Rama, Church of St. John the Baptist, Arossim Beach |
| Majorda | A vibrant village that is famous for its beautiful beach and local cuisine. Attracts those who wish to explore Goan culture while enjoying the beach. | Majorda Beach, Betalbatim Beach, Majorda Village, Sagrada Família Church, Dona Paula |
| Colva | One of the most popular beaches in Goa, well-known for its lively atmosphere and multitude of water sports. Great for tourists looking for a mix of adventure and relaxation. | Colva Beach, Benaulim Beach, Church of Our Lady of Mercy, Colva Beach Market, Mt. Carmel Church |
| Betalbatim Village | A quaint local village offering a glimpse into Goan culture, with warm hospitality and a friendly atmosphere. Great for travelers looking for authenticity. | Local markets, Traditional Goan homes, Betalbatim Church, Nearby paddy fields, Fishing spots |
| Benaulim | A beautiful fishing village that's not only known for its beach but also offers local Goan food experiences. Attractive for both tourists and locals. | Benaulim Beach, Benaulim Church, Kesarval Spring, Nearby seafood shacks, Local markets |
| Cabo de Rama | A historical fort offering breathtaking views of the coastline, making it perfect for sightseeing and photography. A hotspot for history buffs and adventurers. | Cabo de Rama Fort, Cabo de Rama Beach, Local eateries, Beautiful landscape views, Historic ruins |
| Palolem | Famed for its picturesque beach and vibrant nightlife, Palolem is popular among backpackers and party-goers. Offers a lively atmosphere with plenty of activities. | Palolem Beach, Butterfly Beach, Palolem Backwaters, Local music festivals, Beachside cafes |
Understanding Airbnb License Requirements & STR Laws in Betalbatim (2026)
Yes, Betalbatim, Goa, India enforces high STR regulations. Obtaining a license and ensuring compliance is almost certainly required according to current 2026 STR laws. Always verify the latest short term rental regulations and Airbnb license requirements directly with local government authorities for Betalbatim to ensure full compliance before hosting.
(Source: AirROI data, 2026, based on 39% licensed listings)
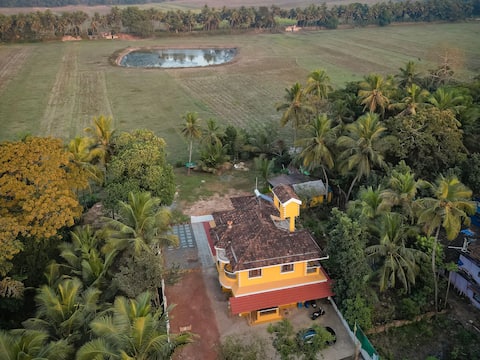
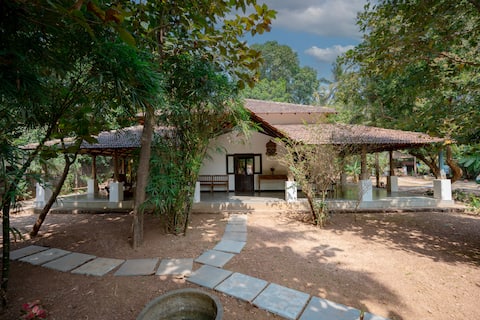
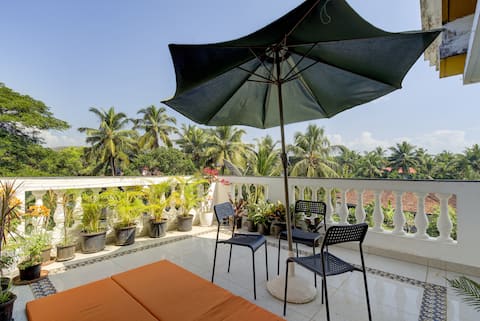
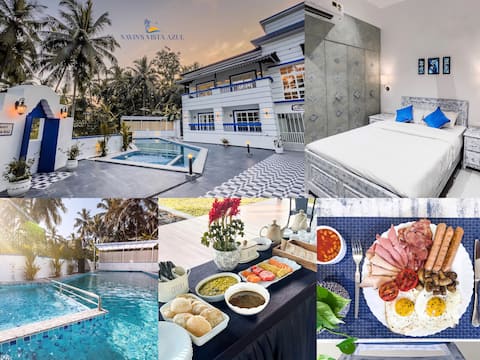
Top Performing Airbnb Properties in Betalbatim (2026)
Benchmark your potential! Explore examples of top-performing Airbnb properties in Betalbatimbased on Trailing Twelve Month (TTM) revenue. Analyze their characteristics, revenue, occupancy rate, and ADR to understand what drives success in this market.

Seaside Serenity: Lilia
Entire Place • 5 bedrooms
3bhk Private Pool Villa in Betalbatim near beach
Entire Place • 3 bedrooms
Oma Koti (Finnish for My House)
Entire Place • 2 bedrooms

Navins Vista Azul- Anturio Suite + Breakfast
Entire Place • 1 bedroom
The Iris | 3bhk w pvt terrace 12 min walk to Beach
Entire Place • 3 bedrooms
Navins Vista Azul- Whole Villa
Entire Place • 4 bedrooms
Note: Performance varies based on location, size, amenities, seasonality, and management quality. Data reflects the past 12 months.
Top Performing Airbnb Hosts in Betalbatim (2026)
Learn from the best! This table showcases top-performing Airbnb hosts in Betalbatim based on the number of properties managed and estimated total revenue over the past year. Analyze their scale and performance metrics.
| Host Name | Properties | Grossing Revenue | Stay Reviews | Avg Rating |
|---|---|---|---|---|
| Nirvana Abode | 7 | $52,500 | 135 | 4.70/5.0 |
| Rustic Roofs | 1 | $47,437 | 34 | 4.68/5.0 |
| Truman | 2 | $20,543 | 38 | 4.97/5.0 |
| Lincoln- Comfort Quarters | 10 | $19,173 | 253 | 4.79/5.0 |
| Zak | 1 | $16,737 | 61 | 5.00/5.0 |
| Marlon | 1 | $7,758 | 1 | Not Rated |
| Aaron | 5 | $6,959 | 34 | 4.81/5.0 |
| Oscar | 2 | $5,765 | 89 | 4.68/5.0 |
| Raul | 2 | $5,720 | 437 | 4.62/5.0 |
| Vinitha | 1 | $5,577 | 86 | 4.76/5.0 |
Analyzing the strategies of top hosts, such as their property selection, pricing, and guest communication, can offer valuable lessons for optimizing your own Airbnb operations in Betalbatim.
Dive Deeper: Advanced Betalbatim STR Market Data (2026)
Ready to unlock more insights? AirROI provides access to advanced metrics and comprehensive Airbnb data for Betalbatim. Explore detailed analytics beyond this report to refine your investment strategy, optimize pricing, and maximize your vacation rental profits.
Explore Advanced MetricsBetalbatim Short-Term Rental Market Composition (2026): Property & Room Types
Room Type Distribution
Property Type Distribution
Market Composition Insights for Betalbatim
- The Betalbatim Airbnb market composition is heavily skewed towards Entire Home/Apt listings, which make up 78% of the 59 active rentals. This indicates strong guest preference for privacy and space.
- Looking at the property type distribution in Betalbatim, Apartment/Condo properties are the most common (42.4%), reflecting the local real estate landscape.
- Houses represent a significant 32.2% portion, catering likely to families or larger groups.
- The presence of 23.7% Hotel/Boutique listings indicates integration with traditional hospitality.
- Smaller segments like outdoor/unique (combined 1.7%) offer potential for unique stay experiences.
Betalbatim Airbnb Room Capacity Analysis (2026): Bedroom Distribution
Distribution of Listings by Number of Bedrooms
Room Capacity Insights for Betalbatim
- The dominant room capacity in Betalbatim is 2 bedrooms listings, making up 30.5% of the market. This suggests a strong demand for properties suitable for couples or solo travelers.
- Together, 2 bedrooms and 3 bedrooms properties represent 57.6% of the active Airbnb listings in Betalbatim, indicating a high concentration in these sizes.
- A significant 39.0% of listings offer 3+ bedrooms, catering to larger groups and families seeking more space in Betalbatim.
Betalbatim Vacation Rental Guest Capacity Trends (2026)
Distribution of Listings by Guest Capacity
Guest Capacity Insights for Betalbatim
- The most common guest capacity trend in Betalbatim vacation rentals is listings accommodating 6 guests (28.8%). This suggests the primary traveler segment is likely larger groups.
- Properties designed for 6 guests and 4 guests dominate the Betalbatim STR market, accounting for 55.9% of listings.
- 50.8% of properties accommodate 6+ guests, serving the market segment for larger families or group travel in Betalbatim.
- On average, properties in Betalbatim are equipped to host 5.0 guests.
Betalbatim Airbnb Booking Patterns (2026): Available vs. Booked Days
Available Days Distribution
Booked Days Distribution
Booking Pattern Insights for Betalbatim
- The most common availability pattern in Betalbatim falls within the 271-366 days range, representing 81.4% of listings. This suggests many properties have significant open periods on their calendars.
- Approximately 93.3% of listings show high availability (181+ days open annually), indicating potential for increased bookings or specific owner usage patterns.
- For booked days, the 1-30 days range is most frequent in Betalbatim (42.4%), reflecting common guest stay durations or potential owner blocking patterns.
- A notable 6.8% of properties secure long booking periods (181+ days booked per year), highlighting successful long-term rental strategies or significant owner usage.
Betalbatim Airbnb Minimum Stay Requirements Analysis
Distribution of Listings by Minimum Night Requirement
1 Night
35 listings
59.3% of total
2 Nights
11 listings
18.6% of total
4-6 Nights
2 listings
3.4% of total
30+ Nights
11 listings
18.6% of total
Key Insights
- The most prevalent minimum stay requirement in Betalbatim is 1 Night, adopted by 59.3% of listings. This highlights the market's preference for shorter, flexible bookings.
- A strong majority (77.9%) of the Betalbatim Airbnb data shows acceptance of very short stays (1-2 nights), indicating a dynamic, high-turnover market.
- A significant segment (18.6%) caters to monthly stays (30+ nights) in Betalbatim, pointing to opportunities in the extended-stay market.
Recommendations
- Align with the market by considering a 1 Night minimum stay, as 59.3% of Betalbatim hosts use this setting.
- Explore offering discounts for stays of 30+ nights to attract the 18.6% of the market seeking extended stays.
- Adjust minimum nights based on seasonality – potentially shorter during low season and longer during peak demand periods in Betalbatim.
Betalbatim Airbnb Cancellation Policy Trends Analysis (2026)
Flexible
15 listings
25.4% of total
Moderate
21 listings
35.6% of total
Firm
18 listings
30.5% of total
Strict
5 listings
8.5% of total
Cancellation Policy Insights for Betalbatim
- The prevailing Airbnb cancellation policy trend in Betalbatim is Moderate, used by 35.6% of listings.
- There's a relatively balanced mix between guest-friendly (61.0%) and stricter (39.0%) policies, offering choices for different guest needs.
- Strict cancellation policies are quite rare (8.5%), potentially making listings with this policy less competitive unless justified by high demand or property type.
Recommendations for Hosts
- Consider adopting a Moderate policy to align with the 35.6% market standard in Betalbatim.
- Using a Strict policy might deter some guests, as only 8.5% of listings use it. Evaluate if potential revenue protection outweighs possible lower booking rates.
- Regularly review your cancellation policy against competitors and market demand shifts in Betalbatim.
Betalbatim STR Booking Lead Time Analysis (2026)
Average Booking Lead Time by Month
Booking Lead Time Insights for Betalbatim
- The overall average booking lead time for vacation rentals in Betalbatim is 26 days.
- Guests book furthest in advance for stays during January (average 41 days), likely coinciding with peak travel demand or local events.
- The shortest booking windows occur for stays in May (average 11 days), indicating more last-minute travel plans during this time.
- Seasonally, Winter (38 days avg.) sees the longest lead times, while Spring (12 days avg.) has the shortest, reflecting typical travel planning cycles.
Recommendations for Hosts
- Use the overall average lead time (26 days) as a baseline for your pricing and availability strategy in Betalbatim.
- For January stays, consider implementing length-of-stay discounts or slightly higher rates for bookings made less than 41 days out to capitalize on advance planning.
- During May, focus on last-minute booking availability and promotions, as guests book with very short notice (11 days avg.).
- Target marketing efforts for the Winter season well in advance (at least 38 days) to capture early planners.
- Monitor your own booking lead times against these Betalbatim averages to identify opportunities for dynamic pricing adjustments.
Popular & Essential Airbnb Amenities in Betalbatim (2026)
Amenity Prevalence
Amenity Insights for Betalbatim
- Essential amenities in Betalbatim that guests expect include: Free parking on premises, Wifi, Air conditioning. Lacking these (any) could significantly impact bookings.
- Popular amenities like TV, Dedicated workspace, Kitchen are common but not universal. Offering these can provide a competitive edge.
Recommendations for Hosts
- Ensure your listing includes all essential amenities for Betalbatim: Free parking on premises, Wifi, Air conditioning.
- Prioritize adding missing essentials: Free parking on premises, Wifi, Air conditioning.
- Consider adding popular differentiators like TV or Dedicated workspace to increase appeal.
- Highlight unique or less common amenities you offer (e.g., hot tub, dedicated workspace, EV charger) in your listing description and photos.
- Regularly check competitor amenities in Betalbatim to stay competitive.
Betalbatim Airbnb Guest Demographics & Profile Analysis (2026)
Guest Profile Summary for Betalbatim
- The typical guest profile for Airbnb in Betalbatim consists of primarily domestic travelers (74%), often arriving from nearby Bengaluru, typically belonging to the Post-2000s (Gen Z/Alpha) group (50%), primarily speaking English or Hindi.
- Domestic travelers account for 73.8% of guests.
- Key international markets include India (73.8%) and Germany (7.1%).
- Top languages spoken are English (47.1%) followed by Hindi (29.8%).
- A significant demographic segment is the Post-2000s (Gen Z/Alpha) group, representing 50% of guests.
Recommendations for Hosts
- Target domestic marketing efforts towards travelers from Bengaluru and Mumbai.
- Tailor amenities and listing descriptions to appeal to the dominant Post-2000s (Gen Z/Alpha) demographic (e.g., highlight fast WiFi, smart home features, local guides).
- Highlight unique local experiences or amenities relevant to the primary guest profile.
- Consider seasonal promotions aligned with peak travel times for key origin markets.
Nearby Short-Term Rental Market Comparison
How does the Betalbatim Airbnb market stack up against its neighbors? Compare key performance metrics like average monthly revenue, ADR, and occupancy rates in surrounding areas to understand the broader regional STR landscape.
| Market | Active Properties | Monthly Revenue | Daily Rate | Avg. Occupancy |
|---|---|---|---|---|
| Verla | 12 | $1,408 | $228.43 | 34% |
| Assagao | 307 | $1,350 | $179.91 | 34% |
| Pilern | 16 | $1,254 | $167.86 | 36% |
| Badem | 325 | $1,204 | $179.96 | 31% |
| Marna | 137 | $1,173 | $159.27 | 34% |
| Sinquerim | 113 | $1,105 | $113.10 | 39% |
| Nagoa | 96 | $1,069 | $199.63 | 25% |
| Nerul | 31 | $1,069 | $178.26 | 32% |
| Cacra | 23 | $1,046 | $126.08 | 34% |
| Vagator | 240 | $1,015 | $140.15 | 31% |