Arambol Airbnb Market Analysis 2026: Short Term Rental Data & Vacation Rental Statistics in Goa, India
Is Airbnb profitable in Arambol in 2026? Explore comprehensive Airbnb analytics for Arambol, Goa, India to uncover income potential. This 2026 STR market report for Arambol, based on AirROI data from February 2025 to January 2026, reveals key trends in the niche market of 136 active listings.
Whether you're considering an Airbnb investment in Arambol, optimizing your existing vacation rental, or exploring rental arbitrage opportunities, understanding the Arambol Airbnb data is crucial. Understanding the local regulations is key to maximizing your short term rental income potential. Let's dive into the specifics.
Key Arambol Airbnb Performance Metrics Overview
Monthly Airbnb Revenue Variations & Income Potential in Arambol (2026)
Understanding the monthly revenue variations for Airbnb listings in Arambol is key to maximizing your short term rental income potential. Seasonality significantly impacts earnings. Our analysis, based on data from the past 12 months, shows that the peak revenue month for STRs in Arambol is typically April, while January often presents the lowest earnings, highlighting opportunities for strategic pricing adjustments during shoulder and low seasons. Explore the typical Airbnb income in Arambol across different performance tiers:
- Best-in-class properties (Top 10%) achieve $1,184+ monthly, often utilizing dynamic pricing and superior guest experiences.
- Strong performing properties (Top 25%) earn $589 or more, indicating effective management and desirable locations/amenities.
- Typical properties (Median) generate around $243 per month, representing the average market performance.
- Entry-level properties (Bottom 25%) see earnings around $91, often with potential for optimization.
Average Monthly Airbnb Earnings Trend in Arambol
Arambol Airbnb Occupancy Rate Trends (2026)
Maximize your bookings by understanding the Arambol STR occupancy trends. Seasonal demand shifts significantly influence how often properties are booked. Typically, Februarysees the highest demand (peak season occupancy), while June experiences the lowest (low season). Effective strategies, like adjusting minimum stays or offering promotions, can boost occupancy during slower periods. Here's how different property tiers perform in Arambol:
- Best-in-class properties (Top 10%) achieve 59%+ occupancy, indicating high desirability and potentially optimized availability.
- Strong performing properties (Top 25%) maintain 41% or higher occupancy, suggesting good market fit and guest satisfaction.
- Typical properties (Median) have an occupancy rate around 20%.
- Entry-level properties (Bottom 25%) average 10% occupancy, potentially facing higher vacancy.
Average Monthly Occupancy Rate Trend in Arambol
Average Daily Rate (ADR) Airbnb Trends in Arambol (2026)
Effective short term rental pricing strategy in Arambol involves understanding monthly ADR fluctuations. The Average Daily Rate (ADR) for Airbnb in Arambol typically peaks in December and dips lowest during July. Leveraging Airbnb dynamic pricing tools or strategies based on this seasonality can significantly boost revenue. Here's a look at the typical nightly rates achieved:
- Best-in-class properties (Top 10%) command rates of $102+ per night, often due to premium features or locations.
- Strong performing properties (Top 25%) achieve nightly rates of $53 or more.
- Typical properties (Median) charge around $29 per night.
- Entry-level properties (Bottom 25%) earn around $19 per night.
Average Daily Rate (ADR) Trend by Month in Arambol
Get Live Arambol Market Intelligence 👇

Explore Real-time Analytics
Airbnb Seasonality Analysis & Trends in Arambol (2026)
Peak Season (April, November, February)
- Revenue averages $607 per month
- Occupancy rates average 35.1%
- Daily rates average $55
Shoulder Season
- Revenue averages $529 per month
- Occupancy maintains around 25.4%
- Daily rates hold near $52
Low Season (January, May, July)
- Revenue drops to average $369 per month
- Occupancy decreases to average 23.5%
- Daily rates adjust to average $50
Seasonality Insights for Arambol
- The Airbnb seasonality in Arambol shows moderate seasonality with distinct peak and low periods. While the sections above show seasonal averages, it's also insightful to look at the extremes:
- During the high season, the absolute peak month showcases Arambol's highest earning potential, with monthly revenues capable of climbing to $615, occupancy reaching a high of 46.3%, and ADRs peaking at $65.
- Conversely, the slowest single month of the year, typically falling within the low season, marks the market's lowest point. In this month, revenue might dip to $340, occupancy could drop to 20.1%, and ADRs may adjust down to $46.
- Understanding both the seasonal averages and these monthly peaks and troughs in revenue, occupancy, and ADR is crucial for maximizing your Airbnb profit potential in Arambol.
Seasonal Strategies for Maximizing Profit
- Peak Season: Maximize revenue through premium pricing and potentially longer minimum stays. Ensure high availability.
- Low Season: Offer competitive pricing, special promotions (e.g., extended stay discounts), and flexible cancellation policies. Target off-season travelers like remote workers or budget-conscious guests.
- Shoulder Seasons: Implement dynamic pricing that balances peak and low rates. Target weekend travelers or specific events. Offer slightly more flexible terms than peak season.
- Regularly analyze your own performance against these Arambol seasonality benchmarks and adjust your pricing and availability strategy accordingly.
Best Areas for Airbnb Investment in Arambol (2026)
Exploring the top neighborhoods for short-term rentals in Arambol? This section highlights key areas, outlining why they are attractive for hosts and guests, along with notable local attractions. Consider these locations based on your target guest profile and investment strategy.
| Neighborhood / Area | Why Host Here? (Target Guests & Appeal) | Key Attractions & Landmarks |
|---|---|---|
| Main Beach | The main beach in Arambol, known for its stunning sunsets, vibrant atmosphere, and numerous beach shacks. A favorite among tourists looking for a relaxing beach day. | Arambol Beach, Arambol Sweet Water Lake, Sunset Views, Beach Shacks, Yoga and Meditation Retreats |
| Arambol Sweet Water Lake | A serene freshwater lake located a short walk from the beach, ideal for swimming and relaxation. Great for families and those looking for a quieter experience. | Sweet Water Lake, Surrounding Hills, Yoga Classes Nearby, Picnic Spots |
| Arambol Mountain | The scenic hill that offers breathtaking views of Arambol Beach and the coastline. Attracts hikers and those looking to enjoy nature ahead of sunset. | Hiking Trails, Sunset Views, Photography Spots, Nature Walks |
| Arambol Village | A charming local village filled with shops, cafes, and local culture, perfect for travelers who want to experience authentic Goan life. | Local Markets, Artisan Shops, Goan Cuisine Restaurants, Cultural Events |
| Ashvem | Nearby beach known for being quieter than Arambol. A great place for those seeking tranquility and relaxation, ideal for wellness retreats. | Ashvem Beach, Beachfront Cafes, Watersports, Yoga Retreats |
| Mandrem | Another peaceful beach location close to Arambol, famous for its untouched beauty and laid-back vibe. Popular with nature lovers and retreat-goers. | Mandrem Beach, River Beach Area, Wildlife and Nature, Wellness Resorts |
| Keri Beach | A secluded beach north of Arambol, known for its pristine sands and tranquility. Great for those looking to escape the crowds. | Keri Beach, Quiet Atmosphere, Natural Beauty, Sunsets |
| Culinary Scene in Arambol | Arambol has a rich culinary landscape with numerous restaurants offering a range of cuisines. Essential for guests interested in food experiences. | Local Seafood, International Restaurants, Wellness Cafes, Food Festivals |
Understanding Airbnb License Requirements & STR Laws in Arambol (2026)
With 24% of listings showing registration in 2026, understanding potential Airbnb license requirements is crucial in Arambol. Always verify the latest short term rental regulations and Airbnb license requirements directly with local government authorities for Arambol to ensure full compliance before hosting.
(Source: AirROI data, 2026, based on 24% licensed listings)
Top Performing Airbnb Properties in Arambol (2026)
Benchmark your potential! Explore examples of top-performing Airbnb properties in Arambolbased on Trailing Twelve Month (TTM) revenue. Analyze their characteristics, revenue, occupancy rate, and ADR to understand what drives success in this market.
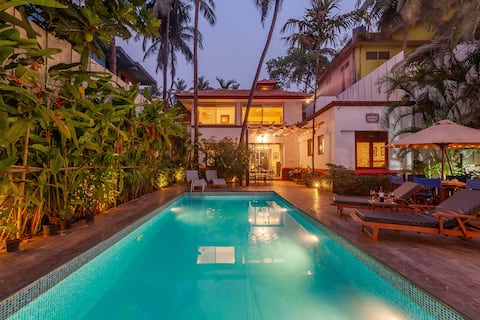
Mawi Infinitty 3BR Villa by Arambol Beach+Pvt Pool
Entire Place • 3 bedrooms
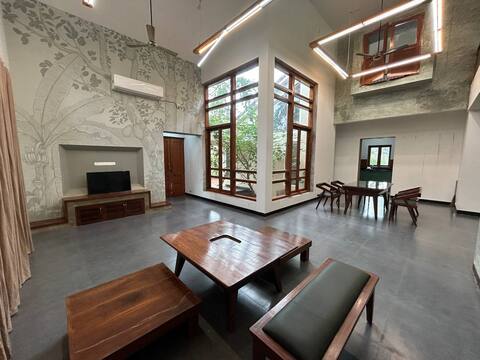
Ultra luxury 4 Bedroom Villa
Entire Place • 4 bedrooms
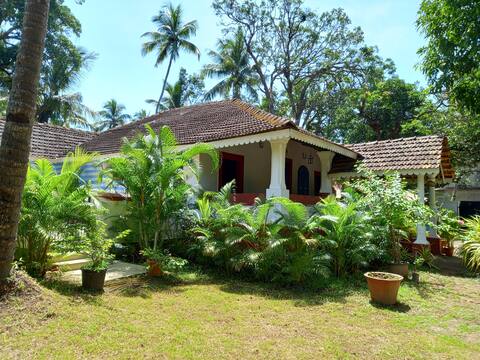
Goan Portuguese Heritage Villa near Arambol Beach
Entire Place • 4 bedrooms

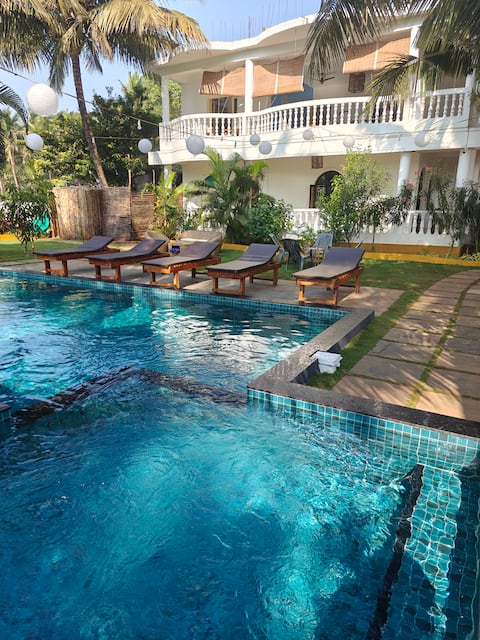
Super Luxery Villa in Arambol
Entire Place • 5 bedrooms
Beach House~Mandrem~300m from beach~3bhk furnished
Entire Place • 3 bedrooms

4BR,Wifi-StayVista - Mawi Summers @ Goa
Entire Place • 4 bedrooms
Note: Performance varies based on location, size, amenities, seasonality, and management quality. Data reflects the past 12 months.
Top Performing Airbnb Hosts in Arambol (2026)
Learn from the best! This table showcases top-performing Airbnb hosts in Arambol based on the number of properties managed and estimated total revenue over the past year. Analyze their scale and performance metrics.
| Host Name | Properties | Grossing Revenue | Stay Reviews | Avg Rating |
|---|---|---|---|---|
| Niyoti | 3 | $62,777 | 43 | 4.44/5.0 |
| Lourenco | 9 | $30,863 | 638 | 4.65/5.0 |
| Aurelia Heaven Retreat | 2 | $20,521 | 3 | Not Rated |
| The Blackbuck Ashwem | 5 | $16,996 | 12 | 4.42/5.0 |
| Revathy | 4 | $16,846 | 86 | 4.47/5.0 |
| Juvenal | 1 | $16,403 | 29 | 4.83/5.0 |
| Sparsha | 3 | $14,623 | 21 | 4.93/5.0 |
| Rohit | 6 | $8,771 | 8 | Not Rated |
| White Villa Goa | 8 | $8,203 | 23 | 3.93/5.0 |
| House Of Arambol | 9 | $8,165 | 214 | 4.77/5.0 |
Analyzing the strategies of top hosts, such as their property selection, pricing, and guest communication, can offer valuable lessons for optimizing your own Airbnb operations in Arambol.
Dive Deeper: Advanced Arambol STR Market Data (2026)
Ready to unlock more insights? AirROI provides access to advanced metrics and comprehensive Airbnb data for Arambol. Explore detailed analytics beyond this report to refine your investment strategy, optimize pricing, and maximize your vacation rental profits.
Explore Advanced MetricsArambol Short-Term Rental Market Composition (2026): Property & Room Types
Room Type Distribution
Property Type Distribution
Market Composition Insights for Arambol
- The Arambol Airbnb market composition is heavily skewed towards Private Room listings, which make up 53.7% of the 136 active rentals. This indicates strong guest preference for privacy and space.
- Looking at the property type distribution in Arambol, Hotel/Boutique properties are the most common (33.8%), reflecting the local real estate landscape.
- Houses represent a significant 25.7% portion, catering likely to families or larger groups.
- The presence of 33.8% Hotel/Boutique listings indicates integration with traditional hospitality.
- Smaller segments like others (combined 0.7%) offer potential for unique stay experiences.
Arambol Airbnb Room Capacity Analysis (2026): Bedroom Distribution
Distribution of Listings by Number of Bedrooms
Room Capacity Insights for Arambol
- The dominant room capacity in Arambol is 1 bedroom listings, making up 51.5% of the market. This suggests a strong demand for properties suitable for couples or solo travelers.
- Together, 1 bedroom and 2 bedrooms properties represent 67.7% of the active Airbnb listings in Arambol, indicating a high concentration in these sizes.
- With over half the market (51.5%) consisting of studios or 1-bedroom units, Arambol is particularly well-suited for individuals or couples.
Arambol Vacation Rental Guest Capacity Trends (2026)
Distribution of Listings by Guest Capacity
Guest Capacity Insights for Arambol
- The most common guest capacity trend in Arambol vacation rentals is listings accommodating 2 guests (27.2%). This suggests the primary traveler segment is likely couples or solo travelers.
- Properties designed for 2 guests and 3 guests dominate the Arambol STR market, accounting for 47.1% of listings.
- 24.3% of properties accommodate 6+ guests, serving the market segment for larger families or group travel in Arambol.
- On average, properties in Arambol are equipped to host 3.3 guests.
Arambol Airbnb Booking Patterns (2026): Available vs. Booked Days
Available Days Distribution
Booked Days Distribution
Booking Pattern Insights for Arambol
- The most common availability pattern in Arambol falls within the 271-366 days range, representing 87.5% of listings. This suggests many properties have significant open periods on their calendars.
- Approximately 98.5% of listings show high availability (181+ days open annually), indicating potential for increased bookings or specific owner usage patterns.
- For booked days, the 1-30 days range is most frequent in Arambol (63.2%), reflecting common guest stay durations or potential owner blocking patterns.
- A notable 2.2% of properties secure long booking periods (181+ days booked per year), highlighting successful long-term rental strategies or significant owner usage.
Arambol Airbnb Minimum Stay Requirements Analysis
Distribution of Listings by Minimum Night Requirement
1 Night
96 listings
70.6% of total
2 Nights
5 listings
3.7% of total
3 Nights
6 listings
4.4% of total
7-29 Nights
15 listings
11% of total
30+ Nights
14 listings
10.3% of total
Key Insights
- The most prevalent minimum stay requirement in Arambol is 1 Night, adopted by 70.6% of listings. This highlights the market's preference for shorter, flexible bookings.
- A strong majority (74.3%) of the Arambol Airbnb data shows acceptance of very short stays (1-2 nights), indicating a dynamic, high-turnover market.
- A significant segment (10.3%) caters to monthly stays (30+ nights) in Arambol, pointing to opportunities in the extended-stay market.
Recommendations
- Align with the market by considering a 1 Night minimum stay, as 70.6% of Arambol hosts use this setting.
- Explore offering discounts for stays of 30+ nights to attract the 10.3% of the market seeking extended stays.
- Adjust minimum nights based on seasonality – potentially shorter during low season and longer during peak demand periods in Arambol.
Arambol Airbnb Cancellation Policy Trends Analysis (2026)
Flexible
51 listings
37.5% of total
Moderate
13 listings
9.6% of total
Firm
47 listings
34.6% of total
Strict
25 listings
18.4% of total
Cancellation Policy Insights for Arambol
- The prevailing Airbnb cancellation policy trend in Arambol is Flexible, used by 37.5% of listings.
- A majority (53.0%) of hosts in Arambol utilize Firm or Strict policies, indicating a market where hosts prioritize booking security.
Recommendations for Hosts
- Consider adopting a Flexible policy to align with the 37.5% market standard in Arambol.
- Regularly review your cancellation policy against competitors and market demand shifts in Arambol.
Arambol STR Booking Lead Time Analysis (2026)
Average Booking Lead Time by Month
Booking Lead Time Insights for Arambol
- The overall average booking lead time for vacation rentals in Arambol is 34 days.
- Guests book furthest in advance for stays during December (average 48 days), likely coinciding with peak travel demand or local events.
- The shortest booking windows occur for stays in June (average 8 days), indicating more last-minute travel plans during this time.
- Seasonally, Winter (37 days avg.) sees the longest lead times, while Spring (12 days avg.) has the shortest, reflecting typical travel planning cycles.
Recommendations for Hosts
- Use the overall average lead time (34 days) as a baseline for your pricing and availability strategy in Arambol.
- For December stays, consider implementing length-of-stay discounts or slightly higher rates for bookings made less than 48 days out to capitalize on advance planning.
- During June, focus on last-minute booking availability and promotions, as guests book with very short notice (8 days avg.).
- Target marketing efforts for the Winter season well in advance (at least 37 days) to capture early planners.
- Monitor your own booking lead times against these Arambol averages to identify opportunities for dynamic pricing adjustments.
Popular & Essential Airbnb Amenities in Arambol (2026)
Amenity Prevalence
Amenity Insights for Arambol
- Essential amenities in Arambol that guests expect include: Wifi. Lacking these (this) could significantly impact bookings.
- Popular amenities like Air conditioning, Dedicated workspace, Free parking on premises are common but not universal. Offering these can provide a competitive edge.
Recommendations for Hosts
- Ensure your listing includes all essential amenities for Arambol: Wifi.
- Prioritize adding missing essentials: Wifi.
- Consider adding popular differentiators like Air conditioning or Dedicated workspace to increase appeal.
- Highlight unique or less common amenities you offer (e.g., hot tub, dedicated workspace, EV charger) in your listing description and photos.
- Regularly check competitor amenities in Arambol to stay competitive.
Arambol Airbnb Guest Demographics & Profile Analysis (2026)
Guest Profile Summary for Arambol
- The typical guest profile for Airbnb in Arambol consists of a mix of domestic (36%) and international guests, with top international origins including United Kingdom, typically belonging to the Post-2000s (Gen Z/Alpha) group (50%), primarily speaking English or Hindi.
- Domestic travelers account for 36.2% of guests.
- Key international markets include India (36.2%) and United Kingdom (11.3%).
- Top languages spoken are English (41.6%) followed by Hindi (17.4%).
- A significant demographic segment is the Post-2000s (Gen Z/Alpha) group, representing 50% of guests.
Recommendations for Hosts
- Focus marketing internationally, particularly towards travelers from United Kingdom.
- Tailor amenities and listing descriptions to appeal to the dominant Post-2000s (Gen Z/Alpha) demographic (e.g., highlight fast WiFi, smart home features, local guides).
- Highlight unique local experiences or amenities relevant to the primary guest profile.
- Consider seasonal promotions aligned with peak travel times for key origin markets.
Nearby Short-Term Rental Market Comparison
How does the Arambol Airbnb market stack up against its neighbors? Compare key performance metrics like average monthly revenue, ADR, and occupancy rates in surrounding areas to understand the broader regional STR landscape.
| Market | Active Properties | Monthly Revenue | Daily Rate | Avg. Occupancy |
|---|---|---|---|---|
| Verla | 12 | $1,408 | $228.43 | 34% |
| Assagao | 307 | $1,350 | $179.91 | 34% |
| Pilern | 16 | $1,254 | $167.86 | 36% |
| Badem | 325 | $1,204 | $179.96 | 31% |
| Marna | 137 | $1,173 | $159.27 | 34% |
| Sinquerim | 113 | $1,105 | $113.10 | 39% |
| Nagoa | 96 | $1,069 | $199.63 | 25% |
| Nerul | 31 | $1,069 | $178.26 | 32% |
| Cacra | 23 | $1,046 | $126.08 | 34% |
| Vagator | 240 | $1,015 | $140.15 | 31% |