New Delhi Airbnb Market Analysis 2026: Short Term Rental Data & Vacation Rental Statistics in Delhi, India
Is Airbnb profitable in New Delhi in 2026? Explore comprehensive Airbnb analytics for New Delhi, Delhi, India to uncover income potential. This 2026 STR market report for New Delhi, based on AirROI data from February 2025 to January 2026, reveals key trends in the bustling market of 2,081 active listings.
Whether you're considering an Airbnb investment in New Delhi, optimizing your existing vacation rental, or exploring rental arbitrage opportunities, understanding the New Delhi Airbnb data is crucial. Leveraging the low regulation environment is key to maximizing your short term rental income potential. Let's dive into the specifics.
Key New Delhi Airbnb Performance Metrics Overview
Monthly Airbnb Revenue Variations & Income Potential in New Delhi (2026)
Understanding the monthly revenue variations for Airbnb listings in New Delhi is key to maximizing your short term rental income potential. Seasonality significantly impacts earnings. Our analysis, based on data from the past 12 months, shows that the peak revenue month for STRs in New Delhi is typically February, while May often presents the lowest earnings, highlighting opportunities for strategic pricing adjustments during shoulder and low seasons. Explore the typical Airbnb income in New Delhi across different performance tiers:
- Best-in-class properties (Top 10%) achieve $1,394+ monthly, often utilizing dynamic pricing and superior guest experiences.
- Strong performing properties (Top 25%) earn $768 or more, indicating effective management and desirable locations/amenities.
- Typical properties (Median) generate around $357 per month, representing the average market performance.
- Entry-level properties (Bottom 25%) see earnings around $148, often with potential for optimization.
Average Monthly Airbnb Earnings Trend in New Delhi
New Delhi Airbnb Occupancy Rate Trends (2026)
Maximize your bookings by understanding the New Delhi STR occupancy trends. Seasonal demand shifts significantly influence how often properties are booked. Typically, Februarysees the highest demand (peak season occupancy), while May experiences the lowest (low season). Effective strategies, like adjusting minimum stays or offering promotions, can boost occupancy during slower periods. Here's how different property tiers perform in New Delhi:
- Best-in-class properties (Top 10%) achieve 73%+ occupancy, indicating high desirability and potentially optimized availability.
- Strong performing properties (Top 25%) maintain 54% or higher occupancy, suggesting good market fit and guest satisfaction.
- Typical properties (Median) have an occupancy rate around 30%.
- Entry-level properties (Bottom 25%) average 14% occupancy, potentially facing higher vacancy.
Average Monthly Occupancy Rate Trend in New Delhi
Average Daily Rate (ADR) Airbnb Trends in New Delhi (2026)
Effective short term rental pricing strategy in New Delhi involves understanding monthly ADR fluctuations. The Average Daily Rate (ADR) for Airbnb in New Delhi typically peaks in February and dips lowest during October. Leveraging Airbnb dynamic pricing tools or strategies based on this seasonality can significantly boost revenue. Here's a look at the typical nightly rates achieved:
- Best-in-class properties (Top 10%) command rates of $107+ per night, often due to premium features or locations.
- Strong performing properties (Top 25%) achieve nightly rates of $64 or more.
- Typical properties (Median) charge around $37 per night.
- Entry-level properties (Bottom 25%) earn around $24 per night.
Average Daily Rate (ADR) Trend by Month in New Delhi
Get Live New Delhi Market Intelligence 👇

Explore Real-time Analytics
Airbnb Seasonality Analysis & Trends in New Delhi (2026)
Peak Season (February, March, November)
- Revenue averages $745 per month
- Occupancy rates average 43.7%
- Daily rates average $56
Shoulder Season
- Revenue averages $592 per month
- Occupancy maintains around 34.4%
- Daily rates hold near $55
Low Season (January, May, June)
- Revenue drops to average $481 per month
- Occupancy decreases to average 29.2%
- Daily rates adjust to average $56
Seasonality Insights for New Delhi
- The Airbnb seasonality in New Delhi shows moderate seasonality with distinct peak and low periods. While the sections above show seasonal averages, it's also insightful to look at the extremes:
- During the high season, the absolute peak month showcases New Delhi's highest earning potential, with monthly revenues capable of climbing to $792, occupancy reaching a high of 49.7%, and ADRs peaking at $57.
- Conversely, the slowest single month of the year, typically falling within the low season, marks the market's lowest point. In this month, revenue might dip to $457, occupancy could drop to 27.9%, and ADRs may adjust down to $54.
- Understanding both the seasonal averages and these monthly peaks and troughs in revenue, occupancy, and ADR is crucial for maximizing your Airbnb profit potential in New Delhi.
Seasonal Strategies for Maximizing Profit
- Peak Season: Maximize revenue through premium pricing and potentially longer minimum stays. Ensure high availability.
- Low Season: Offer competitive pricing, special promotions (e.g., extended stay discounts), and flexible cancellation policies. Target off-season travelers like remote workers or budget-conscious guests.
- Shoulder Seasons: Implement dynamic pricing that balances peak and low rates. Target weekend travelers or specific events. Offer slightly more flexible terms than peak season.
- Regularly analyze your own performance against these New Delhi seasonality benchmarks and adjust your pricing and availability strategy accordingly.
Best Areas for Airbnb Investment in New Delhi (2026)
Exploring the top neighborhoods for short-term rentals in New Delhi? This section highlights key areas, outlining why they are attractive for hosts and guests, along with notable local attractions. Consider these locations based on your target guest profile and investment strategy.
| Neighborhood / Area | Why Host Here? (Target Guests & Appeal) | Key Attractions & Landmarks |
|---|---|---|
| Connaught Place | Central business district and a popular shopping area known for its colonial architecture and vibrant nightlife. Attracts both tourists and business travelers due to its central location. | India Gate, National Museum, Jantar Mantar, Shopping at Connaught Place, Restaurants and cafes, Rashtrapati Bhavan |
| Khan Market | Luxury shopping area and well-known market for gourmet food and cafes. Appeals to affluent tourists and locals, making it a prime spot for hosting Airbnb. | Khan Market shops, Gulattu Cafe, Brown Paper Bag, Grocery stores, Books & Brews |
| Paharganj | Budget-friendly area popular with backpackers and budget travelers. Offers inexpensive accommodation and easy access to tourist sites, making it a hotspot for Airbnb hosts. | Ajmeri Gate, Rama Krishna Ashram Marg, Street food stalls, Budget guesthouses, Tourist shops |
| Hauz Khas | Trendy area known for its vibrant nightlife, upscale cafes, and historical sites. Attracts young professionals and tourists looking for a unique experience. | Hauz Khas Fort, Hauz Khas Village, Cafes and restaurants, Deer Park, Art galleries |
| South Delhi | Residential area with affluent neighborhoods and upscale living. Attracts families and business travelers looking for a quieter stay. | Qutub Minar, Lotus Temple, Shopping Malls, Green Parks, Historical Sites |
| Lajpat Nagar | A popular shopping and residential area known for its markets. Appeals to local and domestic tourists seeking a more local experience. | Lajpat Nagar Central Market, Street food, Clothing shops, Cafes |
| Greater Noida | An emerging area known for its modern infrastructure and proximity to business hubs. Gaining popularity for business travelers and expatriates. | India Expo Mart, Buddh International Circuit, Shopping malls, Green parks |
| Janakpuri | A well-established residential area with good connectivity and amenities. Attractive for families and long-term stays through Airbnb. | Janakpuri District Centre, Local parks, Shopping complexes, Cafes and restaurants |
Understanding Airbnb License Requirements & STR Laws in New Delhi (2026)
While New Delhi, Delhi, India currently shows low STR regulations, specific Airbnb license requirements might still exist or change. Always verify the latest short term rental regulations and Airbnb license requirements directly with local government authorities for New Delhi to ensure full compliance before hosting.
(Source: AirROI data, 2026, based on 0% licensed listings)
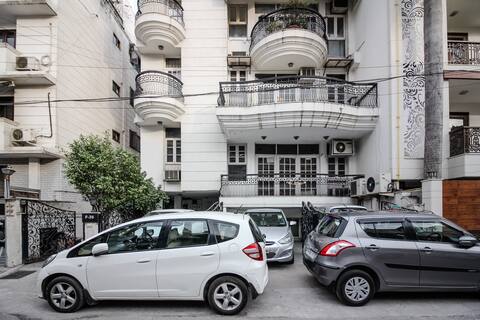
Top Performing Airbnb Properties in New Delhi (2026)
Benchmark your potential! Explore examples of top-performing Airbnb properties in New Delhibased on Trailing Twelve Month (TTM) revenue. Analyze their characteristics, revenue, occupancy rate, and ADR to understand what drives success in this market.

The Brick House | Luxury Urban Stay Near Airport
Entire Place • 4 bedrooms
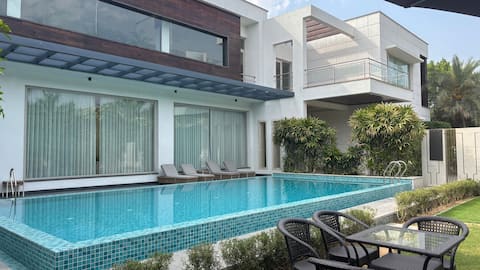
MR Farm by Under My Roof | 5BHK Luxury Farm w Pool
Entire Place • 5 bedrooms

Homester27 | 4 BR| Central, Spacious & Super Clean
Entire Place • 4 bedrooms

STS: Magnificent 4BR Def Col Cook Brekfast Parking
Entire Place • 4 bedrooms

Modern - South Extension Home
Entire Place • 4 bedrooms
UMR Bungalow with 6 Rooms in Green Park
Entire Place • 6 bedrooms
Note: Performance varies based on location, size, amenities, seasonality, and management quality. Data reflects the past 12 months.
Top Performing Airbnb Hosts in New Delhi (2026)
Learn from the best! This table showcases top-performing Airbnb hosts in New Delhi based on the number of properties managed and estimated total revenue over the past year. Analyze their scale and performance metrics.
| Host Name | Properties | Grossing Revenue | Stay Reviews | Avg Rating |
|---|---|---|---|---|
| Rajeev | 16 | $324,619 | 995 | 4.74/5.0 |
| Ayush | 20 | $288,236 | 1671 | 4.77/5.0 |
| The Blue Kite | 10 | $276,381 | 182 | 4.84/5.0 |
| Parvinder | 12 | $159,186 | 1275 | 4.88/5.0 |
| Dhruv | 14 | $152,759 | 1198 | 4.86/5.0 |
| BoBo Stays | 8 | $144,953 | 1003 | 4.92/5.0 |
| Utkarsh | 4 | $115,990 | 416 | 4.89/5.0 |
| Nalin | 5 | $115,194 | 1822 | 4.90/5.0 |
| Aishwarya | 10 | $99,253 | 709 | 4.67/5.0 |
| BLUO Stays | 21 | $93,447 | 399 | 4.82/5.0 |
Analyzing the strategies of top hosts, such as their property selection, pricing, and guest communication, can offer valuable lessons for optimizing your own Airbnb operations in New Delhi.
Dive Deeper: Advanced New Delhi STR Market Data (2026)
Ready to unlock more insights? AirROI provides access to advanced metrics and comprehensive Airbnb data for New Delhi. Explore detailed analytics beyond this report to refine your investment strategy, optimize pricing, and maximize your vacation rental profits.
Explore Advanced MetricsNew Delhi Short-Term Rental Market Composition (2026): Property & Room Types
Room Type Distribution
Property Type Distribution
Market Composition Insights for New Delhi
- The New Delhi Airbnb market composition is heavily skewed towards Entire Home/Apt listings, which make up 65.3% of the 2,081 active rentals. This indicates strong guest preference for privacy and space.
- However, a notable 33.7% share for Private Rooms suggests opportunities for budget-conscious travelers or hosts renting out spare rooms.
- Looking at the property type distribution in New Delhi, Apartment/Condo properties are the most common (72.9%), reflecting the local real estate landscape.
- The presence of 9.7% Hotel/Boutique listings indicates integration with traditional hospitality.
- Smaller segments like others, outdoor/unique, unique stays (combined 2.5%) offer potential for unique stay experiences.
New Delhi Airbnb Room Capacity Analysis (2026): Bedroom Distribution
Distribution of Listings by Number of Bedrooms
Room Capacity Insights for New Delhi
- The dominant room capacity in New Delhi is 1 bedroom listings, making up 38.2% of the market. This suggests a strong demand for properties suitable for couples or solo travelers.
- Together, 1 bedroom and 2 bedrooms properties represent 57.6% of the active Airbnb listings in New Delhi, indicating a high concentration in these sizes.
New Delhi Vacation Rental Guest Capacity Trends (2026)
Distribution of Listings by Guest Capacity
Guest Capacity Insights for New Delhi
- The most common guest capacity trend in New Delhi vacation rentals is listings accommodating 2 guests (22%). This suggests the primary traveler segment is likely couples or solo travelers.
- Properties designed for 2 guests and 4 guests dominate the New Delhi STR market, accounting for 36.5% of listings.
- 24.0% of properties accommodate 6+ guests, serving the market segment for larger families or group travel in New Delhi.
- On average, properties in New Delhi are equipped to host 3.3 guests.
New Delhi Airbnb Booking Patterns (2026): Available vs. Booked Days
Available Days Distribution
Booked Days Distribution
Booking Pattern Insights for New Delhi
- The most common availability pattern in New Delhi falls within the 271-366 days range, representing 65.5% of listings. This suggests many properties have significant open periods on their calendars.
- Approximately 87.5% of listings show high availability (181+ days open annually), indicating potential for increased bookings or specific owner usage patterns.
- For booked days, the 31-90 days range is most frequent in New Delhi (33.9%), reflecting common guest stay durations or potential owner blocking patterns.
- A notable 13.1% of properties secure long booking periods (181+ days booked per year), highlighting successful long-term rental strategies or significant owner usage.
New Delhi Airbnb Minimum Stay Requirements Analysis
Distribution of Listings by Minimum Night Requirement
1 Night
1526 listings
73.3% of total
2 Nights
213 listings
10.2% of total
3 Nights
44 listings
2.1% of total
4-6 Nights
36 listings
1.7% of total
7-29 Nights
24 listings
1.2% of total
30+ Nights
238 listings
11.4% of total
Key Insights
- The most prevalent minimum stay requirement in New Delhi is 1 Night, adopted by 73.3% of listings. This highlights the market's preference for shorter, flexible bookings.
- A strong majority (83.5%) of the New Delhi Airbnb data shows acceptance of very short stays (1-2 nights), indicating a dynamic, high-turnover market.
- A significant segment (11.4%) caters to monthly stays (30+ nights) in New Delhi, pointing to opportunities in the extended-stay market.
Recommendations
- Align with the market by considering a 1 Night minimum stay, as 73.3% of New Delhi hosts use this setting.
- Explore offering discounts for stays of 30+ nights to attract the 11.4% of the market seeking extended stays.
- Adjust minimum nights based on seasonality – potentially shorter during low season and longer during peak demand periods in New Delhi.
New Delhi Airbnb Cancellation Policy Trends Analysis (2026)
Super Strict 30 Days
2 listings
0.1% of total
Limited
61 listings
2.9% of total
Flexible
854 listings
41.2% of total
Moderate
560 listings
27% of total
Firm
422 listings
20.4% of total
Strict
174 listings
8.4% of total
Cancellation Policy Insights for New Delhi
- The prevailing Airbnb cancellation policy trend in New Delhi is Flexible, used by 41.2% of listings.
- There's a relatively balanced mix between guest-friendly (68.2%) and stricter (28.8%) policies, offering choices for different guest needs.
- Strict cancellation policies are quite rare (8.4%), potentially making listings with this policy less competitive unless justified by high demand or property type.
Recommendations for Hosts
- Consider adopting a Flexible policy to align with the 41.2% market standard in New Delhi.
- Using a Strict policy might deter some guests, as only 8.4% of listings use it. Evaluate if potential revenue protection outweighs possible lower booking rates.
- Regularly review your cancellation policy against competitors and market demand shifts in New Delhi.
New Delhi STR Booking Lead Time Analysis (2026)
Average Booking Lead Time by Month
Booking Lead Time Insights for New Delhi
- The overall average booking lead time for vacation rentals in New Delhi is 16 days.
- Guests book furthest in advance for stays during November (average 28 days), likely coinciding with peak travel demand or local events.
- The shortest booking windows occur for stays in June (average 8 days), indicating more last-minute travel plans during this time.
- Seasonally, Fall (22 days avg.) sees the longest lead times, while Summer (10 days avg.) has the shortest, reflecting typical travel planning cycles.
Recommendations for Hosts
- Use the overall average lead time (16 days) as a baseline for your pricing and availability strategy in New Delhi.
- For November stays, consider implementing length-of-stay discounts or slightly higher rates for bookings made less than 28 days out to capitalize on advance planning.
- During June, focus on last-minute booking availability and promotions, as guests book with very short notice (8 days avg.).
- Target marketing efforts for the Fall season well in advance (at least 22 days) to capture early planners.
- Monitor your own booking lead times against these New Delhi averages to identify opportunities for dynamic pricing adjustments.
Popular & Essential Airbnb Amenities in New Delhi (2026)
Amenity Prevalence
Amenity Insights for New Delhi
- Essential amenities in New Delhi that guests expect include: Wifi, Air conditioning. Lacking these (any) could significantly impact bookings.
- Popular amenities like Kitchen, TV, Hot water are common but not universal. Offering these can provide a competitive edge.
Recommendations for Hosts
- Ensure your listing includes all essential amenities for New Delhi: Wifi, Air conditioning.
- Prioritize adding missing essentials: Wifi, Air conditioning.
- Consider adding popular differentiators like Kitchen or TV to increase appeal.
- Highlight unique or less common amenities you offer (e.g., hot tub, dedicated workspace, EV charger) in your listing description and photos.
- Regularly check competitor amenities in New Delhi to stay competitive.
New Delhi Airbnb Guest Demographics & Profile Analysis (2026)
Guest Profile Summary for New Delhi
- The typical guest profile for Airbnb in New Delhi consists of a mix of domestic (55%) and international guests, often arriving from nearby New Delhi, typically belonging to the Post-2000s (Gen Z/Alpha) group (50%), primarily speaking English or Hindi.
- Domestic travelers account for 55.0% of guests.
- Key international markets include India (55%) and United States (12.9%).
- Top languages spoken are English (42.1%) followed by Hindi (27.9%).
- A significant demographic segment is the Post-2000s (Gen Z/Alpha) group, representing 50% of guests.
Recommendations for Hosts
- Balance marketing efforts between domestic and international channels based on the guest mix.
- Tailor amenities and listing descriptions to appeal to the dominant Post-2000s (Gen Z/Alpha) demographic (e.g., highlight fast WiFi, smart home features, local guides).
- Highlight unique local experiences or amenities relevant to the primary guest profile.
- Consider seasonal promotions aligned with peak travel times for key origin markets.
Nearby Short-Term Rental Market Comparison
How does the New Delhi Airbnb market stack up against its neighbors? Compare key performance metrics like average monthly revenue, ADR, and occupancy rates in surrounding areas to understand the broader regional STR landscape.
| Market | Active Properties | Monthly Revenue | Daily Rate | Avg. Occupancy |
|---|---|---|---|---|
| Bissar Akbarpur | 13 | $2,149 | $368.42 | 20% |
| Tauru | 14 | $565 | $159.68 | 15% |
| Bajidpur | 11 | $480 | $64.35 | 27% |
| libiza town | 11 | $380 | $132.31 | 21% |
| Sunrakh | 53 | $335 | $61.47 | 31% |
| Gurugram District | 405 | $289 | $73.78 | 24% |
| Gurugram | 1,252 | $287 | $63.42 | 23% |
| Dwarka | 50 | $278 | $51.02 | 30% |
| Greater Noida | 203 | $262 | $71.19 | 23% |
| Chhatikara | 14 | $241 | $42.28 | 32% |