Port Blair Airbnb Market Analysis 2026: Short Term Rental Data & Vacation Rental Statistics in Andaman and Nicobar Islands, India
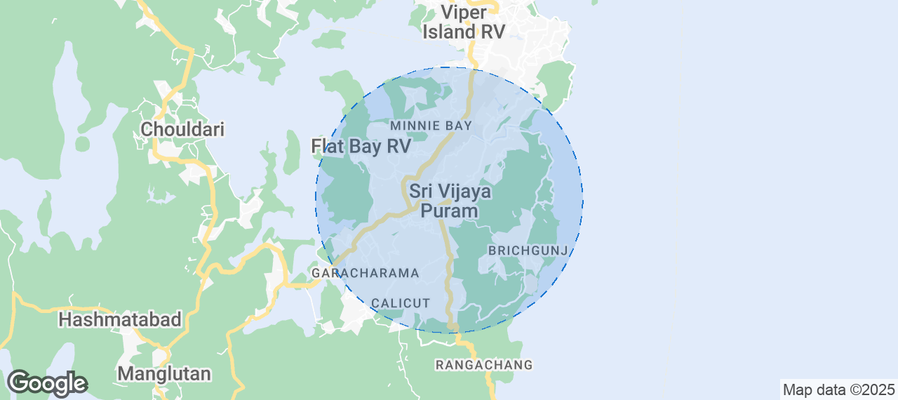
Is Airbnb profitable in Port Blair in 2026? Explore comprehensive Airbnb analytics for Port Blair, Andaman and Nicobar Islands, India to uncover income potential. This 2026 STR market report for Port Blair, based on AirROI data from February 2025 to January 2026, reveals key trends in the niche market of 71 active listings.
Whether you're considering an Airbnb investment in Port Blair, optimizing your existing vacation rental, or exploring rental arbitrage opportunities, understanding the Port Blair Airbnb data is crucial. Leveraging the low regulation environment is key to maximizing your short term rental income potential. Let's dive into the specifics.
Key Port Blair Airbnb Performance Metrics Overview
Monthly Airbnb Revenue Variations & Income Potential in Port Blair (2026)
Understanding the monthly revenue variations for Airbnb listings in Port Blair is key to maximizing your short term rental income potential. Seasonality significantly impacts earnings. Our analysis, based on data from the past 12 months, shows that the peak revenue month for STRs in Port Blair is typically April, while July often presents the lowest earnings, highlighting opportunities for strategic pricing adjustments during shoulder and low seasons. Explore the typical Airbnb income in Port Blair across different performance tiers:
- Best-in-class properties (Top 10%) achieve $756+ monthly, often utilizing dynamic pricing and superior guest experiences.
- Strong performing properties (Top 25%) earn $472 or more, indicating effective management and desirable locations/amenities.
- Typical properties (Median) generate around $228 per month, representing the average market performance.
- Entry-level properties (Bottom 25%) see earnings around $87, often with potential for optimization.
Average Monthly Airbnb Earnings Trend in Port Blair
Port Blair Airbnb Occupancy Rate Trends (2026)
Maximize your bookings by understanding the Port Blair STR occupancy trends. Seasonal demand shifts significantly influence how often properties are booked. Typically, Februarysees the highest demand (peak season occupancy), while July experiences the lowest (low season). Effective strategies, like adjusting minimum stays or offering promotions, can boost occupancy during slower periods. Here's how different property tiers perform in Port Blair:
- Best-in-class properties (Top 10%) achieve 61%+ occupancy, indicating high desirability and potentially optimized availability.
- Strong performing properties (Top 25%) maintain 42% or higher occupancy, suggesting good market fit and guest satisfaction.
- Typical properties (Median) have an occupancy rate around 21%.
- Entry-level properties (Bottom 25%) average 11% occupancy, potentially facing higher vacancy.
Average Monthly Occupancy Rate Trend in Port Blair
Average Daily Rate (ADR) Airbnb Trends in Port Blair (2026)
Effective short term rental pricing strategy in Port Blair involves understanding monthly ADR fluctuations. The Average Daily Rate (ADR) for Airbnb in Port Blair typically peaks in October and dips lowest during August. Leveraging Airbnb dynamic pricing tools or strategies based on this seasonality can significantly boost revenue. Here's a look at the typical nightly rates achieved:
- Best-in-class properties (Top 10%) command rates of $71+ per night, often due to premium features or locations.
- Strong performing properties (Top 25%) achieve nightly rates of $48 or more.
- Typical properties (Median) charge around $28 per night.
- Entry-level properties (Bottom 25%) earn around $19 per night.
Average Daily Rate (ADR) Trend by Month in Port Blair
Get Live Port Blair Market Intelligence 👇
Explore Real-time Analytics
Airbnb Seasonality Analysis & Trends in Port Blair (2026)
Peak Season (April, March, December)
- Revenue averages $761 per month
- Occupancy rates average 34.9%
- Daily rates average $65
Shoulder Season
- Revenue averages $385 per month
- Occupancy maintains around 30.3%
- Daily rates hold near $65
Low Season (June, July, August)
- Revenue drops to average $206 per month
- Occupancy decreases to average 16.9%
- Daily rates adjust to average $44
Seasonality Insights for Port Blair
- The Airbnb seasonality in Port Blair shows highly seasonal trends requiring careful strategy. While the sections above show seasonal averages, it's also insightful to look at the extremes:
- During the high season, the absolute peak month showcases Port Blair's highest earning potential, with monthly revenues capable of climbing to $1,317, occupancy reaching a high of 39.9%, and ADRs peaking at $80.
- Conversely, the slowest single month of the year, typically falling within the low season, marks the market's lowest point. In this month, revenue might dip to $160, occupancy could drop to 12.8%, and ADRs may adjust down to $38.
- Understanding both the seasonal averages and these monthly peaks and troughs in revenue, occupancy, and ADR is crucial for maximizing your Airbnb profit potential in Port Blair.
Seasonal Strategies for Maximizing Profit
- Peak Season: Maximize revenue through premium pricing and potentially longer minimum stays. Ensure high availability.
- Low Season: Offer competitive pricing, special promotions (e.g., extended stay discounts), and flexible cancellation policies. Target off-season travelers like remote workers or budget-conscious guests.
- Shoulder Seasons: Implement dynamic pricing that balances peak and low rates. Target weekend travelers or specific events. Offer slightly more flexible terms than peak season.
- Regularly analyze your own performance against these Port Blair seasonality benchmarks and adjust your pricing and availability strategy accordingly.
Best Areas for Airbnb Investment in Port Blair (2026)
Exploring the top neighborhoods for short-term rentals in Port Blair? This section highlights key areas, outlining why they are attractive for hosts and guests, along with notable local attractions. Consider these locations based on your target guest profile and investment strategy.
| Neighborhood / Area | Why Host Here? (Target Guests & Appeal) | Key Attractions & Landmarks |
|---|---|---|
| Aberdeen Bazaar | The central market area of Port Blair, bustling with local shops and restaurants, making it a great spot for tourists to experience local culture and cuisine. | Cellular Jail, Aberdeen Clock Tower, Local markets, Marina Park, Japanese Bunkers |
| Corbyn's Cove | A beautiful beach destination located just a few kilometers from Port Blair, ideal for sunbathing and water sports, attracting both domestic and international tourists. | Corbyn's Cove Beach, Water sports activities, Sheraton Beach Resort, Lush palm trees, Local shacks and eateries |
| Ross Island | An important historical island with ruins of British colonial structures, rich in history, and offers beautiful view points, ideal for day trips. | Ross Island ruins, Vikend Beach, Photographic spots, Light and sound show, Ideal for historical tours |
| Havelock Island | Famous for its stunning beaches like Radhanagar Beach, an excellent location for beach lovers and divers, making it a hot spot for Airbnb guests. | Radhanagar Beach, Elephant Beach, Scuba diving spots, Kayaking, Natural trails |
| Neil Island | Known for its serene beaches and coral reefs, perfect for peaceful retreats and eco-tourism, appealing to nature lovers and families. | Natural Bridge, Bharatpur Beach, Laxmanpur Beach, Snorkeling spots, Cycling routes |
| Chidiya Tapu | A quiet beach located 30 km from Port Blair, known for its scenic sunset views and untouched nature, a perfect escape for tourists. | Chidiya Tapu Beach, Bird watching, Sunset viewpoints, Trekking trails, Lush greenery |
| Little Andaman Island | A less explored gem, offering pristine beaches and rich biodiversity, ideal for those looking to invest in secluded properties. | Butler Bay Beach, Little Andaman Lighthouse, Waterfalls, Elephant Beach, Rich biodiversity |
| Smith Island | A remote island ideal for eco-tourism and adventure enthusiasts, known for its tranquil environment and beautiful coral reefs. | Coral reefs, Marine life, Snorkeling spots, Serene beaches, Adventure activities |
Understanding Airbnb License Requirements & STR Laws in Port Blair (2026)
While Port Blair, Andaman and Nicobar Islands, India currently shows low STR regulations, specific Airbnb license requirements might still exist or change. Always verify the latest short term rental regulations and Airbnb license requirements directly with local government authorities for Port Blair to ensure full compliance before hosting.
(Source: AirROI data, 2026, finding no licensed listings among those analyzed)
Top Performing Airbnb Properties in Port Blair (2026)
Benchmark your potential! Explore examples of top-performing Airbnb properties in Port Blairbased on Trailing Twelve Month (TTM) revenue. Analyze their characteristics, revenue, occupancy rate, and ADR to understand what drives success in this market.
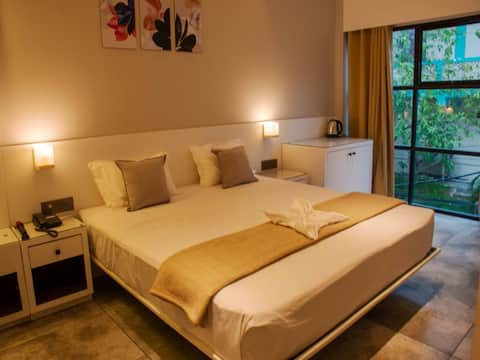
Providence Double Bedroom
Private Room • 1 bedroom

Villa by the Sea - 3 BHK
Entire Place • 3 bedrooms
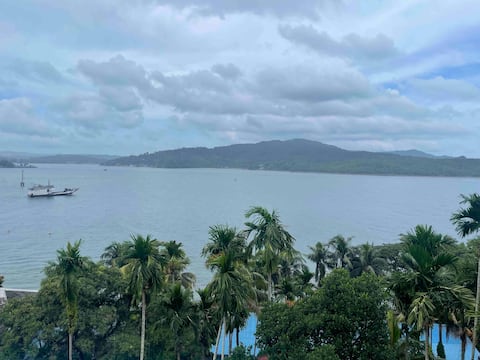
Villa by the Sea - 2 BHK
Entire Place • 2 bedrooms
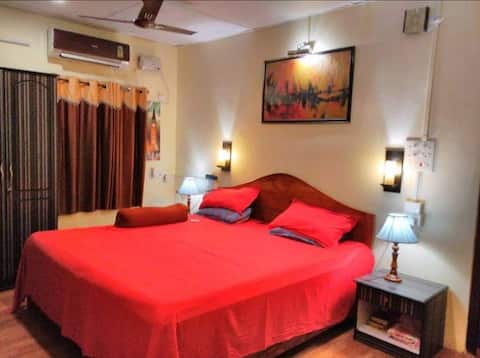
Imperial Heritage villa (Entire 3BHK Villa )
Entire Place • 3 bedrooms

Rest Nest Vacation Homes - Premium Casa 2BHK
Entire Place • 2 bedrooms

Paradise Apartment with Private Outdoor Jacuzzi
Entire Place • 2 bedrooms
Note: Performance varies based on location, size, amenities, seasonality, and management quality. Data reflects the past 12 months.
Top Performing Airbnb Hosts in Port Blair (2026)
Learn from the best! This table showcases top-performing Airbnb hosts in Port Blair based on the number of properties managed and estimated total revenue over the past year. Analyze their scale and performance metrics.
| Host Name | Properties | Grossing Revenue | Stay Reviews | Avg Rating |
|---|---|---|---|---|
| Smitha | 1 | $47,688 | 3 | 3.67/5.0 |
| Zakir | 2 | $32,504 | 127 | 4.89/5.0 |
| Vimal | 5 | $23,013 | 598 | 4.81/5.0 |
| Nisar | 2 | $15,854 | 238 | 4.67/5.0 |
| Mohammed | 1 | $11,264 | 50 | 4.90/5.0 |
| Jonita | 3 | $8,662 | 277 | 4.74/5.0 |
| Santosh | 2 | $8,221 | 63 | 4.88/5.0 |
| Olive Hotel & Suites | 3 | $8,149 | 3 | Not Rated |
| Daniel | 1 | $7,877 | 33 | 4.67/5.0 |
| Revathi | 3 | $5,899 | 8 | 5.00/5.0 |
Analyzing the strategies of top hosts, such as their property selection, pricing, and guest communication, can offer valuable lessons for optimizing your own Airbnb operations in Port Blair.
Dive Deeper: Advanced Port Blair STR Market Data (2026)
Ready to unlock more insights? AirROI provides access to advanced metrics and comprehensive Airbnb data for Port Blair. Explore detailed analytics beyond this report to refine your investment strategy, optimize pricing, and maximize your vacation rental profits.
Explore Advanced MetricsPort Blair Short-Term Rental Market Composition (2026): Property & Room Types
Room Type Distribution
Property Type Distribution
Market Composition Insights for Port Blair
- The Port Blair Airbnb market composition is heavily skewed towards Private Room listings, which make up 77.5% of the 71 active rentals. This indicates strong guest preference for privacy and space.
- Looking at the property type distribution in Port Blair, Hotel/Boutique properties are the most common (67.6%), reflecting the local real estate landscape.
- Houses represent a significant 18.3% portion, catering likely to families or larger groups.
- The presence of 67.6% Hotel/Boutique listings indicates integration with traditional hospitality.
- Smaller segments like outdoor/unique (combined 2.8%) offer potential for unique stay experiences.
Port Blair Airbnb Room Capacity Analysis (2026): Bedroom Distribution
Distribution of Listings by Number of Bedrooms
Room Capacity Insights for Port Blair
- The dominant room capacity in Port Blair is 1 bedroom listings, making up 23.9% of the market. This suggests a strong demand for properties suitable for couples or solo travelers.
- Together, 1 bedroom and 2 bedrooms properties represent 39.4% of the active Airbnb listings in Port Blair, indicating a high concentration in these sizes.
- A significant 22.5% of listings offer 3+ bedrooms, catering to larger groups and families seeking more space in Port Blair.
Port Blair Vacation Rental Guest Capacity Trends (2026)
Distribution of Listings by Guest Capacity
Guest Capacity Insights for Port Blair
- The most common guest capacity trend in Port Blair vacation rentals is listings accommodating 3 guests (14.1%). This suggests the primary traveler segment is likely small families or groups.
- Properties designed for 3 guests and 2 guests dominate the Port Blair STR market, accounting for 28.2% of listings.
- On average, properties in Port Blair are equipped to host 1.8 guests.
Port Blair Airbnb Booking Patterns (2026): Available vs. Booked Days
Available Days Distribution
Booked Days Distribution
Booking Pattern Insights for Port Blair
- The most common availability pattern in Port Blair falls within the 271-366 days range, representing 74.6% of listings. This suggests many properties have significant open periods on their calendars.
- Approximately 94.3% of listings show high availability (181+ days open annually), indicating potential for increased bookings or specific owner usage patterns.
- For booked days, the 1-30 days range is most frequent in Port Blair (47.9%), reflecting common guest stay durations or potential owner blocking patterns.
- A notable 7.0% of properties secure long booking periods (181+ days booked per year), highlighting successful long-term rental strategies or significant owner usage.
Port Blair Airbnb Minimum Stay Requirements Analysis
Distribution of Listings by Minimum Night Requirement
1 Night
69 listings
97.2% of total
30+ Nights
2 listings
2.8% of total
Key Insights
- The most prevalent minimum stay requirement in Port Blair is 1 Night, adopted by 97.2% of listings. This highlights the market's preference for shorter, flexible bookings.
- A strong majority (97.2%) of the Port Blair Airbnb data shows acceptance of very short stays (1-2 nights), indicating a dynamic, high-turnover market.
- Dedicated monthly rentals (30+ nights) represent a small niche (2.8%), possibly an untapped area for hosts.
Recommendations
- Align with the market by considering a 1 Night minimum stay, as 97.2% of Port Blair hosts use this setting.
- Adjust minimum nights based on seasonality – potentially shorter during low season and longer during peak demand periods in Port Blair.
Port Blair Airbnb Cancellation Policy Trends Analysis (2026)
Limited
6 listings
8.5% of total
Flexible
24 listings
33.8% of total
Moderate
14 listings
19.7% of total
Firm
26 listings
36.6% of total
Strict
1 listings
1.4% of total
Cancellation Policy Insights for Port Blair
- The prevailing Airbnb cancellation policy trend in Port Blair is Firm, used by 36.6% of listings.
- There's a relatively balanced mix between guest-friendly (53.5%) and stricter (38.0%) policies, offering choices for different guest needs.
- Strict cancellation policies are quite rare (1.4%), potentially making listings with this policy less competitive unless justified by high demand or property type.
Recommendations for Hosts
- Consider adopting a Firm policy to align with the 36.6% market standard in Port Blair.
- Using a Strict policy might deter some guests, as only 1.4% of listings use it. Evaluate if potential revenue protection outweighs possible lower booking rates.
- Regularly review your cancellation policy against competitors and market demand shifts in Port Blair.
Port Blair STR Booking Lead Time Analysis (2026)
Average Booking Lead Time by Month
Booking Lead Time Insights for Port Blair
- The overall average booking lead time for vacation rentals in Port Blair is 32 days.
- Guests book furthest in advance for stays during November (average 42 days), likely coinciding with peak travel demand or local events.
- The shortest booking windows occur for stays in July (average 19 days), indicating more last-minute travel plans during this time.
- Seasonally, Fall (33 days avg.) sees the longest lead times, while Summer (20 days avg.) has the shortest, reflecting typical travel planning cycles.
Recommendations for Hosts
- Use the overall average lead time (32 days) as a baseline for your pricing and availability strategy in Port Blair.
- Target marketing efforts for the Fall season well in advance (at least 33 days) to capture early planners.
- Monitor your own booking lead times against these Port Blair averages to identify opportunities for dynamic pricing adjustments.
Popular & Essential Airbnb Amenities in Port Blair (2026)
Amenity Prevalence
Amenity Insights for Port Blair
- Essential amenities in Port Blair that guests expect include: Air conditioning. Lacking these (this) could significantly impact bookings.
- Popular amenities like Wifi, TV, Free parking on premises are common but not universal. Offering these can provide a competitive edge.
- Warning: Wifi is not universally provided but is considered essential globally. Ensure reliable Wifi is offered.
Recommendations for Hosts
- Ensure your listing includes all essential amenities for Port Blair: Air conditioning.
- Prioritize adding missing essentials: Air conditioning.
- Consider adding popular differentiators like Wifi or TV to increase appeal.
- Highlight unique or less common amenities you offer (e.g., hot tub, dedicated workspace, EV charger) in your listing description and photos.
- Regularly check competitor amenities in Port Blair to stay competitive.
Port Blair Airbnb Guest Demographics & Profile Analysis (2026)
Guest Profile Summary for Port Blair
- The typical guest profile for Airbnb in Port Blair consists of primarily domestic travelers (80%), often arriving from nearby Bengaluru, typically belonging to the Post-2000s (Gen Z/Alpha) group (50%), primarily speaking English or Hindi.
- Domestic travelers account for 80.1% of guests.
- Key international markets include India (80.1%) and United States (5.5%).
- Top languages spoken are English (40.1%) followed by Hindi (31.5%).
- A significant demographic segment is the Post-2000s (Gen Z/Alpha) group, representing 50% of guests.
Recommendations for Hosts
- Target domestic marketing efforts towards travelers from Bengaluru and Kolkata.
- Tailor amenities and listing descriptions to appeal to the dominant Post-2000s (Gen Z/Alpha) demographic (e.g., highlight fast WiFi, smart home features, local guides).
- Highlight unique local experiences or amenities relevant to the primary guest profile.
- Consider seasonal promotions aligned with peak travel times for key origin markets.
Nearby Short-Term Rental Market Comparison
How does the Port Blair Airbnb market stack up against its neighbors? Compare key performance metrics like average monthly revenue, ADR, and occupancy rates in surrounding areas to understand the broader regional STR landscape.
| Market | Active Properties | Monthly Revenue | Daily Rate | Avg. Occupancy |
|---|---|---|---|---|
| Govind Nagar | 12 | $192 | $142.33 | 21% |
| Vijay Nagar | 12 | $178 | $60.50 | 22% |