Ólafsfjörður Airbnb Market Analysis 2026: Short Term Rental Data & Vacation Rental Statistics in Fjallabyggð, Iceland
Is Airbnb profitable in Ólafsfjörður in 2026? Explore comprehensive Airbnb analytics for Ólafsfjörður, Fjallabyggð, Iceland to uncover income potential. This 2026 STR market report for Ólafsfjörður, based on AirROI data from February 2025 to January 2026, reveals key trends in the niche market of 19 active listings.
Whether you're considering an Airbnb investment in Ólafsfjörður, optimizing your existing vacation rental, or exploring rental arbitrage opportunities, understanding the Ólafsfjörður Airbnb data is crucial. Understanding the local regulations is key to maximizing your short term rental income potential. Let's dive into the specifics.
Key Ólafsfjörður Airbnb Performance Metrics Overview
Monthly Airbnb Revenue Variations & Income Potential in Ólafsfjörður (2026)
Understanding the monthly revenue variations for Airbnb listings in Ólafsfjörður is key to maximizing your short term rental income potential. Seasonality significantly impacts earnings. Our analysis, based on data from the past 12 months, shows that the peak revenue month for STRs in Ólafsfjörður is typically July, while November often presents the lowest earnings, highlighting opportunities for strategic pricing adjustments during shoulder and low seasons. Explore the typical Airbnb income in Ólafsfjörður across different performance tiers:
- Best-in-class properties (Top 10%) achieve $7,211+ monthly, often utilizing dynamic pricing and superior guest experiences.
- Strong performing properties (Top 25%) earn $4,386 or more, indicating effective management and desirable locations/amenities.
- Typical properties (Median) generate around $2,411 per month, representing the average market performance.
- Entry-level properties (Bottom 25%) see earnings around $1,414, often with potential for optimization.
Average Monthly Airbnb Earnings Trend in Ólafsfjörður
Ólafsfjörður Airbnb Occupancy Rate Trends (2026)
Maximize your bookings by understanding the Ólafsfjörður STR occupancy trends. Seasonal demand shifts significantly influence how often properties are booked. Typically, Julysees the highest demand (peak season occupancy), while November experiences the lowest (low season). Effective strategies, like adjusting minimum stays or offering promotions, can boost occupancy during slower periods. Here's how different property tiers perform in Ólafsfjörður:
- Best-in-class properties (Top 10%) achieve 64%+ occupancy, indicating high desirability and potentially optimized availability.
- Strong performing properties (Top 25%) maintain 54% or higher occupancy, suggesting good market fit and guest satisfaction.
- Typical properties (Median) have an occupancy rate around 37%.
- Entry-level properties (Bottom 25%) average 24% occupancy, potentially facing higher vacancy.
Average Monthly Occupancy Rate Trend in Ólafsfjörður
Average Daily Rate (ADR) Airbnb Trends in Ólafsfjörður (2026)
Effective short term rental pricing strategy in Ólafsfjörður involves understanding monthly ADR fluctuations. The Average Daily Rate (ADR) for Airbnb in Ólafsfjörður typically peaks in June and dips lowest during January. Leveraging Airbnb dynamic pricing tools or strategies based on this seasonality can significantly boost revenue. Here's a look at the typical nightly rates achieved:
- Best-in-class properties (Top 10%) command rates of $399+ per night, often due to premium features or locations.
- Strong performing properties (Top 25%) achieve nightly rates of $347 or more.
- Typical properties (Median) charge around $201 per night.
- Entry-level properties (Bottom 25%) earn around $152 per night.
Average Daily Rate (ADR) Trend by Month in Ólafsfjörður
Get Live Ólafsfjörður Market Intelligence 👇

Explore Real-time Analytics
Airbnb Seasonality Analysis & Trends in Ólafsfjörður (2026)
Peak Season (July, August, June)
- Revenue averages $6,287 per month
- Occupancy rates average 67.6%
- Daily rates average $285
Shoulder Season
- Revenue averages $3,403 per month
- Occupancy maintains around 36.4%
- Daily rates hold near $268
Low Season (January, November, December)
- Revenue drops to average $1,667 per month
- Occupancy decreases to average 17.7%
- Daily rates adjust to average $253
Seasonality Insights for Ólafsfjörður
- The Airbnb seasonality in Ólafsfjörður shows highly seasonal trends requiring careful strategy. While the sections above show seasonal averages, it's also insightful to look at the extremes:
- During the high season, the absolute peak month showcases Ólafsfjörður's highest earning potential, with monthly revenues capable of climbing to $7,239, occupancy reaching a high of 77.4%, and ADRs peaking at $288.
- Conversely, the slowest single month of the year, typically falling within the low season, marks the market's lowest point. In this month, revenue might dip to $1,314, occupancy could drop to 15.0%, and ADRs may adjust down to $249.
- Understanding both the seasonal averages and these monthly peaks and troughs in revenue, occupancy, and ADR is crucial for maximizing your Airbnb profit potential in Ólafsfjörður.
Seasonal Strategies for Maximizing Profit
- Peak Season: Maximize revenue through premium pricing and potentially longer minimum stays. Ensure high availability.
- Low Season: Offer competitive pricing, special promotions (e.g., extended stay discounts), and flexible cancellation policies. Target off-season travelers like remote workers or budget-conscious guests.
- Shoulder Seasons: Implement dynamic pricing that balances peak and low rates. Target weekend travelers or specific events. Offer slightly more flexible terms than peak season.
- Regularly analyze your own performance against these Ólafsfjörður seasonality benchmarks and adjust your pricing and availability strategy accordingly.
Best Areas for Airbnb Investment in Ólafsfjörður (2026)
Exploring the top neighborhoods for short-term rentals in Ólafsfjörður? This section highlights key areas, outlining why they are attractive for hosts and guests, along with notable local attractions. Consider these locations based on your target guest profile and investment strategy.
| Neighborhood / Area | Why Host Here? (Target Guests & Appeal) | Key Attractions & Landmarks |
|---|---|---|
| Ólafsfjörður Town | A quaint fishing town located by the scenic fjord, offering stunning views and a peaceful environment. Ideal for visitors seeking a relaxing getaway amidst nature. | Ólafsfjörður swimming pool, Gufu Waterfall, Fishing experiences, Local museums, Hiking paths in surrounding mountains, Reykjavik excursions |
| Dalvik | Nearby Dalvik is a vibrant town offering opportunities for whale watching and outdoor activities. It's a great spot for tourists looking for adventure and local culture. | Whale watching tours, Dalvik swimming pool, Local restaurants, Fjord views, Hiking trails, Cultural events |
| Siglufjörður | Rich in history, particularly related to the herring industry, Siglufjörður is charming with its colorful houses and museums, attracting history buffs and tourists. | Herring Era Museum, Siglufjörður harbor, Northern Lights exploration, Local cafes and shops, Hiking routes to nearby mountains, Art festivals |
| Eyjafjörður | The Eyjafjörður fjord area provides stunning landscapes and various outdoor activities. It's a popular destination for tourists who love nature and tranquility. | Fishing, Kayaking, Hiking, Scenic drives, Bird watching, Horseback riding |
| Akureyri | Iceland's second-largest city, Akureyri offers urban amenities, rich culture, and proximity to natural wonders. Great for travelers wanting both city life and nature. | Akureyri Botanical Garden, Akureyri Church, Local shops and cafes, Jón Sveinsson's house, Skiing (in winter), Art galleries |
| Múlagljúfur Canyon | Famous for its dramatic landscapes and hiking trails, Múlagljúfur Canyon attracts tourists seeking breathtaking views and outdoor adventures. | Hiking trails, Bird watching, Photography, Nature tours, Waterfalls, Scenic viewpoints |
| Tröllaskagi Peninsula | Known for its dramatic scenery and quaint fishing villages. It's popular among outdoor enthusiasts and those seeking a serene holiday retreat. | Beautiful fjords, Hiking trails, Fishing spots, Local art shops, Historical sites, Photography locations |
| Húsavík | Often referred to as the whale watching capital of Iceland. It offers vibrant local culture and is a stepping stone for exploring the North of Iceland. | Whale watching tours, Húsavík Whale Museum, Mud baths, Cultural festivals, Hiking in surrounding areas, Local seafood restaurants |
Understanding Airbnb License Requirements & STR Laws in Ólafsfjörður (2026)
With 11% of listings showing registration in 2026, understanding potential Airbnb license requirements is crucial in Ólafsfjörður. Always verify the latest short term rental regulations and Airbnb license requirements directly with local government authorities for Ólafsfjörður to ensure full compliance before hosting.
(Source: AirROI data, 2026, based on 11% licensed listings)
Top Performing Airbnb Properties in Ólafsfjörður (2026)
Benchmark your potential! Explore examples of top-performing Airbnb properties in Ólafsfjörðurbased on Trailing Twelve Month (TTM) revenue. Analyze their characteristics, revenue, occupancy rate, and ADR to understand what drives success in this market.

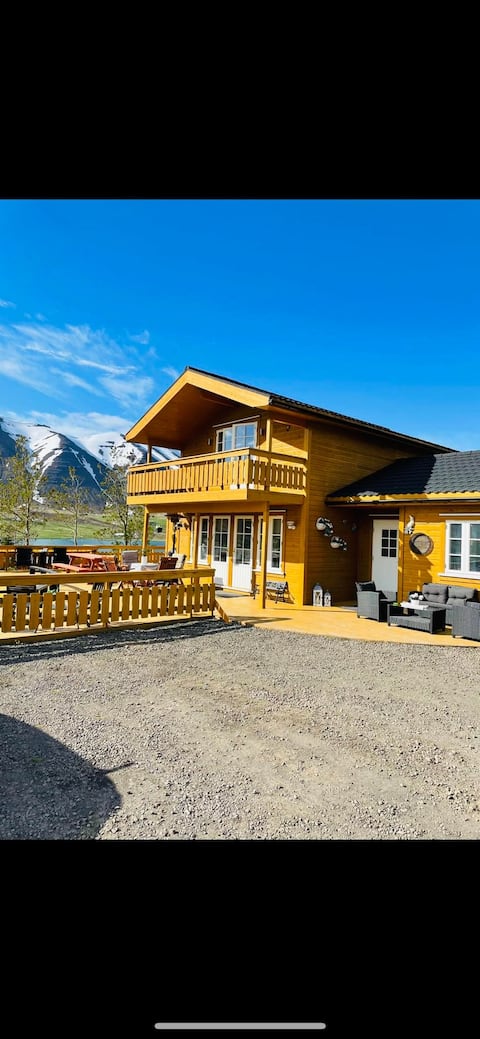
Bakkabyggd - A lake view villa
Entire Place • 4 bedrooms
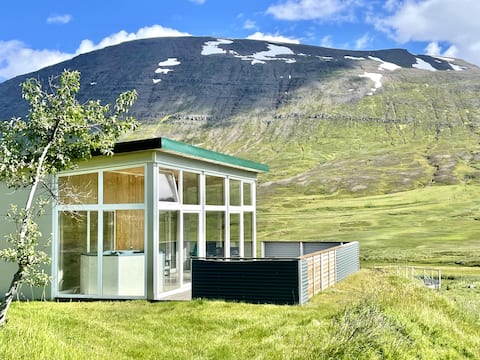
Mountain Cottage - indoor hot tub
Entire Place • 2 bedrooms
Family paradise in the country
Entire Place • 3 bedrooms

Mountain Cottage w/indoor hot tub
Entire Place • 2 bedrooms

Cylinderot 12
Entire Place • 2 bedrooms

Hidden Cabin with Outdoor Hot tub
Entire Place • 3 bedrooms
Note: Performance varies based on location, size, amenities, seasonality, and management quality. Data reflects the past 12 months.
Top Performing Airbnb Hosts in Ólafsfjörður (2026)
Learn from the best! This table showcases top-performing Airbnb hosts in Ólafsfjörður based on the number of properties managed and estimated total revenue over the past year. Analyze their scale and performance metrics.
| Host Name | Properties | Grossing Revenue | Stay Reviews | Avg Rating |
|---|---|---|---|---|
| Ægir Rafn | 1 | $170,978 | 9 | 5.00/5.0 |
| Lea | 3 | $162,890 | 380 | 4.81/5.0 |
| Svava | 1 | $66,891 | 65 | 4.95/5.0 |
| Þuríður | 1 | $44,157 | 40 | 4.93/5.0 |
| Áslaug Inga | 3 | $34,760 | 41 | 4.54/5.0 |
| Sigrun | 1 | $32,681 | 25 | 4.80/5.0 |
| Mikael | 1 | $25,904 | 169 | 4.93/5.0 |
| Margrét Rögnvaldsdóttir | 1 | $25,353 | 19 | 4.89/5.0 |
| Þorsteinn | 1 | $21,243 | 107 | 4.97/5.0 |
| Kristjana | 1 | $20,362 | 462 | 4.90/5.0 |
Analyzing the strategies of top hosts, such as their property selection, pricing, and guest communication, can offer valuable lessons for optimizing your own Airbnb operations in Ólafsfjörður.
Dive Deeper: Advanced Ólafsfjörður STR Market Data (2026)
Ready to unlock more insights? AirROI provides access to advanced metrics and comprehensive Airbnb data for Ólafsfjörður. Explore detailed analytics beyond this report to refine your investment strategy, optimize pricing, and maximize your vacation rental profits.
Explore Advanced MetricsÓlafsfjörður Short-Term Rental Market Composition (2026): Property & Room Types
Room Type Distribution
Property Type Distribution
Market Composition Insights for Ólafsfjörður
- The Ólafsfjörður Airbnb market composition is heavily skewed towards Entire Home/Apt listings, which make up 84.2% of the 19 active rentals. This indicates strong guest preference for privacy and space.
- Looking at the property type distribution in Ólafsfjörður, House properties are the most common (52.6%), reflecting the local real estate landscape.
- Houses represent a significant 52.6% portion, catering likely to families or larger groups.
- The presence of 15.8% Hotel/Boutique listings indicates integration with traditional hospitality.
Ólafsfjörður Airbnb Room Capacity Analysis (2026): Bedroom Distribution
Distribution of Listings by Number of Bedrooms
Room Capacity Insights for Ólafsfjörður
- The dominant room capacity in Ólafsfjörður is 2 bedrooms listings, making up 42.1% of the market. This suggests a strong demand for properties suitable for couples or solo travelers.
- Together, 2 bedrooms and 1 bedroom properties represent 63.2% of the active Airbnb listings in Ólafsfjörður, indicating a high concentration in these sizes.
- A significant 26.4% of listings offer 3+ bedrooms, catering to larger groups and families seeking more space in Ólafsfjörður.
Ólafsfjörður Vacation Rental Guest Capacity Trends (2026)
Distribution of Listings by Guest Capacity
Guest Capacity Insights for Ólafsfjörður
- The most common guest capacity trend in Ólafsfjörður vacation rentals is listings accommodating 4 guests (42.1%). This suggests the primary traveler segment is likely small families or groups.
- Properties designed for 4 guests and 6 guests dominate the Ólafsfjörður STR market, accounting for 57.9% of listings.
- 31.6% of properties accommodate 6+ guests, serving the market segment for larger families or group travel in Ólafsfjörður.
- On average, properties in Ólafsfjörður are equipped to host 4.4 guests.
Ólafsfjörður Airbnb Booking Patterns (2026): Available vs. Booked Days
Available Days Distribution
Booked Days Distribution
Booking Pattern Insights for Ólafsfjörður
- The most common availability pattern in Ólafsfjörður falls within the 181-270 days range, representing 57.9% of listings. This suggests many properties have significant open periods on their calendars.
- Approximately 84.2% of listings show high availability (181+ days open annually), indicating potential for increased bookings or specific owner usage patterns.
- For booked days, the 91-180 days range is most frequent in Ólafsfjörður (63.2%), reflecting common guest stay durations or potential owner blocking patterns.
- A notable 15.8% of properties secure long booking periods (181+ days booked per year), highlighting successful long-term rental strategies or significant owner usage.
Ólafsfjörður Airbnb Minimum Stay Requirements Analysis
Distribution of Listings by Minimum Night Requirement
1 Night
9 listings
47.4% of total
2 Nights
5 listings
26.3% of total
3 Nights
2 listings
10.5% of total
30+ Nights
3 listings
15.8% of total
Key Insights
- The most prevalent minimum stay requirement in Ólafsfjörður is 1 Night, adopted by 47.4% of listings. This highlights the market's preference for shorter, flexible bookings.
- A strong majority (73.7%) of the Ólafsfjörður Airbnb data shows acceptance of very short stays (1-2 nights), indicating a dynamic, high-turnover market.
- A significant segment (15.8%) caters to monthly stays (30+ nights) in Ólafsfjörður, pointing to opportunities in the extended-stay market.
Recommendations
- Align with the market by considering a 1 Night minimum stay, as 47.4% of Ólafsfjörður hosts use this setting.
- Explore offering discounts for stays of 30+ nights to attract the 15.8% of the market seeking extended stays.
- Adjust minimum nights based on seasonality – potentially shorter during low season and longer during peak demand periods in Ólafsfjörður.
Ólafsfjörður Airbnb Cancellation Policy Trends Analysis (2026)
Flexible
7 listings
36.8% of total
Moderate
7 listings
36.8% of total
Firm
5 listings
26.3% of total
Cancellation Policy Insights for Ólafsfjörður
- The prevailing Airbnb cancellation policy trend in Ólafsfjörður is Flexible, used by 36.8% of listings.
- The market strongly favors guest-friendly terms, with 73.6% of listings offering Flexible or Moderate policies. This suggests guests in Ólafsfjörður may expect booking flexibility.
Recommendations for Hosts
- Consider adopting a Flexible policy to align with the 36.8% market standard in Ólafsfjörður.
- Regularly review your cancellation policy against competitors and market demand shifts in Ólafsfjörður.
Ólafsfjörður STR Booking Lead Time Analysis (2026)
Average Booking Lead Time by Month
Booking Lead Time Insights for Ólafsfjörður
- The overall average booking lead time for vacation rentals in Ólafsfjörður is 91 days.
- Guests book furthest in advance for stays during July (average 122 days), likely coinciding with peak travel demand or local events.
- The shortest booking windows occur for stays in October (average 57 days), indicating more last-minute travel plans during this time.
- Seasonally, Summer (107 days avg.) sees the longest lead times, while Fall (73 days avg.) has the shortest, reflecting typical travel planning cycles.
Recommendations for Hosts
- Use the overall average lead time (91 days) as a baseline for your pricing and availability strategy in Ólafsfjörður.
- For July stays, consider implementing length-of-stay discounts or slightly higher rates for bookings made less than 122 days out to capitalize on advance planning.
- Target marketing efforts for the Summer season well in advance (at least 107 days) to capture early planners.
- Monitor your own booking lead times against these Ólafsfjörður averages to identify opportunities for dynamic pricing adjustments.
Popular & Essential Airbnb Amenities in Ólafsfjörður (2026)
Amenity Prevalence
Amenity Insights for Ólafsfjörður
- Essential amenities in Ólafsfjörður that guests expect include: Heating. Lacking these (this) could significantly impact bookings.
- Popular amenities like Refrigerator, Kitchen, Wifi are common but not universal. Offering these can provide a competitive edge.
- Warning: Wifi is not universally provided but is considered essential globally. Ensure reliable Wifi is offered.
Recommendations for Hosts
- Ensure your listing includes all essential amenities for Ólafsfjörður: Heating.
- Consider adding popular differentiators like Refrigerator or Kitchen to increase appeal.
- Highlight unique or less common amenities you offer (e.g., hot tub, dedicated workspace, EV charger) in your listing description and photos.
- Regularly check competitor amenities in Ólafsfjörður to stay competitive.
Ólafsfjörður Airbnb Guest Demographics & Profile Analysis (2026)
Guest Profile Summary for Ólafsfjörður
- The typical guest profile for Airbnb in Ólafsfjörður consists of predominantly international visitors (98%), with top international origins including Germany, typically belonging to the Post-2000s (Gen Z/Alpha) group (50%), primarily speaking English or German.
- Domestic travelers account for 2.1% of guests.
- Key international markets include United States (36.9%) and Germany (9.9%).
- Top languages spoken are English (44.6%) followed by German (13.7%).
- A significant demographic segment is the Post-2000s (Gen Z/Alpha) group, representing 50% of guests.
Recommendations for Hosts
- Focus marketing internationally, particularly towards travelers from Germany.
- Tailor amenities and listing descriptions to appeal to the dominant Post-2000s (Gen Z/Alpha) demographic (e.g., highlight fast WiFi, smart home features, local guides).
- Highlight unique local experiences or amenities relevant to the primary guest profile.
- Consider seasonal promotions aligned with peak travel times for key origin markets.
Nearby Short-Term Rental Market Comparison
How does the Ólafsfjörður Airbnb market stack up against its neighbors? Compare key performance metrics like average monthly revenue, ADR, and occupancy rates in surrounding areas to understand the broader regional STR landscape.
| Market | Active Properties | Monthly Revenue | Daily Rate | Avg. Occupancy |
|---|---|---|---|---|
| Húsavík | 28 | $3,478 | $313.93 | 55% |
| Mývatn | 10 | $3,254 | $270.76 | 40% |
| Dalvík | 18 | $2,983 | $290.67 | 51% |
| Akureyri | 200 | $2,955 | $273.38 | 46% |
| Varmahlíð | 15 | $2,914 | $260.87 | 44% |
| Húsavík | 20 | $2,864 | $276.82 | 48% |
| Laugar | 26 | $2,814 | $290.43 | 50% |
| Svalbarðseyri | 26 | $2,712 | $192.27 | 55% |
| Hofsós | 11 | $2,605 | $238.10 | 43% |
| Þingeyjarsveit | 16 | $2,548 | $231.88 | 53% |