Búðardalur Airbnb Market Analysis 2026: Short Term Rental Data & Vacation Rental Statistics in Dalabyggð, Iceland
Is Airbnb profitable in Búðardalur in 2026? Explore comprehensive Airbnb analytics for Búðardalur, Dalabyggð, Iceland to uncover income potential. This 2026 STR market report for Búðardalur, based on AirROI data from February 2025 to January 2026, reveals key trends in the niche market of 30 active listings.
Whether you're considering an Airbnb investment in Búðardalur, optimizing your existing vacation rental, or exploring rental arbitrage opportunities, understanding the Búðardalur Airbnb data is crucial. Understanding the local regulations is key to maximizing your short term rental income potential. Let's dive into the specifics.
Key Búðardalur Airbnb Performance Metrics Overview
Monthly Airbnb Revenue Variations & Income Potential in Búðardalur (2026)
Understanding the monthly revenue variations for Airbnb listings in Búðardalur is key to maximizing your short term rental income potential. Seasonality significantly impacts earnings. Our analysis, based on data from the past 12 months, shows that the peak revenue month for STRs in Búðardalur is typically August, while February often presents the lowest earnings, highlighting opportunities for strategic pricing adjustments during shoulder and low seasons. Explore the typical Airbnb income in Búðardalur across different performance tiers:
- Best-in-class properties (Top 10%) achieve $6,483+ monthly, often utilizing dynamic pricing and superior guest experiences.
- Strong performing properties (Top 25%) earn $4,293 or more, indicating effective management and desirable locations/amenities.
- Typical properties (Median) generate around $1,939 per month, representing the average market performance.
- Entry-level properties (Bottom 25%) see earnings around $976, often with potential for optimization.
Average Monthly Airbnb Earnings Trend in Búðardalur
Búðardalur Airbnb Occupancy Rate Trends (2026)
Maximize your bookings by understanding the Búðardalur STR occupancy trends. Seasonal demand shifts significantly influence how often properties are booked. Typically, Augustsees the highest demand (peak season occupancy), while January experiences the lowest (low season). Effective strategies, like adjusting minimum stays or offering promotions, can boost occupancy during slower periods. Here's how different property tiers perform in Búðardalur:
- Best-in-class properties (Top 10%) achieve 73%+ occupancy, indicating high desirability and potentially optimized availability.
- Strong performing properties (Top 25%) maintain 56% or higher occupancy, suggesting good market fit and guest satisfaction.
- Typical properties (Median) have an occupancy rate around 33%.
- Entry-level properties (Bottom 25%) average 18% occupancy, potentially facing higher vacancy.
Average Monthly Occupancy Rate Trend in Búðardalur
Average Daily Rate (ADR) Airbnb Trends in Búðardalur (2026)
Effective short term rental pricing strategy in Búðardalur involves understanding monthly ADR fluctuations. The Average Daily Rate (ADR) for Airbnb in Búðardalur typically peaks in October and dips lowest during March. Leveraging Airbnb dynamic pricing tools or strategies based on this seasonality can significantly boost revenue. Here's a look at the typical nightly rates achieved:
- Best-in-class properties (Top 10%) command rates of $387+ per night, often due to premium features or locations.
- Strong performing properties (Top 25%) achieve nightly rates of $243 or more.
- Typical properties (Median) charge around $190 per night.
- Entry-level properties (Bottom 25%) earn around $149 per night.
Average Daily Rate (ADR) Trend by Month in Búðardalur
Get Live Búðardalur Market Intelligence 👇

Explore Real-time Analytics
Airbnb Seasonality Analysis & Trends in Búðardalur (2026)
Peak Season (August, July, September)
- Revenue averages $4,534 per month
- Occupancy rates average 59.5%
- Daily rates average $224
Shoulder Season
- Revenue averages $2,924 per month
- Occupancy maintains around 33.8%
- Daily rates hold near $226
Low Season (January, February, November)
- Revenue drops to average $2,063 per month
- Occupancy decreases to average 24.4%
- Daily rates adjust to average $232
Seasonality Insights for Búðardalur
- The Airbnb seasonality in Búðardalur shows highly seasonal trends requiring careful strategy. While the sections above show seasonal averages, it's also insightful to look at the extremes:
- During the high season, the absolute peak month showcases Búðardalur's highest earning potential, with monthly revenues capable of climbing to $4,949, occupancy reaching a high of 70.1%, and ADRs peaking at $255.
- Conversely, the slowest single month of the year, typically falling within the low season, marks the market's lowest point. In this month, revenue might dip to $1,848, occupancy could drop to 17.2%, and ADRs may adjust down to $208.
- Understanding both the seasonal averages and these monthly peaks and troughs in revenue, occupancy, and ADR is crucial for maximizing your Airbnb profit potential in Búðardalur.
Seasonal Strategies for Maximizing Profit
- Peak Season: Maximize revenue through premium pricing and potentially longer minimum stays. Ensure high availability.
- Low Season: Offer competitive pricing, special promotions (e.g., extended stay discounts), and flexible cancellation policies. Target off-season travelers like remote workers or budget-conscious guests.
- Shoulder Seasons: Implement dynamic pricing that balances peak and low rates. Target weekend travelers or specific events. Offer slightly more flexible terms than peak season.
- Regularly analyze your own performance against these Búðardalur seasonality benchmarks and adjust your pricing and availability strategy accordingly.
Best Areas for Airbnb Investment in Búðardalur (2026)
Exploring the top neighborhoods for short-term rentals in Búðardalur? This section highlights key areas, outlining why they are attractive for hosts and guests, along with notable local attractions. Consider these locations based on your target guest profile and investment strategy.
| Neighborhood / Area | Why Host Here? (Target Guests & Appeal) | Key Attractions & Landmarks |
|---|---|---|
| Búðardalur Downtown | The central hub of Búðardalur, providing easy access to local amenities, shops, and restaurants. Great for travelers wanting to experience local culture and cuisine. | Búðardalur Church, Local Art Galleries, Restaurants and Cafes, Nature Walks, Local Festivals |
| Höskuldar | A picturesque area near Búðardalur known for its stunning natural landscapes and hiking opportunities. Ideal for nature lovers and outdoor enthusiasts looking for a serene environment. | Hiking Trails, Scenic Views, Wildlife Watching, Fishing Spots, Camping Sites |
| Bjarnarflag | A popular spot for relaxation and adventure, known for its natural hot springs. It attracts tourists looking for wellness and soothing experiences within nature. | Bjarnarflag Geothermal Area, Hot Springs, Nature Trails, Camping Grounds, Bird Watching |
| Reykhólahreppur | A nearby region that offers stunning coastal views and a rich cultural history. It's perfect for those interested in Icelandic heritage and the scenic beauty of the coastline. | Old Fishing Villages, Scenic Coastal Drives, Cultural Heritage Sites, Whale Watching Tours, Breathtaking Sunsets |
| Súðavík | Another coastal village offering unique views of the fjord and a close-knit community. Travelers seeking a quiet stay in a beautiful natural setting would love this area. | Súðavíkurkirkja, Fjord Views, Local Seafood, Nearby Hiking Trails, Historical Sites |
| Vatnsnes Peninsula | Famous for its dramatic landscapes and diverse wildlife, including seals. A must-visit for nature enthusiasts interested in outdoor activities and photography. | Seal Watching, Hiking Trails, Beautiful Beaches, Scenic Lookouts, Nature Reserves |
| Öxarfjörður | Known for its scenic fjords and rural charm, this area offers visitors a peaceful retreat away from the busier tourist spots, with plenty of outdoor activities. | Fishing Opportunities, Scenic Drives, Cultural Sites, Bird Watching, Hiking Trails |
| Kirkjufell | Famous for the iconic mountain and nearby waterfalls. Attracts photographers and nature lovers looking to capture the stunning Icelandic landscape. | Kirkjufell Mountain, Waterfalls, Hiking Paths, Photography Spots, Local Legends |
Understanding Airbnb License Requirements & STR Laws in Búðardalur (2026)
With 10% of listings showing registration in 2026, understanding potential Airbnb license requirements is crucial in Búðardalur. Always verify the latest short term rental regulations and Airbnb license requirements directly with local government authorities for Búðardalur to ensure full compliance before hosting.
(Source: AirROI data, 2026, based on 10% licensed listings)
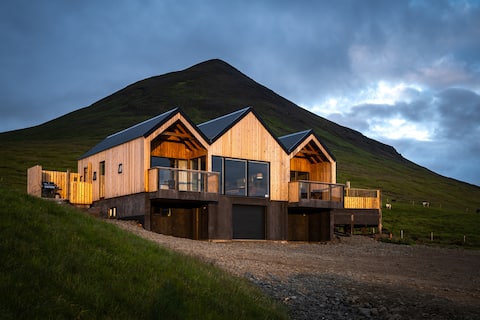
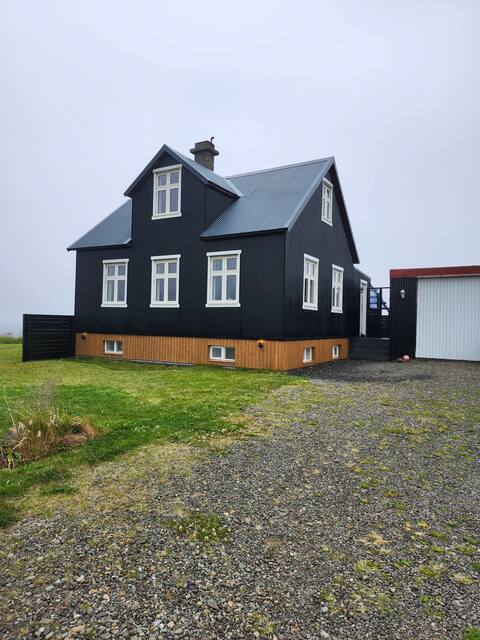
Top Performing Airbnb Properties in Búðardalur (2026)
Benchmark your potential! Explore examples of top-performing Airbnb properties in Búðardalurbased on Trailing Twelve Month (TTM) revenue. Analyze their characteristics, revenue, occupancy rate, and ADR to understand what drives success in this market.
Háafell Lodge
Entire Place • 2 bedrooms

Mirror Cabin (Mystic Light Lodge)
Entire Place • 1 bedroom

Thurranes cottage 2
Entire Place • 3 bedrooms
Thurranes cottage 1
Entire Place • 3 bedrooms
Ocean front, Mountain View, Private hot tub
Entire Place • 5 bedrooms
Thurranes cottage 3
Entire Place • 3 bedrooms
Note: Performance varies based on location, size, amenities, seasonality, and management quality. Data reflects the past 12 months.
Top Performing Airbnb Hosts in Búðardalur (2026)
Learn from the best! This table showcases top-performing Airbnb hosts in Búðardalur based on the number of properties managed and estimated total revenue over the past year. Analyze their scale and performance metrics.
| Host Name | Properties | Grossing Revenue | Stay Reviews | Avg Rating |
|---|---|---|---|---|
| Jón Ingi | 3 | $149,737 | 370 | 4.80/5.0 |
| Finnur And Guðrún | 1 | $129,713 | 258 | 5.00/5.0 |
| Esther | 1 | $103,405 | 27 | 5.00/5.0 |
| Svarfhóll | 7 | $103,076 | 2128 | 4.73/5.0 |
| Níels Sigurður | 5 | $49,542 | 943 | 4.83/5.0 |
| Agnes & Fannar | 1 | $46,734 | 77 | 4.95/5.0 |
| Dagný & Reynir | 1 | $43,234 | 139 | 4.91/5.0 |
| Soffía Ingibjörg | 2 | $41,638 | 56 | 4.63/5.0 |
| Leifur Steinn | 3 | $40,429 | 33 | 4.56/5.0 |
| Thora | 2 | $35,910 | 15 | 4.85/5.0 |
Analyzing the strategies of top hosts, such as their property selection, pricing, and guest communication, can offer valuable lessons for optimizing your own Airbnb operations in Búðardalur.
Dive Deeper: Advanced Búðardalur STR Market Data (2026)
Ready to unlock more insights? AirROI provides access to advanced metrics and comprehensive Airbnb data for Búðardalur. Explore detailed analytics beyond this report to refine your investment strategy, optimize pricing, and maximize your vacation rental profits.
Explore Advanced MetricsBúðardalur Short-Term Rental Market Composition (2026): Property & Room Types
Room Type Distribution
Property Type Distribution
Market Composition Insights for Búðardalur
- The Búðardalur Airbnb market composition is heavily skewed towards Private Room listings, which make up 50% of the 30 active rentals. This indicates strong guest preference for privacy and space.
- Looking at the property type distribution in Búðardalur, House properties are the most common (50%), reflecting the local real estate landscape.
- Houses represent a significant 50% portion, catering likely to families or larger groups.
- The presence of 16.7% Hotel/Boutique listings indicates integration with traditional hospitality.
Búðardalur Airbnb Room Capacity Analysis (2026): Bedroom Distribution
Distribution of Listings by Number of Bedrooms
Room Capacity Insights for Búðardalur
- The dominant room capacity in Búðardalur is 1 bedroom listings, making up 40% of the market. This suggests a strong demand for properties suitable for couples or solo travelers.
- Together, 1 bedroom and 3 bedrooms properties represent 56.7% of the active Airbnb listings in Búðardalur, indicating a high concentration in these sizes.
Búðardalur Vacation Rental Guest Capacity Trends (2026)
Distribution of Listings by Guest Capacity
Guest Capacity Insights for Búðardalur
- The most common guest capacity trend in Búðardalur vacation rentals is listings accommodating 2 guests (30%). This suggests the primary traveler segment is likely couples or solo travelers.
- Properties designed for 2 guests and 6 guests dominate the Búðardalur STR market, accounting for 53.3% of listings.
- 23.3% of properties accommodate 6+ guests, serving the market segment for larger families or group travel in Búðardalur.
- On average, properties in Búðardalur are equipped to host 2.7 guests.
Búðardalur Airbnb Booking Patterns (2026): Available vs. Booked Days
Available Days Distribution
Booked Days Distribution
Booking Pattern Insights for Búðardalur
- The most common availability pattern in Búðardalur falls within the 271-366 days range, representing 43.3% of listings. This suggests many properties have significant open periods on their calendars.
- Approximately 83.3% of listings show high availability (181+ days open annually), indicating potential for increased bookings or specific owner usage patterns.
- For booked days, the 91-180 days range is most frequent in Búðardalur (40%), reflecting common guest stay durations or potential owner blocking patterns.
- A notable 16.7% of properties secure long booking periods (181+ days booked per year), highlighting successful long-term rental strategies or significant owner usage.
Búðardalur Airbnb Minimum Stay Requirements Analysis
Distribution of Listings by Minimum Night Requirement
1 Night
20 listings
66.7% of total
2 Nights
5 listings
16.7% of total
30+ Nights
5 listings
16.7% of total
Key Insights
- The most prevalent minimum stay requirement in Búðardalur is 1 Night, adopted by 66.7% of listings. This highlights the market's preference for shorter, flexible bookings.
- A strong majority (83.4%) of the Búðardalur Airbnb data shows acceptance of very short stays (1-2 nights), indicating a dynamic, high-turnover market.
- A significant segment (16.7%) caters to monthly stays (30+ nights) in Búðardalur, pointing to opportunities in the extended-stay market.
Recommendations
- Align with the market by considering a 1 Night minimum stay, as 66.7% of Búðardalur hosts use this setting.
- Explore offering discounts for stays of 30+ nights to attract the 16.7% of the market seeking extended stays.
- Adjust minimum nights based on seasonality – potentially shorter during low season and longer during peak demand periods in Búðardalur.
Búðardalur Airbnb Cancellation Policy Trends Analysis (2026)
Flexible
3 listings
10% of total
Moderate
22 listings
73.3% of total
Firm
5 listings
16.7% of total
Cancellation Policy Insights for Búðardalur
- The prevailing Airbnb cancellation policy trend in Búðardalur is Moderate, used by 73.3% of listings.
- The market strongly favors guest-friendly terms, with 83.3% of listings offering Flexible or Moderate policies. This suggests guests in Búðardalur may expect booking flexibility.
Recommendations for Hosts
- Consider adopting a Moderate policy to align with the 73.3% market standard in Búðardalur.
- Regularly review your cancellation policy against competitors and market demand shifts in Búðardalur.
Búðardalur STR Booking Lead Time Analysis (2026)
Average Booking Lead Time by Month
Booking Lead Time Insights for Búðardalur
- The overall average booking lead time for vacation rentals in Búðardalur is 85 days.
- Guests book furthest in advance for stays during August (average 99 days), likely coinciding with peak travel demand or local events.
- The shortest booking windows occur for stays in January (average 33 days), indicating more last-minute travel plans during this time.
- Seasonally, Summer (96 days avg.) sees the longest lead times, while Winter (51 days avg.) has the shortest, reflecting typical travel planning cycles.
Recommendations for Hosts
- Use the overall average lead time (85 days) as a baseline for your pricing and availability strategy in Búðardalur.
- For August stays, consider implementing length-of-stay discounts or slightly higher rates for bookings made less than 99 days out to capitalize on advance planning.
- Target marketing efforts for the Summer season well in advance (at least 96 days) to capture early planners.
- Monitor your own booking lead times against these Búðardalur averages to identify opportunities for dynamic pricing adjustments.
Popular & Essential Airbnb Amenities in Búðardalur (2026)
Amenity Prevalence
Amenity Insights for Búðardalur
- Essential amenities in Búðardalur that guests expect include: Smoke alarm, Free parking on premises, Heating, Fire extinguisher. Lacking these (any) could significantly impact bookings.
- Popular amenities like Hot water, Wifi, Coffee maker are common but not universal. Offering these can provide a competitive edge.
- Warning: Wifi is not universally provided but is considered essential globally. Ensure reliable Wifi is offered.
Recommendations for Hosts
- Ensure your listing includes all essential amenities for Búðardalur: Smoke alarm, Free parking on premises, Heating, Fire extinguisher.
- Prioritize adding missing essentials: Heating, Fire extinguisher.
- Consider adding popular differentiators like Hot water or Wifi to increase appeal.
- Highlight unique or less common amenities you offer (e.g., hot tub, dedicated workspace, EV charger) in your listing description and photos.
- Regularly check competitor amenities in Búðardalur to stay competitive.
Búðardalur Airbnb Guest Demographics & Profile Analysis (2026)
Guest Profile Summary for Búðardalur
- The typical guest profile for Airbnb in Búðardalur consists of predominantly international visitors (99%), with top international origins including Germany, typically belonging to the Post-2000s (Gen Z/Alpha) group (50%), primarily speaking English or German.
- Domestic travelers account for 1.2% of guests.
- Key international markets include United States (42.4%) and Germany (9.8%).
- Top languages spoken are English (50%) followed by German (12.4%).
- A significant demographic segment is the Post-2000s (Gen Z/Alpha) group, representing 50% of guests.
Recommendations for Hosts
- Focus marketing internationally, particularly towards travelers from Germany.
- Tailor amenities and listing descriptions to appeal to the dominant Post-2000s (Gen Z/Alpha) demographic (e.g., highlight fast WiFi, smart home features, local guides).
- Highlight unique local experiences or amenities relevant to the primary guest profile.
- Consider seasonal promotions aligned with peak travel times for key origin markets.
Nearby Short-Term Rental Market Comparison
How does the Búðardalur Airbnb market stack up against its neighbors? Compare key performance metrics like average monthly revenue, ADR, and occupancy rates in surrounding areas to understand the broader regional STR landscape.
| Market | Active Properties | Monthly Revenue | Daily Rate | Avg. Occupancy |
|---|---|---|---|---|
| Kjósarhreppur | 26 | $6,581 | $477.84 | 50% |
| Grímsnes- og Grafningshreppur | 30 | $4,760 | $399.23 | 47% |
| Garður | 11 | $4,533 | $267.99 | 59% |
| Sandgerði | 17 | $4,295 | $258.70 | 56% |
| Reykholt | 59 | $4,155 | $334.95 | 51% |
| Akranes | 22 | $4,129 | $286.15 | 58% |
| Grímsnes | 15 | $4,077 | $354.16 | 57% |
| Fludir | 26 | $3,780 | $316.28 | 48% |
| Flúðir | 25 | $3,635 | $275.97 | 51% |
| Hvammstangi | 13 | $3,634 | $213.55 | 56% |