Balatonfüred Airbnb Market Analysis 2026: Short Term Rental Data & Vacation Rental Statistics in Transdanubia, Hungary
Is Airbnb profitable in Balatonfüred in 2026? Explore comprehensive Airbnb analytics for Balatonfüred, Transdanubia, Hungary to uncover income potential. This 2026 STR market report for Balatonfüred, based on AirROI data from February 2025 to January 2026, reveals key trends in the niche market of 112 active listings.
Whether you're considering an Airbnb investment in Balatonfüred, optimizing your existing vacation rental, or exploring rental arbitrage opportunities, understanding the Balatonfüred Airbnb data is crucial. Navigating the high regulation landscape is key to maximizing your short term rental income potential. Let's dive into the specifics.
Key Balatonfüred Airbnb Performance Metrics Overview
Monthly Airbnb Revenue Variations & Income Potential in Balatonfüred (2026)
Understanding the monthly revenue variations for Airbnb listings in Balatonfüred is key to maximizing your short term rental income potential. Seasonality significantly impacts earnings. Our analysis, based on data from the past 12 months, shows that the peak revenue month for STRs in Balatonfüred is typically August, while November often presents the lowest earnings, highlighting opportunities for strategic pricing adjustments during shoulder and low seasons. Explore the typical Airbnb income in Balatonfüred across different performance tiers:
- Best-in-class properties (Top 10%) achieve $2,332+ monthly, often utilizing dynamic pricing and superior guest experiences.
- Strong performing properties (Top 25%) earn $1,465 or more, indicating effective management and desirable locations/amenities.
- Typical properties (Median) generate around $879 per month, representing the average market performance.
- Entry-level properties (Bottom 25%) see earnings around $412, often with potential for optimization.
Average Monthly Airbnb Earnings Trend in Balatonfüred
Balatonfüred Airbnb Occupancy Rate Trends (2026)
Maximize your bookings by understanding the Balatonfüred STR occupancy trends. Seasonal demand shifts significantly influence how often properties are booked. Typically, Augustsees the highest demand (peak season occupancy), while November experiences the lowest (low season). Effective strategies, like adjusting minimum stays or offering promotions, can boost occupancy during slower periods. Here's how different property tiers perform in Balatonfüred:
- Best-in-class properties (Top 10%) achieve 62%+ occupancy, indicating high desirability and potentially optimized availability.
- Strong performing properties (Top 25%) maintain 45% or higher occupancy, suggesting good market fit and guest satisfaction.
- Typical properties (Median) have an occupancy rate around 26%.
- Entry-level properties (Bottom 25%) average 11% occupancy, potentially facing higher vacancy.
Average Monthly Occupancy Rate Trend in Balatonfüred
Average Daily Rate (ADR) Airbnb Trends in Balatonfüred (2026)
Effective short term rental pricing strategy in Balatonfüred involves understanding monthly ADR fluctuations. The Average Daily Rate (ADR) for Airbnb in Balatonfüred typically peaks in August and dips lowest during November. Leveraging Airbnb dynamic pricing tools or strategies based on this seasonality can significantly boost revenue. Here's a look at the typical nightly rates achieved:
- Best-in-class properties (Top 10%) command rates of $212+ per night, often due to premium features or locations.
- Strong performing properties (Top 25%) achieve nightly rates of $146 or more.
- Typical properties (Median) charge around $111 per night.
- Entry-level properties (Bottom 25%) earn around $86 per night.
Average Daily Rate (ADR) Trend by Month in Balatonfüred
Get Live Balatonfüred Market Intelligence 👇

Explore Real-time Analytics
Airbnb Seasonality Analysis & Trends in Balatonfüred (2026)
Peak Season (August, July, June)
- Revenue averages $1,962 per month
- Occupancy rates average 43.7%
- Daily rates average $152
Shoulder Season
- Revenue averages $989 per month
- Occupancy maintains around 28.0%
- Daily rates hold near $131
Low Season (March, April, November)
- Revenue drops to average $656 per month
- Occupancy decreases to average 23.1%
- Daily rates adjust to average $129
Seasonality Insights for Balatonfüred
- The Airbnb seasonality in Balatonfüred shows highly seasonal trends requiring careful strategy. While the sections above show seasonal averages, it's also insightful to look at the extremes:
- During the high season, the absolute peak month showcases Balatonfüred's highest earning potential, with monthly revenues capable of climbing to $2,494, occupancy reaching a high of 52.5%, and ADRs peaking at $156.
- Conversely, the slowest single month of the year, typically falling within the low season, marks the market's lowest point. In this month, revenue might dip to $533, occupancy could drop to 16.2%, and ADRs may adjust down to $127.
- Understanding both the seasonal averages and these monthly peaks and troughs in revenue, occupancy, and ADR is crucial for maximizing your Airbnb profit potential in Balatonfüred.
Seasonal Strategies for Maximizing Profit
- Peak Season: Maximize revenue through premium pricing and potentially longer minimum stays. Ensure high availability.
- Low Season: Offer competitive pricing, special promotions (e.g., extended stay discounts), and flexible cancellation policies. Target off-season travelers like remote workers or budget-conscious guests.
- Shoulder Seasons: Implement dynamic pricing that balances peak and low rates. Target weekend travelers or specific events. Offer slightly more flexible terms than peak season.
- Regularly analyze your own performance against these Balatonfüred seasonality benchmarks and adjust your pricing and availability strategy accordingly.
Best Areas for Airbnb Investment in Balatonfüred (2026)
Exploring the top neighborhoods for short-term rentals in Balatonfüred? This section highlights key areas, outlining why they are attractive for hosts and guests, along with notable local attractions. Consider these locations based on your target guest profile and investment strategy.
| Neighborhood / Area | Why Host Here? (Target Guests & Appeal) | Key Attractions & Landmarks |
|---|---|---|
| Balatonfüred City Center | The vibrant heart of Balatonfüred, filled with shops, cafes, and restaurants. Ideal for tourists looking to experience local cuisine, culture, and shopping, with easy access to Lake Balaton. | Confederation of the Hungarian Railways, Lake Balaton Promenade, Kossuth Lajos Promenade, The Jókai Mór Memorial House, Local wine cellars |
| Tagore Promenade | A beautiful waterfront area perfect for leisurely strolls, offering stunning views of Lake Balaton. Attracts families and couples looking for a scenic getaway. | Tagore Promenade, Beach access, Park with playgrounds, Restaurants and cafés along the water, Great sunset views |
| Esterházy Beach | A popular beach area that offers various water activities and family-friendly amenities. Ideal for families looking for a fun beach vacation. | Swimming areas, Beach bars, Water sports rentals, Children's playgrounds, Nearby cafes and shops |
| Kisfaludy Park | A peaceful park located near the waterfront, perfect for relaxing and enjoying nature. Suitable for travelers seeking tranquility and outdoor activities. | Walking paths, Picnic spots, Lake views, Cultural events, Playgrounds |
| Füred's Wine Region | Known for its vineyards and wine cellars, this area attracts wine enthusiasts and those wanting to experience local wine culture. | Vineyard tours, Wine tastings, Cultural festivals, Local gastronomy, Picturesque landscapes |
| Anna Grand Hotel Area | This luxurious hotel area attracts visitors looking for upscale accommodations and amenities close to the lake. | Spa and wellness centers, Fine dining options, Historical architecture, Cultural events, Proximity to the beach |
| Balatonfüred Marina | A hub for boating and water sports, this area is perfect for water enthusiasts and those looking for an active vacation. | Boat rentals, Marina restaurants, Sailing events, Water sports activities, Sunset views over the lake |
| Nearby Tihany Peninsula | Famous for its historical abbey and stunning landscapes, this area is a must-visit for tourists, providing a charming escape from the city. | Tihany Abbey, Viewpoints overlooking Lake Balaton, Tihany Lavender Fields, Biking and hiking paths, Local artisan shops |
Understanding Airbnb License Requirements & STR Laws in Balatonfüred (2026)
Yes, Balatonfüred, Transdanubia, Hungary enforces high STR regulations. Obtaining a license and ensuring compliance is almost certainly required according to current 2026 STR laws. Always verify the latest short term rental regulations and Airbnb license requirements directly with local government authorities for Balatonfüred to ensure full compliance before hosting.
(Source: AirROI data, 2026, based on 83% licensed listings)
Top Performing Airbnb Properties in Balatonfüred (2026)
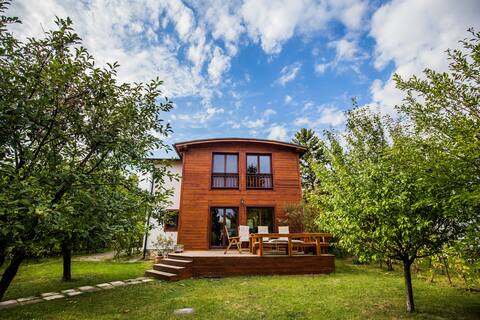
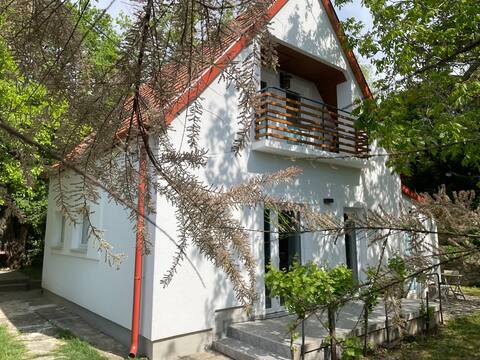
Benchmark your potential! Explore examples of top-performing Airbnb properties in Balatonfüredbased on Trailing Twelve Month (TTM) revenue. Analyze their characteristics, revenue, occupancy rate, and ADR to understand what drives success in this market.

Füred milieu, panorama, jacuzzi, sauna, happiness
Entire Place • 3 bedrooms
Botond habz
Entire Place • 3 bedrooms

Lila Füge Guesthouse with free parking
Entire Place • 7 bedrooms
Quiet, green, relaxing place_ 3 bedroom villa
Entire Place • 3 bedrooms

No name cottage in green, peace, freedom, quiet
Entire Place • 1 bedroom

Koloska House
Entire Place • 2 bedrooms
Note: Performance varies based on location, size, amenities, seasonality, and management quality. Data reflects the past 12 months.
Top Performing Airbnb Hosts in Balatonfüred (2026)
Learn from the best! This table showcases top-performing Airbnb hosts in Balatonfüred based on the number of properties managed and estimated total revenue over the past year. Analyze their scale and performance metrics.
| Host Name | Properties | Grossing Revenue | Stay Reviews | Avg Rating |
|---|---|---|---|---|
| Peter の Alicia | 4 | $62,396 | 157 | 4.99/5.0 |
| Mónika | 4 | $62,081 | 18 | 4.96/5.0 |
| Dávid | 1 | $53,923 | 216 | 4.90/5.0 |
| Botond | 2 | $52,944 | 22 | 5.00/5.0 |
| Ákos | 7 | $51,983 | 53 | 4.92/5.0 |
| Balint | 3 | $48,895 | 472 | 4.95/5.0 |
| Ármin | 5 | $40,137 | 25 | 4.58/5.0 |
| Gabriella | 3 | $35,603 | 35 | 4.94/5.0 |
| Károly | 4 | $27,527 | 16 | 4.59/5.0 |
| Renáta | 1 | $21,906 | 53 | 5.00/5.0 |
Analyzing the strategies of top hosts, such as their property selection, pricing, and guest communication, can offer valuable lessons for optimizing your own Airbnb operations in Balatonfüred.
Dive Deeper: Advanced Balatonfüred STR Market Data (2026)
Ready to unlock more insights? AirROI provides access to advanced metrics and comprehensive Airbnb data for Balatonfüred. Explore detailed analytics beyond this report to refine your investment strategy, optimize pricing, and maximize your vacation rental profits.
Explore Advanced MetricsBalatonfüred Short-Term Rental Market Composition (2026): Property & Room Types
Room Type Distribution
Property Type Distribution
Market Composition Insights for Balatonfüred
- The Balatonfüred Airbnb market composition is heavily skewed towards Entire Home/Apt listings, which make up 87.5% of the 112 active rentals. This indicates strong guest preference for privacy and space.
- Looking at the property type distribution in Balatonfüred, Apartment/Condo properties are the most common (48.2%), reflecting the local real estate landscape.
- Houses represent a significant 39.3% portion, catering likely to families or larger groups.
- The presence of 7.1% Hotel/Boutique listings indicates integration with traditional hospitality.
- Smaller segments like others, outdoor/unique (combined 5.4%) offer potential for unique stay experiences.
Balatonfüred Airbnb Room Capacity Analysis (2026): Bedroom Distribution
Distribution of Listings by Number of Bedrooms
Room Capacity Insights for Balatonfüred
- The dominant room capacity in Balatonfüred is 1 bedroom listings, making up 40.2% of the market. This suggests a strong demand for properties suitable for couples or solo travelers.
- Together, 1 bedroom and 2 bedrooms properties represent 71.5% of the active Airbnb listings in Balatonfüred, indicating a high concentration in these sizes.
Balatonfüred Vacation Rental Guest Capacity Trends (2026)
Distribution of Listings by Guest Capacity
Guest Capacity Insights for Balatonfüred
- The most common guest capacity trend in Balatonfüred vacation rentals is listings accommodating 4 guests (33.9%). This suggests the primary traveler segment is likely small families or groups.
- Properties designed for 4 guests and 6 guests dominate the Balatonfüred STR market, accounting for 47.3% of listings.
- 26.8% of properties accommodate 6+ guests, serving the market segment for larger families or group travel in Balatonfüred.
- On average, properties in Balatonfüred are equipped to host 4.2 guests.
Balatonfüred Airbnb Booking Patterns (2026): Available vs. Booked Days
Available Days Distribution
Booked Days Distribution
Booking Pattern Insights for Balatonfüred
- The most common availability pattern in Balatonfüred falls within the 271-366 days range, representing 80.4% of listings. This suggests many properties have significant open periods on their calendars.
- Approximately 96.5% of listings show high availability (181+ days open annually), indicating potential for increased bookings or specific owner usage patterns.
- For booked days, the 31-90 days range is most frequent in Balatonfüred (45.5%), reflecting common guest stay durations or potential owner blocking patterns.
- A notable 4.5% of properties secure long booking periods (181+ days booked per year), highlighting successful long-term rental strategies or significant owner usage.
Balatonfüred Airbnb Minimum Stay Requirements Analysis
Distribution of Listings by Minimum Night Requirement
1 Night
12 listings
10.7% of total
2 Nights
28 listings
25% of total
3 Nights
8 listings
7.1% of total
4-6 Nights
10 listings
8.9% of total
7-29 Nights
1 listings
0.9% of total
30+ Nights
53 listings
47.3% of total
Key Insights
- The most prevalent minimum stay requirement in Balatonfüred is 30+ Nights, adopted by 47.3% of listings. This highlights the market's preference for longer commitments.
- A significant segment (47.3%) caters to monthly stays (30+ nights) in Balatonfüred, pointing to opportunities in the extended-stay market.
Recommendations
- Align with the market by considering a 30+ Nights minimum stay, as 47.3% of Balatonfüred hosts use this setting.
- If feasible, allowing 1-night stays, especially midweek or during low season, could capture last-minute bookings, as only 10.7% currently do.
- Explore offering discounts for stays of 30+ nights to attract the 47.3% of the market seeking extended stays.
- Adjust minimum nights based on seasonality – potentially shorter during low season and longer during peak demand periods in Balatonfüred.
Balatonfüred Airbnb Cancellation Policy Trends Analysis (2026)
Flexible
21 listings
18.8% of total
Moderate
26 listings
23.2% of total
Firm
57 listings
50.9% of total
Strict
8 listings
7.1% of total
Cancellation Policy Insights for Balatonfüred
- The prevailing Airbnb cancellation policy trend in Balatonfüred is Firm, used by 50.9% of listings.
- A majority (58.0%) of hosts in Balatonfüred utilize Firm or Strict policies, indicating a market where hosts prioritize booking security.
- Strict cancellation policies are quite rare (7.1%), potentially making listings with this policy less competitive unless justified by high demand or property type.
Recommendations for Hosts
- Consider adopting a Firm policy to align with the 50.9% market standard in Balatonfüred.
- Using a Strict policy might deter some guests, as only 7.1% of listings use it. Evaluate if potential revenue protection outweighs possible lower booking rates.
- Regularly review your cancellation policy against competitors and market demand shifts in Balatonfüred.
Balatonfüred STR Booking Lead Time Analysis (2026)
Average Booking Lead Time by Month
Booking Lead Time Insights for Balatonfüred
- The overall average booking lead time for vacation rentals in Balatonfüred is 53 days.
- Guests book furthest in advance for stays during August (average 75 days), likely coinciding with peak travel demand or local events.
- The shortest booking windows occur for stays in December (average 30 days), indicating more last-minute travel plans during this time.
- Seasonally, Summer (62 days avg.) sees the longest lead times, while Winter (33 days avg.) has the shortest, reflecting typical travel planning cycles.
Recommendations for Hosts
- Use the overall average lead time (53 days) as a baseline for your pricing and availability strategy in Balatonfüred.
- For August stays, consider implementing length-of-stay discounts or slightly higher rates for bookings made less than 75 days out to capitalize on advance planning.
- Target marketing efforts for the Summer season well in advance (at least 62 days) to capture early planners.
- Monitor your own booking lead times against these Balatonfüred averages to identify opportunities for dynamic pricing adjustments.
Popular & Essential Airbnb Amenities in Balatonfüred (2026)
Amenity Prevalence
Amenity Insights for Balatonfüred
- Essential amenities in Balatonfüred that guests expect include: Wifi. Lacking these (this) could significantly impact bookings.
- Popular amenities like Free parking on premises, TV, Kitchen are common but not universal. Offering these can provide a competitive edge.
Recommendations for Hosts
- Ensure your listing includes all essential amenities for Balatonfüred: Wifi.
- Prioritize adding missing essentials: Wifi.
- Consider adding popular differentiators like Free parking on premises or TV to increase appeal.
- Highlight unique or less common amenities you offer (e.g., hot tub, dedicated workspace, EV charger) in your listing description and photos.
- Regularly check competitor amenities in Balatonfüred to stay competitive.
Balatonfüred Airbnb Guest Demographics & Profile Analysis (2026)
Guest Profile Summary for Balatonfüred
- The typical guest profile for Airbnb in Balatonfüred consists of predominantly international visitors (74%), with top international origins including Germany, typically belonging to the Post-2000s (Gen Z/Alpha) group (50%), primarily speaking English or Hungarian.
- Domestic travelers account for 25.6% of guests.
- Key international markets include Hungary (25.6%) and Germany (12.5%).
- Top languages spoken are English (40%) followed by Hungarian (13.6%).
- A significant demographic segment is the Post-2000s (Gen Z/Alpha) group, representing 50% of guests.
Recommendations for Hosts
- Focus marketing internationally, particularly towards travelers from Germany.
- Tailor amenities and listing descriptions to appeal to the dominant Post-2000s (Gen Z/Alpha) demographic (e.g., highlight fast WiFi, smart home features, local guides).
- Highlight unique local experiences or amenities relevant to the primary guest profile.
- Consider seasonal promotions aligned with peak travel times for key origin markets.
Nearby Short-Term Rental Market Comparison
How does the Balatonfüred Airbnb market stack up against its neighbors? Compare key performance metrics like average monthly revenue, ADR, and occupancy rates in surrounding areas to understand the broader regional STR landscape.
| Market | Active Properties | Monthly Revenue | Daily Rate | Avg. Occupancy |
|---|---|---|---|---|
| Balatonakarattya | 24 | $2,500 | $374.96 | 34% |
| Paloznak | 11 | $1,827 | $271.04 | 44% |
| Općina Gornji Kneginec | 10 | $1,799 | $378.91 | 32% |
| Neusiedl am See | 25 | $1,605 | $267.10 | 36% |
| Bad Waltersdorf | 15 | $1,598 | $174.77 | 35% |
| Balatonszepezd | 25 | $1,585 | $161.72 | 46% |
| Zebegény | 22 | $1,578 | $149.21 | 41% |
| Balatonakali | 18 | $1,553 | $201.67 | 28% |
| Nagymaros | 49 | $1,485 | $128.57 | 44% |
| Lendava / Lendva | 12 | $1,456 | $193.21 | 30% |