Santa Rosa de Copán Airbnb Market Analysis 2026: Short Term Rental Data & Vacation Rental Statistics in Copán, Honduras
Is Airbnb profitable in Santa Rosa de Copán in 2026? Explore comprehensive Airbnb analytics for Santa Rosa de Copán, Copán, Honduras to uncover income potential. This 2026 STR market report for Santa Rosa de Copán, based on AirROI data from February 2025 to January 2026, reveals key trends in the niche market of 59 active listings.
Whether you're considering an Airbnb investment in Santa Rosa de Copán, optimizing your existing vacation rental, or exploring rental arbitrage opportunities, understanding the Santa Rosa de Copán Airbnb data is crucial. Leveraging the low regulation environment is key to maximizing your short term rental income potential. Let's dive into the specifics.
Key Santa Rosa de Copán Airbnb Performance Metrics Overview
Monthly Airbnb Revenue Variations & Income Potential in Santa Rosa de Copán (2026)
Understanding the monthly revenue variations for Airbnb listings in Santa Rosa de Copán is key to maximizing your short term rental income potential. Seasonality significantly impacts earnings. Our analysis, based on data from the past 12 months, shows that the peak revenue month for STRs in Santa Rosa de Copán is typically July, while January often presents the lowest earnings, highlighting opportunities for strategic pricing adjustments during shoulder and low seasons. Explore the typical Airbnb income in Santa Rosa de Copán across different performance tiers:
- Best-in-class properties (Top 10%) achieve $910+ monthly, often utilizing dynamic pricing and superior guest experiences.
- Strong performing properties (Top 25%) earn $534 or more, indicating effective management and desirable locations/amenities.
- Typical properties (Median) generate around $283 per month, representing the average market performance.
- Entry-level properties (Bottom 25%) see earnings around $140, often with potential for optimization.
Average Monthly Airbnb Earnings Trend in Santa Rosa de Copán
Santa Rosa de Copán Airbnb Occupancy Rate Trends (2026)
Maximize your bookings by understanding the Santa Rosa de Copán STR occupancy trends. Seasonal demand shifts significantly influence how often properties are booked. Typically, Decembersees the highest demand (peak season occupancy), while January experiences the lowest (low season). Effective strategies, like adjusting minimum stays or offering promotions, can boost occupancy during slower periods. Here's how different property tiers perform in Santa Rosa de Copán:
- Best-in-class properties (Top 10%) achieve 55%+ occupancy, indicating high desirability and potentially optimized availability.
- Strong performing properties (Top 25%) maintain 34% or higher occupancy, suggesting good market fit and guest satisfaction.
- Typical properties (Median) have an occupancy rate around 18%.
- Entry-level properties (Bottom 25%) average 9% occupancy, potentially facing higher vacancy.
Average Monthly Occupancy Rate Trend in Santa Rosa de Copán
Average Daily Rate (ADR) Airbnb Trends in Santa Rosa de Copán (2026)
Effective short term rental pricing strategy in Santa Rosa de Copán involves understanding monthly ADR fluctuations. The Average Daily Rate (ADR) for Airbnb in Santa Rosa de Copán typically peaks in September and dips lowest during January. Leveraging Airbnb dynamic pricing tools or strategies based on this seasonality can significantly boost revenue. Here's a look at the typical nightly rates achieved:
- Best-in-class properties (Top 10%) command rates of $88+ per night, often due to premium features or locations.
- Strong performing properties (Top 25%) achieve nightly rates of $69 or more.
- Typical properties (Median) charge around $47 per night.
- Entry-level properties (Bottom 25%) earn around $33 per night.
Average Daily Rate (ADR) Trend by Month in Santa Rosa de Copán
Get Live Santa Rosa de Copán Market Intelligence 👇
Explore Real-time Analytics
Airbnb Seasonality Analysis & Trends in Santa Rosa de Copán (2026)
Peak Season (July, December, August)
- Revenue averages $488 per month
- Occupancy rates average 31.5%
- Daily rates average $53
Shoulder Season
- Revenue averages $409 per month
- Occupancy maintains around 24.5%
- Daily rates hold near $54
Low Season (January, June, November)
- Revenue drops to average $281 per month
- Occupancy decreases to average 19.0%
- Daily rates adjust to average $52
Seasonality Insights for Santa Rosa de Copán
- The Airbnb seasonality in Santa Rosa de Copán shows highly seasonal trends requiring careful strategy. While the sections above show seasonal averages, it's also insightful to look at the extremes:
- During the high season, the absolute peak month showcases Santa Rosa de Copán's highest earning potential, with monthly revenues capable of climbing to $532, occupancy reaching a high of 36.1%, and ADRs peaking at $55.
- Conversely, the slowest single month of the year, typically falling within the low season, marks the market's lowest point. In this month, revenue might dip to $255, occupancy could drop to 17.4%, and ADRs may adjust down to $50.
- Understanding both the seasonal averages and these monthly peaks and troughs in revenue, occupancy, and ADR is crucial for maximizing your Airbnb profit potential in Santa Rosa de Copán.
Seasonal Strategies for Maximizing Profit
- Peak Season: Maximize revenue through premium pricing and potentially longer minimum stays. Ensure high availability.
- Low Season: Offer competitive pricing, special promotions (e.g., extended stay discounts), and flexible cancellation policies. Target off-season travelers like remote workers or budget-conscious guests.
- Shoulder Seasons: Implement dynamic pricing that balances peak and low rates. Target weekend travelers or specific events. Offer slightly more flexible terms than peak season.
- Regularly analyze your own performance against these Santa Rosa de Copán seasonality benchmarks and adjust your pricing and availability strategy accordingly.
Best Areas for Airbnb Investment in Santa Rosa de Copán (2026)
Exploring the top neighborhoods for short-term rentals in Santa Rosa de Copán? This section highlights key areas, outlining why they are attractive for hosts and guests, along with notable local attractions. Consider these locations based on your target guest profile and investment strategy.
| Neighborhood / Area | Why Host Here? (Target Guests & Appeal) | Key Attractions & Landmarks |
|---|---|---|
| Centro Histórico | Historical center with colonial architecture, vibrant local markets, and cultural heritage. Attractive for tourists wanting to explore the rich history and tradition of Santa Rosa de Copán. | Santa Rosa de Copán Cathedral, Archaeological Park of Copán, Local Markets, Copán Ruinas, Café and Restaurants in the Square |
| Parque Central | The main park in the city, perfect for leisurely walks, socializing, and enjoying local events. A focal point for both locals and visitors. | Central Park, Café Sol, Cultural Events, Weekly Markets |
| Las Ruinas de Copán | A UNESCO World Heritage site known for its stunning Mayan ruins and archaeological significance, drawing visitors interested in history and culture. | Copán Ruins, Mayan Sculptures, Visitor Center, Nature Trails |
| La Fuente | A quiet area known for its beautiful fountain and surrounding gardens. Ideal for families and those looking for a peaceful stay. | La Fuente Park, Tranquil Gardens, Local Cafés |
| El Calvario | Known for its hilltop church offering panoramic views of the city, attracting visitors seeking a mix of culture and scenic beauty. | El Calvario Church, Scenic Views, Hiking Trails |
| Zona Rosa | The nightlife district of Santa Rosa with bars and restaurants. Suitable for young travelers looking for a lively atmosphere. | Local Bars, Nightclubs, Restaurants |
| Dolores | A residential area close to the city center, appealing for those wanting a more local experience with easy access to amenities. | Local Shops, Community Parks, Cafés |
| Brisas de La Selva | A nature-oriented area with lush landscapes and eco-friendly accommodations, attracting nature lovers and those seeking tranquility. | Nature Trails, Birdwatching, Eco-lodges |
Understanding Airbnb License Requirements & STR Laws in Santa Rosa de Copán (2026)
While Santa Rosa de Copán, Copán, Honduras currently shows low STR regulations, specific Airbnb license requirements might still exist or change. Always verify the latest short term rental regulations and Airbnb license requirements directly with local government authorities for Santa Rosa de Copán to ensure full compliance before hosting.
(Source: AirROI data, 2026, based on 2% licensed listings)
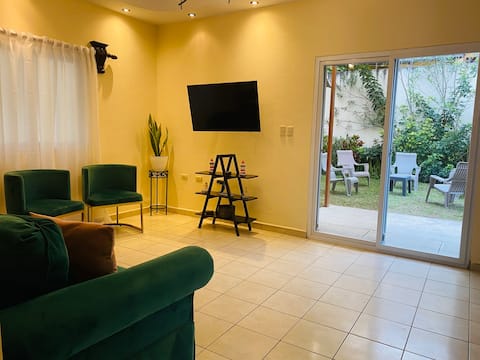
Top Performing Airbnb Properties in Santa Rosa de Copán (2026)
Benchmark your potential! Explore examples of top-performing Airbnb properties in Santa Rosa de Copánbased on Trailing Twelve Month (TTM) revenue. Analyze their characteristics, revenue, occupancy rate, and ADR to understand what drives success in this market.
El Mirador 2A
Entire Place • 2 bedrooms
Apartamento Ideal for 5
Entire Place • 3 bedrooms
Gabriel Centenario Apartment
Entire Place • 2 bedrooms
Casa serena II
Entire Place • 4 bedrooms

La Góndola Apartment.
Entire Place • 2 bedrooms
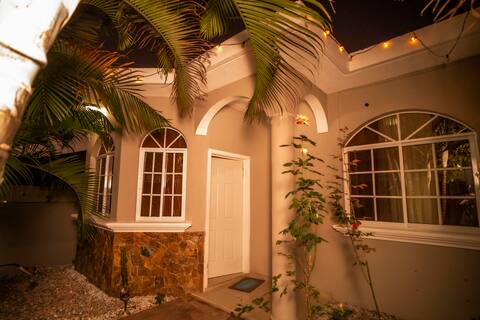
Complete and Warm House in Santa Rosa de Copán
Entire Place • 3 bedrooms
Note: Performance varies based on location, size, amenities, seasonality, and management quality. Data reflects the past 12 months.
Top Performing Airbnb Hosts in Santa Rosa de Copán (2026)
Learn from the best! This table showcases top-performing Airbnb hosts in Santa Rosa de Copán based on the number of properties managed and estimated total revenue over the past year. Analyze their scale and performance metrics.
| Host Name | Properties | Grossing Revenue | Stay Reviews | Avg Rating |
|---|---|---|---|---|
| Silvia | 5 | $24,589 | 298 | 4.84/5.0 |
| Hector Y Jhoany | 11 | $13,923 | 404 | 4.63/5.0 |
| Samary | 4 | $11,795 | 107 | 4.79/5.0 |
| Estela | 2 | $10,801 | 110 | 4.91/5.0 |
| Maria Jose | 2 | $9,594 | 57 | 4.91/5.0 |
| Liana | 1 | $8,024 | 90 | 4.89/5.0 |
| Marco Antonio | 1 | $6,919 | 40 | 4.98/5.0 |
| Mirna | 2 | $6,646 | 178 | 4.87/5.0 |
| Hilary Dayana | 2 | $6,070 | 23 | 4.75/5.0 |
| Sergio | 1 | $5,891 | 11 | 5.00/5.0 |
Analyzing the strategies of top hosts, such as their property selection, pricing, and guest communication, can offer valuable lessons for optimizing your own Airbnb operations in Santa Rosa de Copán.
Dive Deeper: Advanced Santa Rosa de Copán STR Market Data (2026)
Ready to unlock more insights? AirROI provides access to advanced metrics and comprehensive Airbnb data for Santa Rosa de Copán. Explore detailed analytics beyond this report to refine your investment strategy, optimize pricing, and maximize your vacation rental profits.
Explore Advanced MetricsSanta Rosa de Copán Short-Term Rental Market Composition (2026): Property & Room Types
Room Type Distribution
Property Type Distribution
Market Composition Insights for Santa Rosa de Copán
- The Santa Rosa de Copán Airbnb market composition is heavily skewed towards Entire Home/Apt listings, which make up 72.9% of the 59 active rentals. This indicates strong guest preference for privacy and space.
- Looking at the property type distribution in Santa Rosa de Copán, Apartment/Condo properties are the most common (59.3%), reflecting the local real estate landscape.
- Houses represent a significant 25.4% portion, catering likely to families or larger groups.
- The presence of 10.2% Hotel/Boutique listings indicates integration with traditional hospitality.
- Smaller segments like unique stays, outdoor/unique (combined 5.1%) offer potential for unique stay experiences.
Santa Rosa de Copán Airbnb Room Capacity Analysis (2026): Bedroom Distribution
Distribution of Listings by Number of Bedrooms
Room Capacity Insights for Santa Rosa de Copán
- The dominant room capacity in Santa Rosa de Copán is 1 bedroom listings, making up 40.7% of the market. This suggests a strong demand for properties suitable for couples or solo travelers.
- Together, 1 bedroom and 2 bedrooms properties represent 69.5% of the active Airbnb listings in Santa Rosa de Copán, indicating a high concentration in these sizes.
- A significant 22.0% of listings offer 3+ bedrooms, catering to larger groups and families seeking more space in Santa Rosa de Copán.
Santa Rosa de Copán Vacation Rental Guest Capacity Trends (2026)
Distribution of Listings by Guest Capacity
Guest Capacity Insights for Santa Rosa de Copán
- The most common guest capacity trend in Santa Rosa de Copán vacation rentals is listings accommodating 2 guests (22%). This suggests the primary traveler segment is likely couples or solo travelers.
- Properties designed for 2 guests and 4 guests dominate the Santa Rosa de Copán STR market, accounting for 44.0% of listings.
- 28.9% of properties accommodate 6+ guests, serving the market segment for larger families or group travel in Santa Rosa de Copán.
- On average, properties in Santa Rosa de Copán are equipped to host 3.9 guests.
Santa Rosa de Copán Airbnb Booking Patterns (2026): Available vs. Booked Days
Available Days Distribution
Booked Days Distribution
Booking Pattern Insights for Santa Rosa de Copán
- The most common availability pattern in Santa Rosa de Copán falls within the 271-366 days range, representing 86.4% of listings. This suggests many properties have significant open periods on their calendars.
- Approximately 100.0% of listings show high availability (181+ days open annually), indicating potential for increased bookings or specific owner usage patterns.
- For booked days, the 1-30 days range is most frequent in Santa Rosa de Copán (44.1%), reflecting common guest stay durations or potential owner blocking patterns.
Santa Rosa de Copán Airbnb Minimum Stay Requirements Analysis
Distribution of Listings by Minimum Night Requirement
1 Night
52 listings
88.1% of total
2 Nights
5 listings
8.5% of total
30+ Nights
2 listings
3.4% of total
Key Insights
- The most prevalent minimum stay requirement in Santa Rosa de Copán is 1 Night, adopted by 88.1% of listings. This highlights the market's preference for shorter, flexible bookings.
- A strong majority (96.6%) of the Santa Rosa de Copán Airbnb data shows acceptance of very short stays (1-2 nights), indicating a dynamic, high-turnover market.
Recommendations
- Align with the market by considering a 1 Night minimum stay, as 88.1% of Santa Rosa de Copán hosts use this setting.
- Adjust minimum nights based on seasonality – potentially shorter during low season and longer during peak demand periods in Santa Rosa de Copán.
Santa Rosa de Copán Airbnb Cancellation Policy Trends Analysis (2026)
Flexible
38 listings
64.4% of total
Moderate
17 listings
28.8% of total
Firm
2 listings
3.4% of total
Strict
2 listings
3.4% of total
Cancellation Policy Insights for Santa Rosa de Copán
- The prevailing Airbnb cancellation policy trend in Santa Rosa de Copán is Flexible, used by 64.4% of listings.
- The market strongly favors guest-friendly terms, with 93.2% of listings offering Flexible or Moderate policies. This suggests guests in Santa Rosa de Copán may expect booking flexibility.
- Strict cancellation policies are quite rare (3.4%), potentially making listings with this policy less competitive unless justified by high demand or property type.
Recommendations for Hosts
- Consider adopting a Flexible policy to align with the 64.4% market standard in Santa Rosa de Copán.
- Given the high prevalence of Flexible policies (64.4%), offering this can enhance booking appeal, especially during shoulder seasons.
- Using a Strict policy might deter some guests, as only 3.4% of listings use it. Evaluate if potential revenue protection outweighs possible lower booking rates.
- Regularly review your cancellation policy against competitors and market demand shifts in Santa Rosa de Copán.
Santa Rosa de Copán STR Booking Lead Time Analysis (2026)
Average Booking Lead Time by Month
Booking Lead Time Insights for Santa Rosa de Copán
- The overall average booking lead time for vacation rentals in Santa Rosa de Copán is 9 days.
- Guests book furthest in advance for stays during March (average 11 days), likely coinciding with peak travel demand or local events.
- The shortest booking windows occur for stays in February (average 5 days), indicating more last-minute travel plans during this time.
- Seasonally, Summer (9 days avg.) sees the longest lead times, while Winter (6 days avg.) has the shortest, reflecting typical travel planning cycles.
Recommendations for Hosts
- Use the overall average lead time (9 days) as a baseline for your pricing and availability strategy in Santa Rosa de Copán.
- Target marketing efforts for the Summer season well in advance (at least 9 days) to capture early planners.
- Monitor your own booking lead times against these Santa Rosa de Copán averages to identify opportunities for dynamic pricing adjustments.
Popular & Essential Airbnb Amenities in Santa Rosa de Copán (2026)
Amenity Prevalence
Amenity Insights for Santa Rosa de Copán
- Essential amenities in Santa Rosa de Copán that guests expect include: TV, Wifi. Lacking these (any) could significantly impact bookings.
- Popular amenities like Air conditioning, Dishes and silverware, Kitchen are common but not universal. Offering these can provide a competitive edge.
Recommendations for Hosts
- Ensure your listing includes all essential amenities for Santa Rosa de Copán: TV, Wifi.
- Prioritize adding missing essentials: Wifi.
- Consider adding popular differentiators like Air conditioning or Dishes and silverware to increase appeal.
- Highlight unique or less common amenities you offer (e.g., hot tub, dedicated workspace, EV charger) in your listing description and photos.
- Regularly check competitor amenities in Santa Rosa de Copán to stay competitive.
Santa Rosa de Copán Airbnb Guest Demographics & Profile Analysis (2026)
Guest Profile Summary for Santa Rosa de Copán
- The typical guest profile for Airbnb in Santa Rosa de Copán consists of primarily domestic travelers (80%), often arriving from nearby San Pedro Sula, typically belonging to the Post-2000s (Gen Z/Alpha) group (50%), primarily speaking Spanish or English.
- Domestic travelers account for 80.0% of guests.
- Key international markets include Honduras (80%) and United States (9%).
- Top languages spoken are Spanish (54.7%) followed by English (35%).
- A significant demographic segment is the Post-2000s (Gen Z/Alpha) group, representing 50% of guests.
Recommendations for Hosts
- Target domestic marketing efforts towards travelers from San Pedro Sula and Tegucigalpa.
- Tailor amenities and listing descriptions to appeal to the dominant Post-2000s (Gen Z/Alpha) demographic (e.g., highlight fast WiFi, smart home features, local guides).
- Highlight unique local experiences or amenities relevant to the primary guest profile.
- Consider seasonal promotions aligned with peak travel times for key origin markets.
Nearby Short-Term Rental Market Comparison
How does the Santa Rosa de Copán Airbnb market stack up against its neighbors? Compare key performance metrics like average monthly revenue, ADR, and occupancy rates in surrounding areas to understand the broader regional STR landscape.
| Market | Active Properties | Monthly Revenue | Daily Rate | Avg. Occupancy |
|---|---|---|---|---|
| Municipio de Jicalapa | 11 | $3,708 | $371.37 | 27% |
| Municipio de El Congo | 40 | $3,371 | $325.78 | 37% |
| Municipio de San Luis La Herradura | 177 | $2,768 | $296.73 | 34% |
| Municipio de Santa Isabel Ishuatán | 16 | $2,694 | $241.08 | 34% |
| Municipio de Intipucá | 10 | $2,647 | $292.41 | 32% |
| Xanadu | 136 | $2,505 | $229.47 | 38% |
| Teotepeque | 12 | $2,463 | $233.38 | 36% |
| Aldea de San Juan | 27 | $2,404 | $364.33 | 26% |
| Municipio de San Luis Talpa | 31 | $2,400 | $257.96 | 32% |
| Cantón Planes de la Laguna | 11 | $2,364 | $287.05 | 36% |