Utila Airbnb Market Analysis 2026: Short Term Rental Data & Vacation Rental Statistics in Bay Islands, Honduras
Is Airbnb profitable in Utila in 2026? Explore comprehensive Airbnb analytics for Utila, Bay Islands, Honduras to uncover income potential. This 2026 STR market report for Utila, based on AirROI data from February 2025 to January 2026, reveals key trends in the niche market of 198 active listings.
Whether you're considering an Airbnb investment in Utila, optimizing your existing vacation rental, or exploring rental arbitrage opportunities, understanding the Utila Airbnb data is crucial. Leveraging the low regulation environment is key to maximizing your short term rental income potential. Let's dive into the specifics.
Key Utila Airbnb Performance Metrics Overview
Monthly Airbnb Revenue Variations & Income Potential in Utila (2026)
Understanding the monthly revenue variations for Airbnb listings in Utila is key to maximizing your short term rental income potential. Seasonality significantly impacts earnings. Our analysis, based on data from the past 12 months, shows that the peak revenue month for STRs in Utila is typically March, while June often presents the lowest earnings, highlighting opportunities for strategic pricing adjustments during shoulder and low seasons. Explore the typical Airbnb income in Utila across different performance tiers:
- Best-in-class properties (Top 10%) achieve $2,740+ monthly, often utilizing dynamic pricing and superior guest experiences.
- Strong performing properties (Top 25%) earn $1,654 or more, indicating effective management and desirable locations/amenities.
- Typical properties (Median) generate around $841 per month, representing the average market performance.
- Entry-level properties (Bottom 25%) see earnings around $346, often with potential for optimization.
Average Monthly Airbnb Earnings Trend in Utila
Utila Airbnb Occupancy Rate Trends (2026)
Maximize your bookings by understanding the Utila STR occupancy trends. Seasonal demand shifts significantly influence how often properties are booked. Typically, Marchsees the highest demand (peak season occupancy), while September experiences the lowest (low season). Effective strategies, like adjusting minimum stays or offering promotions, can boost occupancy during slower periods. Here's how different property tiers perform in Utila:
- Best-in-class properties (Top 10%) achieve 68%+ occupancy, indicating high desirability and potentially optimized availability.
- Strong performing properties (Top 25%) maintain 46% or higher occupancy, suggesting good market fit and guest satisfaction.
- Typical properties (Median) have an occupancy rate around 25%.
- Entry-level properties (Bottom 25%) average 13% occupancy, potentially facing higher vacancy.
Average Monthly Occupancy Rate Trend in Utila
Average Daily Rate (ADR) Airbnb Trends in Utila (2026)
Effective short term rental pricing strategy in Utila involves understanding monthly ADR fluctuations. The Average Daily Rate (ADR) for Airbnb in Utila typically peaks in October and dips lowest during March. Leveraging Airbnb dynamic pricing tools or strategies based on this seasonality can significantly boost revenue. Here's a look at the typical nightly rates achieved:
- Best-in-class properties (Top 10%) command rates of $272+ per night, often due to premium features or locations.
- Strong performing properties (Top 25%) achieve nightly rates of $160 or more.
- Typical properties (Median) charge around $103 per night.
- Entry-level properties (Bottom 25%) earn around $69 per night.
Average Daily Rate (ADR) Trend by Month in Utila
Get Live Utila Market Intelligence 👇

Explore Real-time Analytics
Airbnb Seasonality Analysis & Trends in Utila (2026)
Peak Season (March, February, April)
- Revenue averages $1,586 per month
- Occupancy rates average 41.1%
- Daily rates average $131
Shoulder Season
- Revenue averages $1,206 per month
- Occupancy maintains around 29.1%
- Daily rates hold near $135
Low Season (January, May, June)
- Revenue drops to average $1,100 per month
- Occupancy decreases to average 28.4%
- Daily rates adjust to average $134
Seasonality Insights for Utila
- The Airbnb seasonality in Utila shows moderate seasonality with distinct peak and low periods. While the sections above show seasonal averages, it's also insightful to look at the extremes:
- During the high season, the absolute peak month showcases Utila's highest earning potential, with monthly revenues capable of climbing to $1,654, occupancy reaching a high of 42.2%, and ADRs peaking at $138.
- Conversely, the slowest single month of the year, typically falling within the low season, marks the market's lowest point. In this month, revenue might dip to $1,078, occupancy could drop to 26.5%, and ADRs may adjust down to $130.
- Understanding both the seasonal averages and these monthly peaks and troughs in revenue, occupancy, and ADR is crucial for maximizing your Airbnb profit potential in Utila.
Seasonal Strategies for Maximizing Profit
- Peak Season: Maximize revenue through premium pricing and potentially longer minimum stays. Ensure high availability.
- Low Season: Offer competitive pricing, special promotions (e.g., extended stay discounts), and flexible cancellation policies. Target off-season travelers like remote workers or budget-conscious guests.
- Shoulder Seasons: Implement dynamic pricing that balances peak and low rates. Target weekend travelers or specific events. Offer slightly more flexible terms than peak season.
- Regularly analyze your own performance against these Utila seasonality benchmarks and adjust your pricing and availability strategy accordingly.
Best Areas for Airbnb Investment in Utila (2026)
Exploring the top neighborhoods for short-term rentals in Utila? This section highlights key areas, outlining why they are attractive for hosts and guests, along with notable local attractions. Consider these locations based on your target guest profile and investment strategy.
| Neighborhood / Area | Why Host Here? (Target Guests & Appeal) | Key Attractions & Landmarks |
|---|---|---|
| West End | The most popular tourist area in Utila, known for its vibrant nightlife, dining, and diving opportunities. Perfect for travelers looking for a lively atmosphere and easy access to the beach. | Utila Cays, Bando Beach, Dive shops, Bars and restaurants, Pigeon Cay |
| East End | A quieter, more laid-back area that offers beautiful beaches and snorkeling spots. Ideal for travelers seeking relaxation and natural beauty away from the busy West End. | Chepes Beach, Snorkeling spots, Laguna Beach, Local restaurants, Nature trails |
| Utila Town | The main settlement on the island with a mix of local culture, shops, and services. Great for those looking for convenience and a taste of everyday life on Utila. | Utila Public Market, Local shops, Restaurants, Bars, Utila's harbor |
| Airstrip Area | Close to the airport and offers easy access to various diving schools and accommodations. A prime location for those arriving by air and want to dive into activities quickly. | Utila Airstrip, Diving schools, Convenient access to beaches, Local eateries |
| Guanaja | An upcoming area that is part of the Bay Islands, known for its stunning nature and tranquility. Perfect for eco-tourism and those looking to escape the crowds. | Coral reefs, Hiking trails, Local wildlife, Guanaja’s beaches |
| North Side Beaches | Less crowded than the West End, the North Side offers pristine beaches and great snorkeling opportunities. Ideal for families and couples looking for a quiet getaway. | Turtle Beach, Turtle Harbor, Snorkeling sites, Secluded spots |
| Laguna de Utila | A beautiful lagoon area that is lesser-known but offers fantastic nature walks and birdwatching. Perfect for nature lovers and those wanting a unique experience on the island. | Birdwatching, Kayaking, Nature trails, Local flora and fauna |
| Little Cayes | A remote area with very few tourists, ideal for private getaways and experiencing untouched nature. Great for those looking for peace and solitude. | Untouched beaches, Snorkeling spots, Local wildlife, Private accommodations |
Understanding Airbnb License Requirements & STR Laws in Utila (2026)
While Utila, Bay Islands, Honduras currently shows low STR regulations, specific Airbnb license requirements might still exist or change. Always verify the latest short term rental regulations and Airbnb license requirements directly with local government authorities for Utila to ensure full compliance before hosting.
(Source: AirROI data, 2026, based on 1% licensed listings)
Top Performing Airbnb Properties in Utila (2026)
Benchmark your potential! Explore examples of top-performing Airbnb properties in Utilabased on Trailing Twelve Month (TTM) revenue. Analyze their characteristics, revenue, occupancy rate, and ADR to understand what drives success in this market.
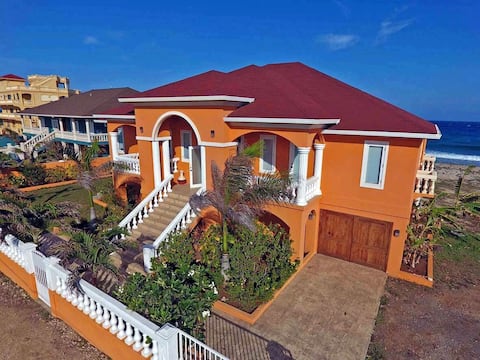
Casa Naranja - Upscale Living with a Private Pool
Entire Place • 4 bedrooms

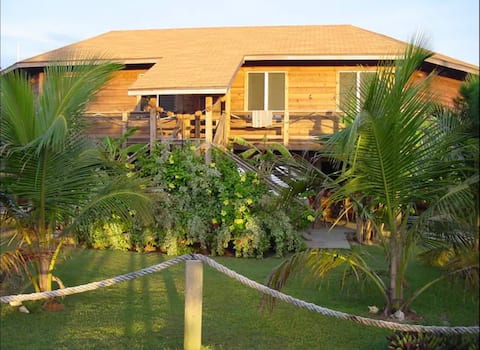
Cay House, Jewel of the Utila Bay
Entire Place • 5 bedrooms

IndianHead 2 Acre - Oceanfront : 2BR 2BA
Entire Place • 2 bedrooms

Beach House w/4BR 2BA - Amazing location!
Entire Place • 4 bedrooms

Two bedrooms and one bath.
Entire Place • 2 bedrooms
Sandy Bay Beach House
Entire Place • 3 bedrooms
Note: Performance varies based on location, size, amenities, seasonality, and management quality. Data reflects the past 12 months.
Top Performing Airbnb Hosts in Utila (2026)
Learn from the best! This table showcases top-performing Airbnb hosts in Utila based on the number of properties managed and estimated total revenue over the past year. Analyze their scale and performance metrics.
| Host Name | Properties | Grossing Revenue | Stay Reviews | Avg Rating |
|---|---|---|---|---|
| Tony & Jo | 18 | $274,210 | 211 | 4.93/5.0 |
| Jakob & Ana | 7 | $166,774 | 770 | 4.77/5.0 |
| Tamara | 6 | $128,263 | 569 | 4.91/5.0 |
| John | 2 | $89,830 | 167 | 4.89/5.0 |
| Charles | 5 | $77,250 | 50 | 4.72/5.0 |
| Tina | 3 | $66,667 | 11 | 4.93/5.0 |
| Dockside | 5 | $65,072 | 145 | 4.53/5.0 |
| Sergio Daniel | 6 | $64,297 | 37 | 4.98/5.0 |
| Andrea | 6 | $62,636 | 251 | 4.65/5.0 |
| Roland | 3 | $50,313 | 290 | 4.92/5.0 |
Analyzing the strategies of top hosts, such as their property selection, pricing, and guest communication, can offer valuable lessons for optimizing your own Airbnb operations in Utila.
Dive Deeper: Advanced Utila STR Market Data (2026)
Ready to unlock more insights? AirROI provides access to advanced metrics and comprehensive Airbnb data for Utila. Explore detailed analytics beyond this report to refine your investment strategy, optimize pricing, and maximize your vacation rental profits.
Explore Advanced MetricsUtila Short-Term Rental Market Composition (2026): Property & Room Types
Room Type Distribution
Property Type Distribution
Market Composition Insights for Utila
- The Utila Airbnb market composition is heavily skewed towards Entire Home/Apt listings, which make up 74.2% of the 198 active rentals. This indicates strong guest preference for privacy and space.
- Looking at the property type distribution in Utila, Apartment/Condo properties are the most common (35.9%), reflecting the local real estate landscape.
- Houses represent a significant 33.3% portion, catering likely to families or larger groups.
- The presence of 18.7% Hotel/Boutique listings indicates integration with traditional hospitality.
- Smaller segments like unique stays, others (combined 5.0%) offer potential for unique stay experiences.
Utila Airbnb Room Capacity Analysis (2026): Bedroom Distribution
Distribution of Listings by Number of Bedrooms
Room Capacity Insights for Utila
- The dominant room capacity in Utila is 1 bedroom listings, making up 51.5% of the market. This suggests a strong demand for properties suitable for couples or solo travelers.
- Together, 1 bedroom and 2 bedrooms properties represent 75.2% of the active Airbnb listings in Utila, indicating a high concentration in these sizes.
- With over half the market (51.5%) consisting of studios or 1-bedroom units, Utila is particularly well-suited for individuals or couples.
Utila Vacation Rental Guest Capacity Trends (2026)
Distribution of Listings by Guest Capacity
Guest Capacity Insights for Utila
- The most common guest capacity trend in Utila vacation rentals is listings accommodating 2 guests (34.8%). This suggests the primary traveler segment is likely couples or solo travelers.
- Properties designed for 2 guests and 4 guests dominate the Utila STR market, accounting for 64.6% of listings.
- 23.2% of properties accommodate 6+ guests, serving the market segment for larger families or group travel in Utila.
- On average, properties in Utila are equipped to host 3.7 guests.
Utila Airbnb Booking Patterns (2026): Available vs. Booked Days
Available Days Distribution
Booked Days Distribution
Booking Pattern Insights for Utila
- The most common availability pattern in Utila falls within the 271-366 days range, representing 69.2% of listings. This suggests many properties have significant open periods on their calendars.
- Approximately 89.4% of listings show high availability (181+ days open annually), indicating potential for increased bookings or specific owner usage patterns.
- For booked days, the 31-90 days range is most frequent in Utila (35.4%), reflecting common guest stay durations or potential owner blocking patterns.
- A notable 10.6% of properties secure long booking periods (181+ days booked per year), highlighting successful long-term rental strategies or significant owner usage.
Utila Airbnb Minimum Stay Requirements Analysis
Distribution of Listings by Minimum Night Requirement
1 Night
71 listings
36% of total
2 Nights
57 listings
28.9% of total
3 Nights
27 listings
13.7% of total
4-6 Nights
15 listings
7.6% of total
30+ Nights
27 listings
13.7% of total
Key Insights
- The most prevalent minimum stay requirement in Utila is 1 Night, adopted by 36% of listings. This highlights the market's preference for shorter, flexible bookings.
- A strong majority (64.9%) of the Utila Airbnb data shows acceptance of very short stays (1-2 nights), indicating a dynamic, high-turnover market.
- A significant segment (13.7%) caters to monthly stays (30+ nights) in Utila, pointing to opportunities in the extended-stay market.
Recommendations
- Align with the market by considering a 1 Night minimum stay, as 36% of Utila hosts use this setting.
- Explore offering discounts for stays of 30+ nights to attract the 13.7% of the market seeking extended stays.
- Adjust minimum nights based on seasonality – potentially shorter during low season and longer during peak demand periods in Utila.
Utila Airbnb Cancellation Policy Trends Analysis (2026)
Flexible
41 listings
20.7% of total
Moderate
38 listings
19.2% of total
Firm
90 listings
45.5% of total
Strict
29 listings
14.6% of total
Cancellation Policy Insights for Utila
- The prevailing Airbnb cancellation policy trend in Utila is Firm, used by 45.5% of listings.
- A majority (60.1%) of hosts in Utila utilize Firm or Strict policies, indicating a market where hosts prioritize booking security.
Recommendations for Hosts
- Consider adopting a Firm policy to align with the 45.5% market standard in Utila.
- Using a Strict policy might deter some guests, as only 14.6% of listings use it. Evaluate if potential revenue protection outweighs possible lower booking rates.
- Regularly review your cancellation policy against competitors and market demand shifts in Utila.
Utila STR Booking Lead Time Analysis (2026)
Average Booking Lead Time by Month
Booking Lead Time Insights for Utila
- The overall average booking lead time for vacation rentals in Utila is 37 days.
- Guests book furthest in advance for stays during April (average 44 days), likely coinciding with peak travel demand or local events.
- The shortest booking windows occur for stays in August (average 26 days), indicating more last-minute travel plans during this time.
- Seasonally, Winter (41 days avg.) sees the longest lead times, while Summer (29 days avg.) has the shortest, reflecting typical travel planning cycles.
Recommendations for Hosts
- Use the overall average lead time (37 days) as a baseline for your pricing and availability strategy in Utila.
- Target marketing efforts for the Winter season well in advance (at least 41 days) to capture early planners.
- Monitor your own booking lead times against these Utila averages to identify opportunities for dynamic pricing adjustments.
Popular & Essential Airbnb Amenities in Utila (2026)
Amenity Prevalence
Amenity Insights for Utila
- Essential amenities in Utila that guests expect include: Wifi. Lacking these (this) could significantly impact bookings.
- Popular amenities like Air conditioning, Essentials, Hot water are common but not universal. Offering these can provide a competitive edge.
Recommendations for Hosts
- Ensure your listing includes all essential amenities for Utila: Wifi.
- Prioritize adding missing essentials: Wifi.
- Consider adding popular differentiators like Air conditioning or Essentials to increase appeal.
- Highlight unique or less common amenities you offer (e.g., hot tub, dedicated workspace, EV charger) in your listing description and photos.
- Regularly check competitor amenities in Utila to stay competitive.
Utila Airbnb Guest Demographics & Profile Analysis (2026)
Guest Profile Summary for Utila
- The typical guest profile for Airbnb in Utila consists of predominantly international visitors (72%), with top international origins including Honduras, typically belonging to the Post-2000s (Gen Z/Alpha) group (50%), primarily speaking English or Spanish.
- Domestic travelers account for 28.2% of guests.
- Key international markets include United States (43.1%) and Honduras (28.2%).
- Top languages spoken are English (45.2%) followed by Spanish (35.3%).
- A significant demographic segment is the Post-2000s (Gen Z/Alpha) group, representing 50% of guests.
Recommendations for Hosts
- Focus marketing internationally, particularly towards travelers from Honduras.
- Tailor amenities and listing descriptions to appeal to the dominant Post-2000s (Gen Z/Alpha) demographic (e.g., highlight fast WiFi, smart home features, local guides).
- Highlight unique local experiences or amenities relevant to the primary guest profile.
- Consider seasonal promotions aligned with peak travel times for key origin markets.
Nearby Short-Term Rental Market Comparison
How does the Utila Airbnb market stack up against its neighbors? Compare key performance metrics like average monthly revenue, ADR, and occupancy rates in surrounding areas to understand the broader regional STR landscape.
| Market | Active Properties | Monthly Revenue | Daily Rate | Avg. Occupancy |
|---|---|---|---|---|
| San Pedro Town | 667 | $2,922 | $324.04 | 37% |
| San Pedro | 44 | $2,911 | $402.68 | 33% |
| Aldea de San Juan | 27 | $2,404 | $364.33 | 26% |
| San Pedro | 94 | $2,209 | $282.54 | 36% |
| West Bay | 42 | $2,130 | $374.23 | 31% |
| Roatán | 799 | $1,554 | $230.07 | 33% |
| Tornabe | 26 | $1,489 | $271.28 | 21% |
| Triunfo de la Cruz | 22 | $1,426 | $277.04 | 21% |
| José Santos Guardiola | 51 | $1,279 | $212.01 | 30% |
| Up Cay | 12 | $1,254 | $204.77 | 33% |