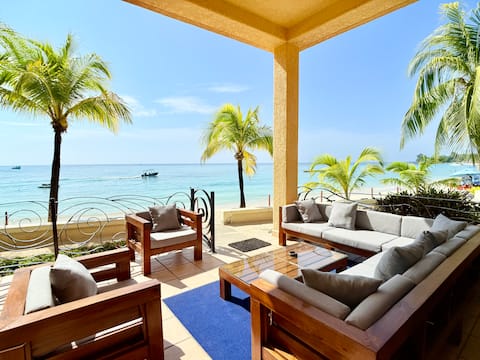
Roatán Airbnb Market Analysis 2026: Short Term Rental Data & Vacation Rental Statistics in Bay Islands, Honduras
Is Airbnb profitable in Roatán in 2026? Explore comprehensive Airbnb analytics for Roatán, Bay Islands, Honduras to uncover income potential. This 2026 STR market report for Roatán, based on AirROI data from February 2025 to January 2026, reveals key trends in the market of 799 active listings.
Whether you're considering an Airbnb investment in Roatán, optimizing your existing vacation rental, or exploring rental arbitrage opportunities, understanding the Roatán Airbnb data is crucial. Leveraging the low regulation environment is key to maximizing your short term rental income potential. Let's dive into the specifics.
Key Roatán Airbnb Performance Metrics Overview
Monthly Airbnb Revenue Variations & Income Potential in Roatán (2026)
Understanding the monthly revenue variations for Airbnb listings in Roatán is key to maximizing your short term rental income potential. Seasonality significantly impacts earnings. Our analysis, based on data from the past 12 months, shows that the peak revenue month for STRs in Roatán is typically March, while November often presents the lowest earnings, highlighting opportunities for strategic pricing adjustments during shoulder and low seasons. Explore the typical Airbnb income in Roatán across different performance tiers:
- Best-in-class properties (Top 10%) achieve $6,086+ monthly, often utilizing dynamic pricing and superior guest experiences.
- Strong performing properties (Top 25%) earn $3,170 or more, indicating effective management and desirable locations/amenities.
- Typical properties (Median) generate around $1,473 per month, representing the average market performance.
- Entry-level properties (Bottom 25%) see earnings around $640, often with potential for optimization.
Average Monthly Airbnb Earnings Trend in Roatán
Roatán Airbnb Occupancy Rate Trends (2026)
Maximize your bookings by understanding the Roatán STR occupancy trends. Seasonal demand shifts significantly influence how often properties are booked. Typically, Februarysees the highest demand (peak season occupancy), while November experiences the lowest (low season). Effective strategies, like adjusting minimum stays or offering promotions, can boost occupancy during slower periods. Here's how different property tiers perform in Roatán:
- Best-in-class properties (Top 10%) achieve 69%+ occupancy, indicating high desirability and potentially optimized availability.
- Strong performing properties (Top 25%) maintain 50% or higher occupancy, suggesting good market fit and guest satisfaction.
- Typical properties (Median) have an occupancy rate around 30%.
- Entry-level properties (Bottom 25%) average 14% occupancy, potentially facing higher vacancy.
Average Monthly Occupancy Rate Trend in Roatán
Average Daily Rate (ADR) Airbnb Trends in Roatán (2026)
Effective short term rental pricing strategy in Roatán involves understanding monthly ADR fluctuations. The Average Daily Rate (ADR) for Airbnb in Roatán typically peaks in February and dips lowest during November. Leveraging Airbnb dynamic pricing tools or strategies based on this seasonality can significantly boost revenue. Here's a look at the typical nightly rates achieved:
- Best-in-class properties (Top 10%) command rates of $483+ per night, often due to premium features or locations.
- Strong performing properties (Top 25%) achieve nightly rates of $273 or more.
- Typical properties (Median) charge around $152 per night.
- Entry-level properties (Bottom 25%) earn around $95 per night.
Average Daily Rate (ADR) Trend by Month in Roatán
Get Live Roatán Market Intelligence 👇

Explore Real-time Analytics
Airbnb Seasonality Analysis & Trends in Roatán (2026)
Peak Season (March, February, July)
- Revenue averages $3,462 per month
- Occupancy rates average 46.1%
- Daily rates average $232
Shoulder Season
- Revenue averages $2,418 per month
- Occupancy maintains around 31.9%
- Daily rates hold near $228
Low Season (September, October, November)
- Revenue drops to average $1,773 per month
- Occupancy decreases to average 26.0%
- Daily rates adjust to average $212
Seasonality Insights for Roatán
- The Airbnb seasonality in Roatán shows highly seasonal trends requiring careful strategy. While the sections above show seasonal averages, it's also insightful to look at the extremes:
- During the high season, the absolute peak month showcases Roatán's highest earning potential, with monthly revenues capable of climbing to $3,750, occupancy reaching a high of 53.0%, and ADRs peaking at $236.
- Conversely, the slowest single month of the year, typically falling within the low season, marks the market's lowest point. In this month, revenue might dip to $1,636, occupancy could drop to 23.8%, and ADRs may adjust down to $210.
- Understanding both the seasonal averages and these monthly peaks and troughs in revenue, occupancy, and ADR is crucial for maximizing your Airbnb profit potential in Roatán.
Seasonal Strategies for Maximizing Profit
- Peak Season: Maximize revenue through premium pricing and potentially longer minimum stays. Ensure high availability.
- Low Season: Offer competitive pricing, special promotions (e.g., extended stay discounts), and flexible cancellation policies. Target off-season travelers like remote workers or budget-conscious guests.
- Shoulder Seasons: Implement dynamic pricing that balances peak and low rates. Target weekend travelers or specific events. Offer slightly more flexible terms than peak season.
- Regularly analyze your own performance against these Roatán seasonality benchmarks and adjust your pricing and availability strategy accordingly.
Best Areas for Airbnb Investment in Roatán (2026)
Exploring the top neighborhoods for short-term rentals in Roatán? This section highlights key areas, outlining why they are attractive for hosts and guests, along with notable local attractions. Consider these locations based on your target guest profile and investment strategy.
| Neighborhood / Area | Why Host Here? (Target Guests & Appeal) | Key Attractions & Landmarks |
|---|---|---|
| West Bay | Famous for its stunning white sandy beaches, crystal-clear waters, and vibrant coral reefs. A top destination for tourists looking for relaxation and water activities. | West Bay Beach, Little French Key, Snorkeling and diving sites, Zipline adventures, Restaurants and bars along the beach |
| Roatan Village | A charming local community that offers a more authentic experience of island life. Visitors can enjoy local culture, cuisine, and nearby natural attractions. | Local markets, Cultural festivals, Nature walks, Restaurants serving traditional Honduran food, Close proximity to the coast |
| French Harbour | Known for its marina and fishing opportunities, this area is popular with boaters and those looking for a laid-back vibe. Great for water sports and fresh seafood. | Fantasy Island Beach, Roatan Marine Park, Fishing tours, Restaurants overlooking the marina, Cultural visits |
| Utila | Although it's technically a neighboring island, Utila is popular for its whale shark sightings and diving. A great option for adventurous tourists. | Utila's coral reefs, Whale shark dive tours, Local bars and nightlife, Beachfront accommodations, Scuba diving schools |
| Oak Ridge | A more secluded area offering a glimpse into traditional Caribbean life with mangroves, waterfront dining, and a quieter atmosphere compared to busier tourist spots. | Mangrove tours, Local eateries, Seafood markets, Snorkeling nearby, Picturesque views |
| Sandy Bay | A quieter area ideal for families and those wanting a peaceful escape with easy access to attractions and the beach. Known for its local vibe. | Carambola Gardens, Marine biology programs, Dining with a view, Beach access, Proximity to West End |
| West End | A lively area known for its vibrant nightlife, restaurants, and dive shops. Popular with younger travelers looking for fun and adventure. | West End Beach, Diving and snorkeling tours, Restaurants and bars, Local shops, Nightlife scene |
| Pigeon Cay | A small and beautiful island perfect for those wanting a remote getaway. Ideal for nature lovers and those seeking relaxation away from the typical tourist crowds. | Pristine beaches, Snorkeling spots, Affordable beach accommodations, Nature walks, Secluded atmosphere |
Understanding Airbnb License Requirements & STR Laws in Roatán (2026)
While Roatán, Bay Islands, Honduras currently shows low STR regulations, specific Airbnb license requirements might still exist or change. Always verify the latest short term rental regulations and Airbnb license requirements directly with local government authorities for Roatán to ensure full compliance before hosting.
(Source: AirROI data, 2026, based on 0% licensed listings)
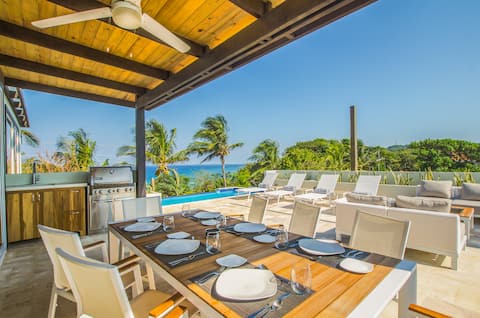
Top Performing Airbnb Properties in Roatán (2026)
Benchmark your potential! Explore examples of top-performing Airbnb properties in Roatánbased on Trailing Twelve Month (TTM) revenue. Analyze their characteristics, revenue, occupancy rate, and ADR to understand what drives success in this market.
Coral Sand By The Beach - Condo#8 @ West Bay Beach
Entire Place • 3 bedrooms
Coral Sand 10, Condos 1 & 5 @ West Bay Beach
Entire Place • 5 bedrooms

This is La Vida.. Luxury Beachfront Villa, Roatan
Entire Place • 5 bedrooms

Eagle Ray
Entire Place • 3 bedrooms
Villa Topaz - Sunrise & Sunset - Private Pool
Entire Place • 4 bedrooms
The Dock:Over Water Retreat. NEW LOW PRICE !
Entire Place • 9 bedrooms
Note: Performance varies based on location, size, amenities, seasonality, and management quality. Data reflects the past 12 months.
Top Performing Airbnb Hosts in Roatán (2026)
Learn from the best! This table showcases top-performing Airbnb hosts in Roatán based on the number of properties managed and estimated total revenue over the past year. Analyze their scale and performance metrics.
| Host Name | Properties | Grossing Revenue | Stay Reviews | Avg Rating |
|---|---|---|---|---|
| Islaya Vacation Rentals | 34 | $1,080,815 | 519 | 4.74/5.0 |
| Roatan Vacation Rentals | 34 | $740,926 | 109 | 4.83/5.0 |
| Roatan Property Management | 24 | $577,377 | 364 | 4.72/5.0 |
| Paul | 11 | $338,442 | 511 | 4.96/5.0 |
| Island House | 17 | $331,611 | 129 | 4.70/5.0 |
| Luna | 9 | $322,381 | 56 | 4.86/5.0 |
| Shelby And Sean | 6 | $290,862 | 234 | 4.95/5.0 |
| Guy | 12 | $259,472 | 1175 | 4.95/5.0 |
| Caroline | 16 | $258,217 | 344 | 4.81/5.0 |
| Chantalle | 3 | $249,347 | 74 | 5.00/5.0 |
Analyzing the strategies of top hosts, such as their property selection, pricing, and guest communication, can offer valuable lessons for optimizing your own Airbnb operations in Roatán.
Dive Deeper: Advanced Roatán STR Market Data (2026)
Ready to unlock more insights? AirROI provides access to advanced metrics and comprehensive Airbnb data for Roatán. Explore detailed analytics beyond this report to refine your investment strategy, optimize pricing, and maximize your vacation rental profits.
Explore Advanced MetricsRoatán Short-Term Rental Market Composition (2026): Property & Room Types
Room Type Distribution
Property Type Distribution
Market Composition Insights for Roatán
- The Roatán Airbnb market composition is heavily skewed towards Entire Home/Apt listings, which make up 79.5% of the 799 active rentals. This indicates strong guest preference for privacy and space.
- Looking at the property type distribution in Roatán, House properties are the most common (43.9%), reflecting the local real estate landscape.
- Houses represent a significant 43.9% portion, catering likely to families or larger groups.
- The presence of 16.8% Hotel/Boutique listings indicates integration with traditional hospitality.
- Smaller segments like outdoor/unique, others, unique stays (combined 6.4%) offer potential for unique stay experiences.
Roatán Airbnb Room Capacity Analysis (2026): Bedroom Distribution
Distribution of Listings by Number of Bedrooms
Room Capacity Insights for Roatán
- The dominant room capacity in Roatán is 1 bedroom listings, making up 33.9% of the market. This suggests a strong demand for properties suitable for couples or solo travelers.
- Together, 1 bedroom and 2 bedrooms properties represent 64.4% of the active Airbnb listings in Roatán, indicating a high concentration in these sizes.
- A significant 26.5% of listings offer 3+ bedrooms, catering to larger groups and families seeking more space in Roatán.
Roatán Vacation Rental Guest Capacity Trends (2026)
Distribution of Listings by Guest Capacity
Guest Capacity Insights for Roatán
- The most common guest capacity trend in Roatán vacation rentals is listings accommodating 2 guests (23.4%). This suggests the primary traveler segment is likely couples or solo travelers.
- Properties designed for 2 guests and 4 guests dominate the Roatán STR market, accounting for 46.7% of listings.
- 35.0% of properties accommodate 6+ guests, serving the market segment for larger families or group travel in Roatán.
- On average, properties in Roatán are equipped to host 4.3 guests.
Roatán Airbnb Booking Patterns (2026): Available vs. Booked Days
Available Days Distribution
Booked Days Distribution
Booking Pattern Insights for Roatán
- The most common availability pattern in Roatán falls within the 271-366 days range, representing 66.5% of listings. This suggests many properties have significant open periods on their calendars.
- Approximately 91.5% of listings show high availability (181+ days open annually), indicating potential for increased bookings or specific owner usage patterns.
- For booked days, the 31-90 days range is most frequent in Roatán (38.3%), reflecting common guest stay durations or potential owner blocking patterns.
- A notable 8.9% of properties secure long booking periods (181+ days booked per year), highlighting successful long-term rental strategies or significant owner usage.
Roatán Airbnb Minimum Stay Requirements Analysis
Distribution of Listings by Minimum Night Requirement
1 Night
199 listings
24.9% of total
2 Nights
123 listings
15.4% of total
3 Nights
134 listings
16.8% of total
4-6 Nights
119 listings
14.9% of total
7-29 Nights
17 listings
2.1% of total
30+ Nights
207 listings
25.9% of total
Key Insights
- The most prevalent minimum stay requirement in Roatán is 30+ Nights, adopted by 25.9% of listings. This highlights the market's preference for longer commitments.
- A significant segment (25.9%) caters to monthly stays (30+ nights) in Roatán, pointing to opportunities in the extended-stay market.
Recommendations
- Align with the market by considering a 30+ Nights minimum stay, as 25.9% of Roatán hosts use this setting.
- If feasible, allowing 1-night stays, especially midweek or during low season, could capture last-minute bookings, as only 24.9% currently do.
- Explore offering discounts for stays of 30+ nights to attract the 25.9% of the market seeking extended stays.
- Adjust minimum nights based on seasonality – potentially shorter during low season and longer during peak demand periods in Roatán.
Roatán Airbnb Cancellation Policy Trends Analysis (2026)
Super Strict 30 Days
54 listings
6.8% of total
Super Strict 60 Days
75 listings
9.4% of total
Limited
14 listings
1.8% of total
Flexible
121 listings
15.2% of total
Moderate
118 listings
14.8% of total
Firm
324 listings
40.7% of total
Strict
90 listings
11.3% of total
Cancellation Policy Insights for Roatán
- The prevailing Airbnb cancellation policy trend in Roatán is Firm, used by 40.7% of listings.
- A majority (52.0%) of hosts in Roatán utilize Firm or Strict policies, indicating a market where hosts prioritize booking security.
Recommendations for Hosts
- Consider adopting a Firm policy to align with the 40.7% market standard in Roatán.
- Using a Strict policy might deter some guests, as only 11.3% of listings use it. Evaluate if potential revenue protection outweighs possible lower booking rates.
- Regularly review your cancellation policy against competitors and market demand shifts in Roatán.
Roatán STR Booking Lead Time Analysis (2026)
Average Booking Lead Time by Month
Booking Lead Time Insights for Roatán
- The overall average booking lead time for vacation rentals in Roatán is 70 days.
- Guests book furthest in advance for stays during February (average 105 days), likely coinciding with peak travel demand or local events.
- The shortest booking windows occur for stays in September (average 48 days), indicating more last-minute travel plans during this time.
- Seasonally, Winter (100 days avg.) sees the longest lead times, while Fall (53 days avg.) has the shortest, reflecting typical travel planning cycles.
Recommendations for Hosts
- Use the overall average lead time (70 days) as a baseline for your pricing and availability strategy in Roatán.
- For February stays, consider implementing length-of-stay discounts or slightly higher rates for bookings made less than 105 days out to capitalize on advance planning.
- Target marketing efforts for the Winter season well in advance (at least 100 days) to capture early planners.
- Monitor your own booking lead times against these Roatán averages to identify opportunities for dynamic pricing adjustments.
Popular & Essential Airbnb Amenities in Roatán (2026)
Amenity Prevalence
Amenity Insights for Roatán
- Essential amenities in Roatán that guests expect include: Wifi. Lacking these (this) could significantly impact bookings.
- Popular amenities like Air conditioning, TV, Free parking on premises are common but not universal. Offering these can provide a competitive edge.
Recommendations for Hosts
- Ensure your listing includes all essential amenities for Roatán: Wifi.
- Prioritize adding missing essentials: Wifi.
- Consider adding popular differentiators like Air conditioning or TV to increase appeal.
- Highlight unique or less common amenities you offer (e.g., hot tub, dedicated workspace, EV charger) in your listing description and photos.
- Regularly check competitor amenities in Roatán to stay competitive.
Roatán Airbnb Guest Demographics & Profile Analysis (2026)
Guest Profile Summary for Roatán
- The typical guest profile for Airbnb in Roatán consists of predominantly international visitors (91%), with top international origins including Canada, typically belonging to the Post-2000s (Gen Z/Alpha) group (50%), primarily speaking English or Spanish.
- Domestic travelers account for 8.9% of guests.
- Key international markets include United States (67.2%) and Canada (11.8%).
- Top languages spoken are English (53.7%) followed by Spanish (28.6%).
- A significant demographic segment is the Post-2000s (Gen Z/Alpha) group, representing 50% of guests.
Recommendations for Hosts
- Focus marketing internationally, particularly towards travelers from Canada.
- Tailor amenities and listing descriptions to appeal to the dominant Post-2000s (Gen Z/Alpha) demographic (e.g., highlight fast WiFi, smart home features, local guides).
- Highlight unique local experiences or amenities relevant to the primary guest profile.
- Consider seasonal promotions aligned with peak travel times for key origin markets.
Nearby Short-Term Rental Market Comparison
How does the Roatán Airbnb market stack up against its neighbors? Compare key performance metrics like average monthly revenue, ADR, and occupancy rates in surrounding areas to understand the broader regional STR landscape.
| Market | Active Properties | Monthly Revenue | Daily Rate | Avg. Occupancy |
|---|---|---|---|---|
| San Pedro Town | 667 | $2,922 | $324.04 | 37% |
| San Pedro | 44 | $2,911 | $402.68 | 33% |
| Aldea de San Juan | 27 | $2,404 | $364.33 | 26% |
| San Pedro | 94 | $2,209 | $282.54 | 36% |
| West Bay | 42 | $2,130 | $374.23 | 31% |
| Tornabe | 26 | $1,489 | $271.28 | 21% |
| Triunfo de la Cruz | 22 | $1,426 | $277.04 | 21% |
| José Santos Guardiola | 51 | $1,279 | $212.01 | 30% |
| Up Cay | 12 | $1,254 | $204.77 | 33% |
| Oak Ridge | 23 | $1,093 | $174.24 | 31% |