Egmont Airbnb Market Analysis 2026: Short Term Rental Data & Vacation Rental Statistics in Saint George, Grenada
Is Airbnb profitable in Egmont in 2026? Explore comprehensive Airbnb analytics for Egmont, Saint George, Grenada to uncover income potential. This 2026 STR market report for Egmont, based on AirROI data from February 2025 to January 2026, reveals key trends in the niche market of 24 active listings.
Whether you're considering an Airbnb investment in Egmont, optimizing your existing vacation rental, or exploring rental arbitrage opportunities, understanding the Egmont Airbnb data is crucial. Leveraging the low regulation environment is key to maximizing your short term rental income potential. Let's dive into the specifics.
Key Egmont Airbnb Performance Metrics Overview
Monthly Airbnb Revenue Variations & Income Potential in Egmont (2026)
Understanding the monthly revenue variations for Airbnb listings in Egmont is key to maximizing your short term rental income potential. Seasonality significantly impacts earnings. Our analysis, based on data from the past 12 months, shows that the peak revenue month for STRs in Egmont is typically November, while June often presents the lowest earnings, highlighting opportunities for strategic pricing adjustments during shoulder and low seasons. Explore the typical Airbnb income in Egmont across different performance tiers:
- Best-in-class properties (Top 10%) achieve $12,187+ monthly, often utilizing dynamic pricing and superior guest experiences.
- Strong performing properties (Top 25%) earn $5,309 or more, indicating effective management and desirable locations/amenities.
- Typical properties (Median) generate around $1,997 per month, representing the average market performance.
- Entry-level properties (Bottom 25%) see earnings around $928, often with potential for optimization.
Average Monthly Airbnb Earnings Trend in Egmont
Egmont Airbnb Occupancy Rate Trends (2026)
Maximize your bookings by understanding the Egmont STR occupancy trends. Seasonal demand shifts significantly influence how often properties are booked. Typically, Februarysees the highest demand (peak season occupancy), while June experiences the lowest (low season). Effective strategies, like adjusting minimum stays or offering promotions, can boost occupancy during slower periods. Here's how different property tiers perform in Egmont:
- Best-in-class properties (Top 10%) achieve 83%+ occupancy, indicating high desirability and potentially optimized availability.
- Strong performing properties (Top 25%) maintain 63% or higher occupancy, suggesting good market fit and guest satisfaction.
- Typical properties (Median) have an occupancy rate around 37%.
- Entry-level properties (Bottom 25%) average 21% occupancy, potentially facing higher vacancy.
Average Monthly Occupancy Rate Trend in Egmont
Average Daily Rate (ADR) Airbnb Trends in Egmont (2026)
Effective short term rental pricing strategy in Egmont involves understanding monthly ADR fluctuations. The Average Daily Rate (ADR) for Airbnb in Egmont typically peaks in August and dips lowest during September. Leveraging Airbnb dynamic pricing tools or strategies based on this seasonality can significantly boost revenue. Here's a look at the typical nightly rates achieved:
- Best-in-class properties (Top 10%) command rates of $590+ per night, often due to premium features or locations.
- Strong performing properties (Top 25%) achieve nightly rates of $309 or more.
- Typical properties (Median) charge around $203 per night.
- Entry-level properties (Bottom 25%) earn around $90 per night.
Average Daily Rate (ADR) Trend by Month in Egmont
Get Live Egmont Market Intelligence 👇
Explore Real-time Analytics
Airbnb Seasonality Analysis & Trends in Egmont (2026)
Peak Season (November, October, April)
- Revenue averages $5,520 per month
- Occupancy rates average 52.3%
- Daily rates average $255
Shoulder Season
- Revenue averages $4,222 per month
- Occupancy maintains around 49.0%
- Daily rates hold near $258
Low Season (January, June, December)
- Revenue drops to average $2,062 per month
- Occupancy decreases to average 27.5%
- Daily rates adjust to average $259
Seasonality Insights for Egmont
- The Airbnb seasonality in Egmont shows highly seasonal trends requiring careful strategy. While the sections above show seasonal averages, it's also insightful to look at the extremes:
- During the high season, the absolute peak month showcases Egmont's highest earning potential, with monthly revenues capable of climbing to $5,715, occupancy reaching a high of 64.3%, and ADRs peaking at $275.
- Conversely, the slowest single month of the year, typically falling within the low season, marks the market's lowest point. In this month, revenue might dip to $1,838, occupancy could drop to 18.1%, and ADRs may adjust down to $249.
- Understanding both the seasonal averages and these monthly peaks and troughs in revenue, occupancy, and ADR is crucial for maximizing your Airbnb profit potential in Egmont.
Seasonal Strategies for Maximizing Profit
- Peak Season: Maximize revenue through premium pricing and potentially longer minimum stays. Ensure high availability.
- Low Season: Offer competitive pricing, special promotions (e.g., extended stay discounts), and flexible cancellation policies. Target off-season travelers like remote workers or budget-conscious guests.
- Shoulder Seasons: Implement dynamic pricing that balances peak and low rates. Target weekend travelers or specific events. Offer slightly more flexible terms than peak season.
- Regularly analyze your own performance against these Egmont seasonality benchmarks and adjust your pricing and availability strategy accordingly.
Best Areas for Airbnb Investment in Egmont (2026)
Exploring the top neighborhoods for short-term rentals in Egmont? This section highlights key areas, outlining why they are attractive for hosts and guests, along with notable local attractions. Consider these locations based on your target guest profile and investment strategy.
| Neighborhood / Area | Why Host Here? (Target Guests & Appeal) | Key Attractions & Landmarks |
|---|---|---|
| Grand Anse Beach | One of the most famous beaches in Grenada, known for its beautiful stretch of white sand, calm waters, and vibrant atmosphere. It is a preferred choice for tourists looking for beach relaxation and water sports. | Grand Anse Beach, Spiceland Mall, Aquanauts Dive Center, Grenada Golf Club, Grenada Marine |
| St. George's | The capital city of Grenada, known for its historic architecture, bustling markets, and picturesque harbor. It's a prime location for tourists who want to explore the cultural side of Grenada. | Fort George, St. George's Market, National Museum, Carenage, Morne Rouge Beach |
| Lances Bay | A tranquil beach environment perfect for those seeking a quieter stay. Lances Bay offers stunning views and is near local seafood restaurants, making it popular among visitors looking for relaxation. | Lances Bay Beach, Fishing Village, Local seafood shacks, Scuba diving sites |
| Sauteurs | A quaint fishing village in the north of the island, known for its authentic Grenadian culture and stunning coastal views. Ideal for guests looking for a more local experience. | Sauteurs Bay, Fort Judd, Crab Island, Local markets, Beaches |
| Grenville | The second-largest town in Grenada, known for its local markets and access to beautiful hikes and waterfalls. A great option for visitors who want to experience the local lifestyle. | Grenville Market, La Sagesse Beach, Beautiful hiking trails, Local eateries, Waterfalls |
| Carriacou | A small island close to Grenada known for its natural beauty and rich marine life. It's perfect for tourists looking for island hopping and a laid-back atmosphere. | Carriacou Beaches, Snorkeling spots, Local boat rides, Festival of the Wind, Coconut beach |
| Morne Rouge | A serene beach area known for its calm waters and luxury accommodations. Great for tourists looking for a picturesque beach getaway with upscale options. | Morne Rouge Beach, La Sagesse, Local resorts, Marine activities, Sunset views |
| Victoria | A charming village with deep historical roots and proximity to nature trails. It offers a unique connection to Grenadian heritage and nature. | Victoria Falls, Local heritage sites, Fishing community, Historical trails, Friendly locals |
Understanding Airbnb License Requirements & STR Laws in Egmont (2026)
While Egmont, Saint George, Grenada currently shows low STR regulations, specific Airbnb license requirements might still exist or change. Always verify the latest short term rental regulations and Airbnb license requirements directly with local government authorities for Egmont to ensure full compliance before hosting.
(Source: AirROI data, 2026, finding no licensed listings among those analyzed)
Top Performing Airbnb Properties in Egmont (2026)
Benchmark your potential! Explore examples of top-performing Airbnb properties in Egmontbased on Trailing Twelve Month (TTM) revenue. Analyze their characteristics, revenue, occupancy rate, and ADR to understand what drives success in this market.

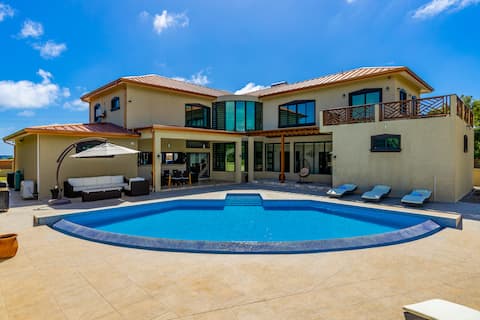
Aura Villa - Egmont, Grenada
Entire Place • 3 bedrooms

3-BR Luxury Group Villa w/ Pool– Grenada
Entire Place • 3 bedrooms
Villa Belle
Entire Place • 4 bedrooms

1-BR Villa w/ Private Pool, St. George's
Entire Place • 1 bedroom

Perfect Family /Friends Reunion Retreat 5 Bedrooms
Entire Place • 5 bedrooms

Cocal cottage, 3 bedroom villa with private beach
Entire Place • 3 bedrooms
Note: Performance varies based on location, size, amenities, seasonality, and management quality. Data reflects the past 12 months.
Top Performing Airbnb Hosts in Egmont (2026)
Learn from the best! This table showcases top-performing Airbnb hosts in Egmont based on the number of properties managed and estimated total revenue over the past year. Analyze their scale and performance metrics.
| Host Name | Properties | Grossing Revenue | Stay Reviews | Avg Rating |
|---|---|---|---|---|
| Afia | 3 | $149,909 | 50 | 4.61/5.0 |
| Hugh | 1 | $118,078 | 19 | 5.00/5.0 |
| Tawfiq | 1 | $64,304 | 12 | 4.92/5.0 |
| Cornelious | 5 | $62,156 | 125 | 4.54/5.0 |
| Christine Rae | 5 | $26,435 | 8 | 5.00/5.0 |
| Robert | 2 | $18,459 | 23 | 5.00/5.0 |
| George | 1 | $16,137 | 3 | 5.00/5.0 |
| Stephen | 1 | $13,975 | 2 | Not Rated |
| Lisa | 1 | $6,489 | 21 | 4.90/5.0 |
| Geraldine & Carsten | 1 | $5,871 | 133 | 4.90/5.0 |
Analyzing the strategies of top hosts, such as their property selection, pricing, and guest communication, can offer valuable lessons for optimizing your own Airbnb operations in Egmont.
Dive Deeper: Advanced Egmont STR Market Data (2026)
Ready to unlock more insights? AirROI provides access to advanced metrics and comprehensive Airbnb data for Egmont. Explore detailed analytics beyond this report to refine your investment strategy, optimize pricing, and maximize your vacation rental profits.
Explore Advanced MetricsEgmont Short-Term Rental Market Composition (2026): Property & Room Types
Room Type Distribution
Property Type Distribution
Market Composition Insights for Egmont
- The Egmont Airbnb market composition is heavily skewed towards Entire Home/Apt listings, which make up 91.7% of the 24 active rentals. This indicates strong guest preference for privacy and space.
- Looking at the property type distribution in Egmont, House properties are the most common (54.2%), reflecting the local real estate landscape.
- Houses represent a significant 54.2% portion, catering likely to families or larger groups.
- Smaller segments like others (combined 4.2%) offer potential for unique stay experiences.
Egmont Airbnb Room Capacity Analysis (2026): Bedroom Distribution
Distribution of Listings by Number of Bedrooms
Room Capacity Insights for Egmont
- The dominant room capacity in Egmont is 1 bedroom listings, making up 45.8% of the market. This suggests a strong demand for properties suitable for couples or solo travelers.
- Together, 1 bedroom and 2 bedrooms properties represent 66.6% of the active Airbnb listings in Egmont, indicating a high concentration in these sizes.
- A significant 25.1% of listings offer 3+ bedrooms, catering to larger groups and families seeking more space in Egmont.
Egmont Vacation Rental Guest Capacity Trends (2026)
Distribution of Listings by Guest Capacity
Guest Capacity Insights for Egmont
- The most common guest capacity trend in Egmont vacation rentals is listings accommodating 2 guests (54.2%). This suggests the primary traveler segment is likely couples or solo travelers.
- Properties designed for 2 guests and 4 guests dominate the Egmont STR market, accounting for 70.9% of listings.
- A significant 54.2% of listings cater specifically to 1-2 guests, highlighting strong demand from couples and solo travelers in Egmont.
- 25.0% of properties accommodate 6+ guests, serving the market segment for larger families or group travel in Egmont.
- On average, properties in Egmont are equipped to host 3.6 guests.
Egmont Airbnb Booking Patterns (2026): Available vs. Booked Days
Available Days Distribution
Booked Days Distribution
Booking Pattern Insights for Egmont
- The most common availability pattern in Egmont falls within the 271-366 days range, representing 75% of listings. This suggests many properties have significant open periods on their calendars.
- Approximately 87.5% of listings show high availability (181+ days open annually), indicating potential for increased bookings or specific owner usage patterns.
- For booked days, the 1-30 days range is most frequent in Egmont (41.7%), reflecting common guest stay durations or potential owner blocking patterns.
- A notable 12.5% of properties secure long booking periods (181+ days booked per year), highlighting successful long-term rental strategies or significant owner usage.
Egmont Airbnb Minimum Stay Requirements Analysis
Distribution of Listings by Minimum Night Requirement
1 Night
2 listings
8.3% of total
2 Nights
8 listings
33.3% of total
3 Nights
4 listings
16.7% of total
4-6 Nights
5 listings
20.8% of total
7-29 Nights
1 listings
4.2% of total
30+ Nights
4 listings
16.7% of total
Key Insights
- The most prevalent minimum stay requirement in Egmont is 2 Nights, adopted by 33.3% of listings. This highlights the market's preference for shorter, flexible bookings.
- A significant segment (16.7%) caters to monthly stays (30+ nights) in Egmont, pointing to opportunities in the extended-stay market.
Recommendations
- Align with the market by considering a 2 Nights minimum stay, as 33.3% of Egmont hosts use this setting.
- If feasible, allowing 1-night stays, especially midweek or during low season, could capture last-minute bookings, as only 8.3% currently do.
- A 2-night minimum appears standard (33.3%). Consider this for weekends or peak periods.
- Explore offering discounts for stays of 30+ nights to attract the 16.7% of the market seeking extended stays.
- Adjust minimum nights based on seasonality – potentially shorter during low season and longer during peak demand periods in Egmont.
Egmont Airbnb Cancellation Policy Trends Analysis (2026)
Super Strict 30 Days
4 listings
16.7% of total
Super Strict 60 Days
1 listings
4.2% of total
Flexible
3 listings
12.5% of total
Moderate
4 listings
16.7% of total
Firm
4 listings
16.7% of total
Strict
8 listings
33.3% of total
Cancellation Policy Insights for Egmont
- The prevailing Airbnb cancellation policy trend in Egmont is Strict, used by 33.3% of listings.
- There's a relatively balanced mix between guest-friendly (29.2%) and stricter (50.0%) policies, offering choices for different guest needs.
Recommendations for Hosts
- Consider adopting a Strict policy to align with the 33.3% market standard in Egmont.
- With 33.3% using Strict terms, this is a viable option in Egmont, particularly for high-value properties or during peak demand periods.
- Regularly review your cancellation policy against competitors and market demand shifts in Egmont.
Egmont STR Booking Lead Time Analysis (2026)
Average Booking Lead Time by Month
Booking Lead Time Insights for Egmont
- The overall average booking lead time for vacation rentals in Egmont is 41 days.
- Guests book furthest in advance for stays during August (average 80 days), likely coinciding with peak travel demand or local events.
- The shortest booking windows occur for stays in June (average 14 days), indicating more last-minute travel plans during this time.
- Seasonally, Fall (57 days avg.) sees the longest lead times, while Spring (37 days avg.) has the shortest, reflecting typical travel planning cycles.
Recommendations for Hosts
- Use the overall average lead time (41 days) as a baseline for your pricing and availability strategy in Egmont.
- For August stays, consider implementing length-of-stay discounts or slightly higher rates for bookings made less than 80 days out to capitalize on advance planning.
- During June, focus on last-minute booking availability and promotions, as guests book with very short notice (14 days avg.).
- Target marketing efforts for the Fall season well in advance (at least 57 days) to capture early planners.
- Monitor your own booking lead times against these Egmont averages to identify opportunities for dynamic pricing adjustments.
Popular & Essential Airbnb Amenities in Egmont (2026)
Amenity Prevalence
Amenity Insights for Egmont
- Essential amenities in Egmont that guests expect include: Free parking on premises, Wifi, Hot water, Kitchen. Lacking these (any) could significantly impact bookings.
- Popular amenities like Essentials, Air conditioning, Dishes and silverware are common but not universal. Offering these can provide a competitive edge.
Recommendations for Hosts
- Ensure your listing includes all essential amenities for Egmont: Free parking on premises, Wifi, Hot water, Kitchen.
- Prioritize adding missing essentials: Hot water, Kitchen.
- Consider adding popular differentiators like Essentials or Air conditioning to increase appeal.
- Highlight unique or less common amenities you offer (e.g., hot tub, dedicated workspace, EV charger) in your listing description and photos.
- Regularly check competitor amenities in Egmont to stay competitive.
Egmont Airbnb Guest Demographics & Profile Analysis (2026)
Guest Profile Summary for Egmont
- The typical guest profile for Airbnb in Egmont consists of predominantly international visitors (94%), with top international origins including United Kingdom, typically belonging to the Post-2000s (Gen Z/Alpha) group (50%), primarily speaking English or Spanish.
- Domestic travelers account for 5.9% of guests.
- Key international markets include United States (58.8%) and United Kingdom (19.6%).
- Top languages spoken are English (63.6%) followed by Spanish (15.2%).
- A significant demographic segment is the Post-2000s (Gen Z/Alpha) group, representing 50% of guests.
Recommendations for Hosts
- Focus marketing internationally, particularly towards travelers from United Kingdom.
- Tailor amenities and listing descriptions to appeal to the dominant Post-2000s (Gen Z/Alpha) demographic (e.g., highlight fast WiFi, smart home features, local guides).
- Highlight unique local experiences or amenities relevant to the primary guest profile.
- Consider seasonal promotions aligned with peak travel times for key origin markets.
Nearby Short-Term Rental Market Comparison
How does the Egmont Airbnb market stack up against its neighbors? Compare key performance metrics like average monthly revenue, ADR, and occupancy rates in surrounding areas to understand the broader regional STR landscape.
| Market | Active Properties | Monthly Revenue | Daily Rate | Avg. Occupancy |
|---|---|---|---|---|
| Westerhall Point | 10 | $4,431 | $483.83 | 38% |
| Belvedere | 13 | $3,156 | $238.08 | 52% |
| Soufrière | 121 | $2,909 | $261.54 | 44% |
| Coolie Town | 99 | $2,812 | $330.98 | 37% |
| Piaye | 17 | $2,761 | $208.00 | 41% |
| Mount Irvine | 14 | $2,573 | $322.13 | 36% |
| Buccoo | 102 | $1,916 | $213.50 | 34% |
| Scarborough | 154 | $1,807 | $248.32 | 29% |
| Old Grange | 21 | $1,798 | $261.29 | 32% |
| Crown Point | 187 | $1,727 | $186.93 | 34% |