Apikia Airbnb Market Analysis 2025: Short Term Rental Data & Vacation Rental Statistics in Aegean, Greece
Is Airbnb profitable in Apikia in 2025? Explore comprehensive Airbnb analytics for Apikia, Aegean, Greece to uncover income potential. This 2025 STR market report for Apikia, based on AirROI data from June 2024 to May 2025, reveals key trends in the niche market of 18 active listings.
Whether you're considering an Airbnb investment in Apikia, optimizing your existing vacation rental, or exploring rental arbitrage opportunities, understanding the Apikia Airbnb data is crucial. Navigating the high regulation landscape is key to maximizing your short term rental income potential. Let's dive into the specifics.
Key Apikia Airbnb Performance Metrics Overview
Monthly Airbnb Revenue Variations & Income Potential in Apikia (2025)
Understanding the monthly revenue variations for Airbnb listings in Apikia is key to maximizing your short term rental income potential. Seasonality significantly impacts earnings. Our analysis, based on data from the past 12 months, shows that the peak revenue month for STRs in Apikia is typically August, while March often presents the lowest earnings, highlighting opportunities for strategic pricing adjustments during shoulder and low seasons. Explore the typical Airbnb income in Apikia across different performance tiers:
- Best-in-class properties (Top 10%) achieve $1,220+ monthly, often utilizing dynamic pricing and superior guest experiences.
- Strong performing properties (Top 25%) earn $841 or more, indicating effective management and desirable locations/amenities.
- Typical properties (Median) generate around $574 per month, representing the average market performance.
- Entry-level properties (Bottom 25%) see earnings around $334, often with potential for optimization.
Average Monthly Airbnb Earnings Trend in Apikia
Apikia Airbnb Occupancy Rate Trends (2025)
Maximize your bookings by understanding the Apikia STR occupancy trends. Seasonal demand shifts significantly influence how often properties are booked. Typically, Augustsees the highest demand (peak season occupancy), while March experiences the lowest (low season). Effective strategies, like adjusting minimum stays or offering promotions, can boost occupancy during slower periods. Here's how different property tiers perform in Apikia:
- Best-in-class properties (Top 10%) achieve 44%+ occupancy, indicating high desirability and potentially optimized availability.
- Strong performing properties (Top 25%) maintain 30% or higher occupancy, suggesting good market fit and guest satisfaction.
- Typical properties (Median) have an occupancy rate around 20%.
- Entry-level properties (Bottom 25%) average 12% occupancy, potentially facing higher vacancy.
Average Monthly Occupancy Rate Trend in Apikia
Average Daily Rate (ADR) Airbnb Trends in Apikia (2025)
Effective short term rental pricing strategy in Apikia involves understanding monthly ADR fluctuations. The Average Daily Rate (ADR) for Airbnb in Apikia typically peaks in August and dips lowest during January. Leveraging Airbnb dynamic pricing tools or strategies based on this seasonality can significantly boost revenue. Here's a look at the typical nightly rates achieved:
- Best-in-class properties (Top 10%) command rates of $172+ per night, often due to premium features or locations.
- Strong performing properties (Top 25%) achieve nightly rates of $119 or more.
- Typical properties (Median) charge around $80 per night.
- Entry-level properties (Bottom 25%) earn around $67 per night.
Average Daily Rate (ADR) Trend by Month in Apikia
Get Live Apikia Market Intelligence 👇

Explore Real-time Analytics
Airbnb Seasonality Analysis & Trends in Apikia (2025)
Peak Season (August, July, June)
- Revenue averages $1,233 per month
- Occupancy rates average 35.8%
- Daily rates average $109
Shoulder Season
- Revenue averages $467 per month
- Occupancy maintains around 19.7%
- Daily rates hold near $98
Low Season (February, March, November)
- Revenue drops to average $40 per month
- Occupancy decreases to average 1.1%
- Daily rates adjust to average $96
Seasonality Insights for Apikia
- The Airbnb seasonality in Apikia shows highly seasonal trends requiring careful strategy. While the sections above show seasonal averages, it's also insightful to look at the extremes:
- During the high season, the absolute peak month showcases Apikia's highest earning potential, with monthly revenues capable of climbing to $1,880, occupancy reaching a high of 57.9%, and ADRs peaking at $112.
- Conversely, the slowest single month of the year, typically falling within the low season, marks the market's lowest point. In this month, revenue might dip to $0, occupancy could drop to 0.0%, and ADRs may adjust down to $89.
- Understanding both the seasonal averages and these monthly peaks and troughs in revenue, occupancy, and ADR is crucial for maximizing your Airbnb profit potential in Apikia.
Seasonal Strategies for Maximizing Profit
- Peak Season: Maximize revenue through premium pricing and potentially longer minimum stays. Ensure high availability.
- Low Season: Offer competitive pricing, special promotions (e.g., extended stay discounts), and flexible cancellation policies. Target off-season travelers like remote workers or budget-conscious guests.
- Shoulder Seasons: Implement dynamic pricing that balances peak and low rates. Target weekend travelers or specific events. Offer slightly more flexible terms than peak season.
- Regularly analyze your own performance against these Apikia seasonality benchmarks and adjust your pricing and availability strategy accordingly.
Best Areas for Airbnb Investment in Apikia (2025)
Exploring the top neighborhoods for short-term rentals in Apikia? This section highlights key areas, outlining why they are attractive for hosts and guests, along with notable local attractions. Consider these locations based on your target guest profile and investment strategy.
| Neighborhood / Area | Why Host Here? (Target Guests & Appeal) | Key Attractions & Landmarks |
|---|---|---|
| Chora Apikia | The main village of Apikia, known for its traditional architecture and rich history. It offers a blend of culture, local cuisine, and beautiful landscapes, attracting visitors seeking an authentic Greek experience. | The Archaeological Museum, Local tavernas, Traditional markets, Kea Island views |
| Apikia Springs | Famous for its natural mineral springs, Apikia Springs is a tranquil spot known for wellness and relaxation. Ideal for guests looking for a peaceful retreat and rejuvenation through nature. | Thermal Springs, Botanical gardens, Hiking trails, Picnic areas |
| Nearby beaches (Aegiali Beach) | Proximity to stunning beaches, making it a perfect spot for sunbathers and water sports enthusiasts. This area attracts tourists looking for seaside adventures and relaxation. | Aegiali Beach, Sunset views, Water sports activities, Beachfront restaurants |
| Ancient ruins of Kea | Close to historical sites and ruins, offering insights into Greece's ancient past. This attracts history buffs and travelers interested in cultural exploration. | Ancient temples, Historical artifacts, Archaeological sites |
| Breathtaking hiking trails | The area features numerous hiking trails leading to incredible views and landscapes. Popular among nature lovers and adventure seekers looking for outdoor activities. | Nature reserves, Panoramic viewpoints, Wildlife sightings |
| Local wineries | The region is known for its wineries, offering tastings and tours. This attracts food and drink enthusiasts looking to explore local flavors. | Wine tastings, Vineyard tours, Culinary events |
| Cultural festivals | Apikia hosts various cultural events and festivals throughout the year, attracting visitors interested in local traditions and celebrations. | Local fairs, Cultural exhibitions, Traditional music and dance |
| Gastronomic experiences | The area is rich in culinary offerings, from local taverns to gourmet dining. It's a draw for food lovers looking to experience authentic Greek cuisine. | Traditional Greek restaurants, Cooking classes, Food markets |
Understanding Airbnb License Requirements & STR Laws in Apikia (2025)
Yes, Apikia, Aegean, Greece enforces high STR regulations. Obtaining a license and ensuring compliance is almost certainly required according to current 2025 STR laws. Always verify the latest short term rental regulations and Airbnb license requirements directly with local government authorities for Apikia to ensure full compliance before hosting.
(Source: AirROI data, 2025, based on 67% licensed listings)
Top Performing Airbnb Properties in Apikia (2025)
Benchmark your potential! Explore examples of top-performing Airbnb properties in Apikiabased on Trailing Twelve Month (TTM) revenue. Analyze their characteristics, revenue, occupancy rate, and ADR to understand what drives success in this market.
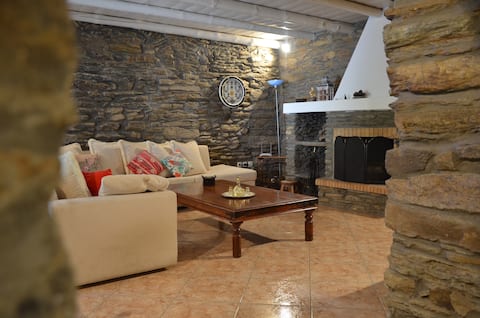
Stone House
Entire Place • 1 bedroom

Irene's House
Entire Place • 2 bedrooms
Karastamati's Tower House
Entire Place • 2 bedrooms

Charming Foodies House in Apoikia-Sariza Village
Entire Place • 2 bedrooms

Apoikia Cottage small house in nature.
Entire Place • 1 bedroom
"Konaki" Hikers Lodge by Andros Routes
Entire Place • 1 bedroom
Note: Performance varies based on location, size, amenities, seasonality, and management quality. Data reflects the past 12 months.
Top Performing Airbnb Hosts in Apikia (2025)
Learn from the best! This table showcases top-performing Airbnb hosts in Apikia based on the number of properties managed and estimated total revenue over the past year. Analyze their scale and performance metrics.
| Host Name | Properties | Grossing Revenue | Stay Reviews | Avg Rating |
|---|---|---|---|---|
| Dora | 2 | $13,503 | 59 | 4.98/5.0 |
| Eirini | 2 | $13,066 | 66 | 4.92/5.0 |
| Eirini | 1 | $11,417 | 6 | 5.00/5.0 |
| Zacharias | 2 | $8,426 | 4 | 5.00/5.0 |
| Ειρηνη | 1 | $7,426 | 11 | 4.91/5.0 |
| Nikos | 5 | $6,623 | 8 | 4.83/5.0 |
| Andros Routes | 1 | $6,171 | 24 | 4.75/5.0 |
| Lena | 1 | $4,828 | 7 | 5.00/5.0 |
| Ιωάννης | 2 | $1,780 | 10 | 4.90/5.0 |
| Host #457585687 | 1 | $991 | 0 | N/A/5.0 |
Analyzing the strategies of top hosts, such as their property selection, pricing, and guest communication, can offer valuable lessons for optimizing your own Airbnb operations in Apikia.
Dive Deeper: Advanced Apikia STR Market Data (2025)
Ready to unlock more insights? AirROI provides access to advanced metrics and comprehensive Airbnb data for Apikia. Explore detailed analytics beyond this report to refine your investment strategy, optimize pricing, and maximize your vacation rental profits.
Explore Advanced MetricsApikia Short-Term Rental Market Composition (2025): Property & Room Types
Room Type Distribution
Property Type Distribution
Market Composition Insights for Apikia
- The Apikia Airbnb market composition is heavily skewed towards Entire Home/Apt listings, which make up 94.4% of the 18 active rentals. This indicates strong guest preference for privacy and space.
- Looking at the property type distribution in Apikia, House properties are the most common (55.6%), reflecting the local real estate landscape.
- Houses represent a significant 55.6% portion, catering likely to families or larger groups.
- The presence of 5.6% Hotel/Boutique listings indicates integration with traditional hospitality.
Apikia Airbnb Room Capacity Analysis (2025): Bedroom Distribution
Distribution of Listings by Number of Bedrooms
Room Capacity Insights for Apikia
- The dominant room capacity in Apikia is 1 bedroom listings, making up 50% of the market. This suggests a strong demand for properties suitable for couples or solo travelers.
- Together, 1 bedroom and 2 bedrooms properties represent 94.4% of the active Airbnb listings in Apikia, indicating a high concentration in these sizes.
- Listings with 3+ bedrooms (5.6%) represent a smaller niche, potentially indicating an underserved market for larger group accommodations in Apikia.
Apikia Vacation Rental Guest Capacity Trends (2025)
Distribution of Listings by Guest Capacity
Guest Capacity Insights for Apikia
- The most common guest capacity trend in Apikia vacation rentals is listings accommodating 4 guests (44.4%). This suggests the primary traveler segment is likely small families or groups.
- Properties designed for 4 guests and 3 guests dominate the Apikia STR market, accounting for 66.6% of listings.
- 22.3% of properties accommodate 6+ guests, serving the market segment for larger families or group travel in Apikia.
- On average, properties in Apikia are equipped to host 4.1 guests.
Apikia Airbnb Booking Patterns (2025): Available vs. Booked Days
Available Days Distribution
Booked Days Distribution
Booking Pattern Insights for Apikia
- The most common availability pattern in Apikia falls within the 271-366 days range, representing 94.4% of listings. This suggests many properties have significant open periods on their calendars.
- Approximately 100.0% of listings show high availability (181+ days open annually), indicating potential for increased bookings or specific owner usage patterns.
- For booked days, the 31-90 days range is most frequent in Apikia (55.6%), reflecting common guest stay durations or potential owner blocking patterns.
Apikia Airbnb Minimum Stay Requirements Analysis
Distribution of Listings by Minimum Night Requirement
1 Night
4 listings
22.2% of total
2 Nights
9 listings
50% of total
4-6 Nights
3 listings
16.7% of total
7-29 Nights
1 listings
5.6% of total
30+ Nights
1 listings
5.6% of total
Key Insights
- The most prevalent minimum stay requirement in Apikia is 2 Nights, adopted by 50% of listings. This highlights the market's preference for shorter, flexible bookings.
- A strong majority (72.2%) of the Apikia Airbnb data shows acceptance of very short stays (1-2 nights), indicating a dynamic, high-turnover market.
Recommendations
- Align with the market by considering a 2 Nights minimum stay, as 50% of Apikia hosts use this setting.
- If feasible, allowing 1-night stays, especially midweek or during low season, could capture last-minute bookings, as only 22.2% currently do.
- Explore offering discounts for stays of 30+ nights to attract the 5.6% of the market seeking extended stays.
- Adjust minimum nights based on seasonality – potentially shorter during low season and longer during peak demand periods in Apikia.
Apikia Airbnb Cancellation Policy Trends Analysis (2025)
Flexible
3 listings
20% of total
Moderate
4 listings
26.7% of total
Firm
5 listings
33.3% of total
Strict
3 listings
20% of total
Cancellation Policy Insights for Apikia
- The prevailing Airbnb cancellation policy trend in Apikia is Firm, used by 33.3% of listings.
- A majority (53.3%) of hosts in Apikia utilize Firm or Strict policies, indicating a market where hosts prioritize booking security.
Recommendations for Hosts
- Consider adopting a Firm policy to align with the 33.3% market standard in Apikia.
- Regularly review your cancellation policy against competitors and market demand shifts in Apikia.
Apikia STR Booking Lead Time Analysis (2025)
Average Booking Lead Time by Month
Booking Lead Time Insights for Apikia
- The overall average booking lead time for vacation rentals in Apikia is 51 days.
- Guests book furthest in advance for stays during October (average 114 days), likely coinciding with peak travel demand or local events.
- The shortest booking windows occur for stays in November (average 0 days), indicating more last-minute travel plans during this time.
- Seasonally, Fall (68 days avg.) sees the longest lead times, while Winter (1 days avg.) has the shortest, reflecting typical travel planning cycles.
Recommendations for Hosts
- Use the overall average lead time (51 days) as a baseline for your pricing and availability strategy in Apikia.
- For October stays, consider implementing length-of-stay discounts or slightly higher rates for bookings made less than 114 days out to capitalize on advance planning.
- During November, focus on last-minute booking availability and promotions, as guests book with very short notice (0 days avg.).
- Target marketing efforts for the Fall season well in advance (at least 68 days) to capture early planners.
- Monitor your own booking lead times against these Apikia averages to identify opportunities for dynamic pricing adjustments.
Popular & Essential Airbnb Amenities in Apikia (2025)
Amenity Prevalence
Amenity Insights for Apikia
- Essential amenities in Apikia that guests expect include: Wifi, Essentials. Lacking these (any) could significantly impact bookings.
- Popular amenities like Dishes and silverware, Hangers, Kitchen are common but not universal. Offering these can provide a competitive edge.
Recommendations for Hosts
- Ensure your listing includes all essential amenities for Apikia: Wifi, Essentials.
- Consider adding popular differentiators like Dishes and silverware or Hangers to increase appeal.
- Highlight unique or less common amenities you offer (e.g., hot tub, dedicated workspace, EV charger) in your listing description and photos.
- Regularly check competitor amenities in Apikia to stay competitive.
Apikia Airbnb Guest Demographics & Profile Analysis (2025)
Guest Profile Summary for Apikia
- The typical guest profile for Airbnb in Apikia consists of predominantly international visitors (72%), with top international origins including France, typically belonging to the Post-2000s (Gen Z/Alpha) group (50%), primarily speaking English or Greek.
- Domestic travelers account for 28.2% of guests.
- Key international markets include Greece (28.2%) and France (15.4%).
- Top languages spoken are English (37.5%) followed by Greek (18.8%).
- A significant demographic segment is the Post-2000s (Gen Z/Alpha) group, representing 50% of guests.
Recommendations for Hosts
- Focus marketing internationally, particularly towards travelers from France.
- Tailor amenities and listing descriptions to appeal to the dominant Post-2000s (Gen Z/Alpha) demographic (e.g., highlight fast WiFi, smart home features, local guides).
- Highlight unique local experiences or amenities relevant to the primary guest profile.
- Consider seasonal promotions aligned with peak travel times for key origin markets.
Nearby Short-Term Rental Market Comparison
How does the Apikia Airbnb market stack up against its neighbors? Compare key performance metrics like average monthly revenue, ADR, and occupancy rates in surrounding areas to understand the broader regional STR landscape.
| Market | Active Properties | Monthly Revenue | Daily Rate | Avg. Occupancy |
|---|---|---|---|---|
| Ia Municipal Unit | 760 | $4,214 | $460.41 | 45% |
| Agios Ioannis Diakoftis | 163 | $3,604 | $634.96 | 42% |
| Psarou | 122 | $3,373 | $774.47 | 40% |
| Faros Armenistis | 121 | $3,318 | $868.68 | 36% |
| Municipality of Mykonos | 345 | $3,031 | $707.70 | 36% |
| Ornos | 244 | $2,960 | $359.10 | 47% |
| Orkos | 86 | $2,943 | $377.84 | 48% |
| Plaka | 181 | $2,786 | $263.99 | 58% |
| Pollonia | 120 | $2,740 | $281.30 | 58% |
| Platys Gialos | 232 | $2,729 | $440.81 | 44% |