Kwabenya Airbnb Market Analysis 2025: Short Term Rental Data & Vacation Rental Statistics in Greater Accra Region, Ghana
Is Airbnb profitable in Kwabenya in 2025? Explore comprehensive Airbnb analytics for Kwabenya, Greater Accra Region, Ghana to uncover income potential. This 2025 STR market report for Kwabenya, based on AirROI data from November 2024 to October 2025, reveals key trends in the niche market of 19 active listings.
Whether you're considering an Airbnb investment in Kwabenya, optimizing your existing vacation rental, or exploring rental arbitrage opportunities, understanding the Kwabenya Airbnb data is crucial. Leveraging the low regulation environment is key to maximizing your short term rental income potential. Let's dive into the specifics.
Key Kwabenya Airbnb Performance Metrics Overview
Monthly Airbnb Revenue Variations & Income Potential in Kwabenya (2025)
Understanding the monthly revenue variations for Airbnb listings in Kwabenya is key to maximizing your short term rental income potential. Seasonality significantly impacts earnings. Our analysis, based on data from the past 12 months, shows that the peak revenue month for STRs in Kwabenya is typically December, while October often presents the lowest earnings, highlighting opportunities for strategic pricing adjustments during shoulder and low seasons. Explore the typical Airbnb income in Kwabenya across different performance tiers:
- Best-in-class properties (Top 10%) achieve $960+ monthly, often utilizing dynamic pricing and superior guest experiences.
- Strong performing properties (Top 25%) earn $764 or more, indicating effective management and desirable locations/amenities.
- Typical properties (Median) generate around $344 per month, representing the average market performance.
- Entry-level properties (Bottom 25%) see earnings around $190, often with potential for optimization.
Average Monthly Airbnb Earnings Trend in Kwabenya
Kwabenya Airbnb Occupancy Rate Trends (2025)
Maximize your bookings by understanding the Kwabenya STR occupancy trends. Seasonal demand shifts significantly influence how often properties are booked. Typically, Aprilsees the highest demand (peak season occupancy), while October experiences the lowest (low season). Effective strategies, like adjusting minimum stays or offering promotions, can boost occupancy during slower periods. Here's how different property tiers perform in Kwabenya:
- Best-in-class properties (Top 10%) achieve 62%+ occupancy, indicating high desirability and potentially optimized availability.
- Strong performing properties (Top 25%) maintain 48% or higher occupancy, suggesting good market fit and guest satisfaction.
- Typical properties (Median) have an occupancy rate around 30%.
- Entry-level properties (Bottom 25%) average 16% occupancy, potentially facing higher vacancy.
Average Monthly Occupancy Rate Trend in Kwabenya
Average Daily Rate (ADR) Airbnb Trends in Kwabenya (2025)
Effective short term rental pricing strategy in Kwabenya involves understanding monthly ADR fluctuations. The Average Daily Rate (ADR) for Airbnb in Kwabenya typically peaks in August and dips lowest during April. Leveraging Airbnb dynamic pricing tools or strategies based on this seasonality can significantly boost revenue. Here's a look at the typical nightly rates achieved:
- Best-in-class properties (Top 10%) command rates of $113+ per night, often due to premium features or locations.
- Strong performing properties (Top 25%) achieve nightly rates of $76 or more.
- Typical properties (Median) charge around $50 per night.
- Entry-level properties (Bottom 25%) earn around $34 per night.
Average Daily Rate (ADR) Trend by Month in Kwabenya
Get Live Kwabenya Market Intelligence 👇

Explore Real-time Analytics
Airbnb Seasonality Analysis & Trends in Kwabenya (2025)
Peak Season (December, July, April)
- Revenue averages $712 per month
- Occupancy rates average 48.2%
- Daily rates average $57
Shoulder Season
- Revenue averages $462 per month
- Occupancy maintains around 32.5%
- Daily rates hold near $58
Low Season (May, October, November)
- Revenue drops to average $281 per month
- Occupancy decreases to average 22.6%
- Daily rates adjust to average $58
Seasonality Insights for Kwabenya
- The Airbnb seasonality in Kwabenya shows highly seasonal trends requiring careful strategy. While the sections above show seasonal averages, it's also insightful to look at the extremes:
- During the high season, the absolute peak month showcases Kwabenya's highest earning potential, with monthly revenues capable of climbing to $764, occupancy reaching a high of 57.1%, and ADRs peaking at $59.
- Conversely, the slowest single month of the year, typically falling within the low season, marks the market's lowest point. In this month, revenue might dip to $179, occupancy could drop to 13.8%, and ADRs may adjust down to $57.
- Understanding both the seasonal averages and these monthly peaks and troughs in revenue, occupancy, and ADR is crucial for maximizing your Airbnb profit potential in Kwabenya.
Seasonal Strategies for Maximizing Profit
- Peak Season: Maximize revenue through premium pricing and potentially longer minimum stays. Ensure high availability.
- Low Season: Offer competitive pricing, special promotions (e.g., extended stay discounts), and flexible cancellation policies. Target off-season travelers like remote workers or budget-conscious guests.
- Shoulder Seasons: Implement dynamic pricing that balances peak and low rates. Target weekend travelers or specific events. Offer slightly more flexible terms than peak season.
- Regularly analyze your own performance against these Kwabenya seasonality benchmarks and adjust your pricing and availability strategy accordingly.
Best Areas for Airbnb Investment in Kwabenya (2025)
Exploring the top neighborhoods for short-term rentals in Kwabenya? This section highlights key areas, outlining why they are attractive for hosts and guests, along with notable local attractions. Consider these locations based on your target guest profile and investment strategy.
| Neighborhood / Area | Why Host Here? (Target Guests & Appeal) | Key Attractions & Landmarks |
|---|---|---|
| Kwabenya Central | Conveniently located near major roadways, making it accessible from various parts of Accra. Attracts both business and leisure travelers. | Kwabenya Market, Achimota Retail Centre, Frafraha Gardens, Legon Botanical Gardens, Accra Mall |
| Abokobi | A serene environment that offers a mix of urban and rural vibes. Ideal for those looking to escape the hustle and bustle of city life while still being close to Accra's amenities. | Abokobi Church, Gimpa College, University of Ghana, Local food markets, Nature trails |
| Madina | A bustling commercial area with a high volume of visitors, making it a prime spot for short-term rentals. Close to shopping, dining, and entertainment options. | Madina Market, Bawaleshie Total Filling Station, Lucky Plaza, Local restaurants, Community parks |
| Ashongman | A developing residential area with growing infrastructure. It offers a mix of family-friendly neighborhoods and modern amenities. | Ashongman Local Market, Community centers, Newly developed parks, Shopping complexes, Local eateries |
| North Legon | Close proximity to the University of Ghana and various educational institutions, making it an excellent choice for student housing and visiting academics. | University of Ghana, Legon Botanical Gardens, Shops and cafes near the university, Educational institutions |
| Pokuase | A gateway to the northern suburbs of Accra, with a blend of rural charm and urban convenience. Great for families and long-term guests. | Pokuase Market, Local farms, Community parks, Transport connections, Cultural events |
| Dome | Historically rich area that offers both residential and commercial opportunities. It's well-known for its proximity to schools and other essential services. | Dome Market, Schools, Churches, Local shops, Parks |
| Tetteh Quarshie | A vibrant neighborhood known for its bustling markets and access to transportation hubs, making it a prime location for visitors to explore Accra. | Tetteh Quarshie Interchange, Local restaurants, Shopping areas, Cultural sites, Public transport access |
Understanding Airbnb License Requirements & STR Laws in Kwabenya (2025)
While Kwabenya, Greater Accra Region, Ghana currently shows low STR regulations, specific Airbnb license requirements might still exist or change. Always verify the latest short term rental regulations and Airbnb license requirements directly with local government authorities for Kwabenya to ensure full compliance before hosting.
(Source: AirROI data, 2025, based on 5% licensed listings)
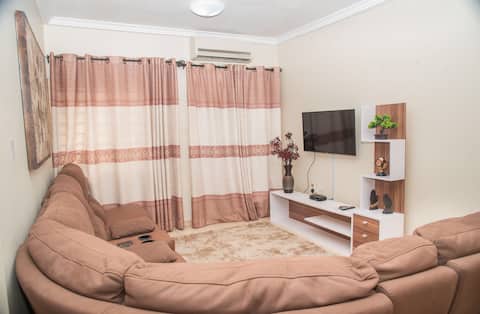
Top Performing Airbnb Properties in Kwabenya (2025)
Benchmark your potential! Explore examples of top-performing Airbnb properties in Kwabenyabased on Trailing Twelve Month (TTM) revenue. Analyze their characteristics, revenue, occupancy rate, and ADR to understand what drives success in this market.

Luxury 2-Bedroom Flat
Entire Place • 2 bedrooms

2 Bedrooms, backup power, unlimited WiFi
Entire Place • 2 bedrooms
2 bedroom in Regimanuel Estate “Balloon Gate”
Entire Place • 2 bedrooms

Micasa on the hill two bedrooms with back up Power
Entire Place • 2 bedrooms

Cosy1 Bedroom home
Private Room • N/A

2 Bedroom Apartment at Balloon Gate, Kwabenya
Entire Place • 2 bedrooms
Note: Performance varies based on location, size, amenities, seasonality, and management quality. Data reflects the past 12 months.
Top Performing Airbnb Hosts in Kwabenya (2025)
Learn from the best! This table showcases top-performing Airbnb hosts in Kwabenya based on the number of properties managed and estimated total revenue over the past year. Analyze their scale and performance metrics.
| Host Name | Properties | Grossing Revenue | Stay Reviews | Avg Rating |
|---|---|---|---|---|
| Gamel | 3 | $16,084 | 44 | 4.56/5.0 |
| Michael | 1 | $7,637 | 20 | 4.85/5.0 |
| Gabriel | 1 | $6,468 | 12 | 5.00/5.0 |
| Welbeck | 1 | $6,219 | 14 | 4.71/5.0 |
| Sydney | 2 | $4,383 | 22 | 4.71/5.0 |
| Solomon | 1 | $3,367 | 9 | 4.56/5.0 |
| Sophia | 1 | $3,246 | 11 | 5.00/5.0 |
| Solomon | 1 | $1,691 | 5 | 4.40/5.0 |
| Lisa | 1 | $1,470 | 9 | 5.00/5.0 |
| Akyeabea | 1 | $1,411 | 6 | 4.50/5.0 |
Analyzing the strategies of top hosts, such as their property selection, pricing, and guest communication, can offer valuable lessons for optimizing your own Airbnb operations in Kwabenya.
Dive Deeper: Advanced Kwabenya STR Market Data (2025)
Ready to unlock more insights? AirROI provides access to advanced metrics and comprehensive Airbnb data for Kwabenya. Explore detailed analytics beyond this report to refine your investment strategy, optimize pricing, and maximize your vacation rental profits.
Explore Advanced MetricsKwabenya Short-Term Rental Market Composition (2025): Property & Room Types
Room Type Distribution
Property Type Distribution
Market Composition Insights for Kwabenya
- The Kwabenya Airbnb market composition is heavily skewed towards Entire Home/Apt listings, which make up 73.7% of the 19 active rentals. This indicates strong guest preference for privacy and space.
- Looking at the property type distribution in Kwabenya, Apartment/Condo properties are the most common (57.9%), reflecting the local real estate landscape.
- Houses represent a significant 42.1% portion, catering likely to families or larger groups.
Kwabenya Airbnb Room Capacity Analysis (2025): Bedroom Distribution
Distribution of Listings by Number of Bedrooms
Room Capacity Insights for Kwabenya
- The dominant room capacity in Kwabenya is 2 bedrooms listings, making up 42.1% of the market. This suggests a strong demand for properties suitable for couples or solo travelers.
- Together, 2 bedrooms and 1 bedroom properties represent 63.2% of the active Airbnb listings in Kwabenya, indicating a high concentration in these sizes.
- A significant 21.0% of listings offer 3+ bedrooms, catering to larger groups and families seeking more space in Kwabenya.
Kwabenya Vacation Rental Guest Capacity Trends (2025)
Distribution of Listings by Guest Capacity
Guest Capacity Insights for Kwabenya
- The most common guest capacity trend in Kwabenya vacation rentals is listings accommodating 4 guests (31.6%). This suggests the primary traveler segment is likely small families or groups.
- Properties designed for 4 guests and 2 guests dominate the Kwabenya STR market, accounting for 57.9% of listings.
- 10.6% of properties accommodate 6+ guests, serving the market segment for larger families or group travel in Kwabenya.
- On average, properties in Kwabenya are equipped to host 3.0 guests.
Kwabenya Airbnb Booking Patterns (2025): Available vs. Booked Days
Available Days Distribution
Booked Days Distribution
Booking Pattern Insights for Kwabenya
- The most common availability pattern in Kwabenya falls within the 271-366 days range, representing 73.7% of listings. This suggests many properties have significant open periods on their calendars.
- Approximately 89.5% of listings show high availability (181+ days open annually), indicating potential for increased bookings or specific owner usage patterns.
- For booked days, the 1-30 days range is most frequent in Kwabenya (42.1%), reflecting common guest stay durations or potential owner blocking patterns.
- A notable 10.5% of properties secure long booking periods (181+ days booked per year), highlighting successful long-term rental strategies or significant owner usage.
Kwabenya Airbnb Minimum Stay Requirements Analysis
Distribution of Listings by Minimum Night Requirement
1 Night
13 listings
68.4% of total
3 Nights
2 listings
10.5% of total
7-29 Nights
1 listings
5.3% of total
30+ Nights
3 listings
15.8% of total
Key Insights
- The most prevalent minimum stay requirement in Kwabenya is 1 Night, adopted by 68.4% of listings. This highlights the market's preference for shorter, flexible bookings.
- A strong majority (68.4%) of the Kwabenya Airbnb data shows acceptance of very short stays (1-2 nights), indicating a dynamic, high-turnover market.
- A significant segment (15.8%) caters to monthly stays (30+ nights) in Kwabenya, pointing to opportunities in the extended-stay market.
Recommendations
- Align with the market by considering a 1 Night minimum stay, as 68.4% of Kwabenya hosts use this setting.
- Explore offering discounts for stays of 30+ nights to attract the 15.8% of the market seeking extended stays.
- Adjust minimum nights based on seasonality – potentially shorter during low season and longer during peak demand periods in Kwabenya.
Kwabenya Airbnb Cancellation Policy Trends Analysis (2025)
Flexible
13 listings
68.4% of total
Moderate
4 listings
21.1% of total
Firm
1 listings
5.3% of total
Strict
1 listings
5.3% of total
Cancellation Policy Insights for Kwabenya
- The prevailing Airbnb cancellation policy trend in Kwabenya is Flexible, used by 68.4% of listings.
- The market strongly favors guest-friendly terms, with 89.5% of listings offering Flexible or Moderate policies. This suggests guests in Kwabenya may expect booking flexibility.
- Strict cancellation policies are quite rare (5.3%), potentially making listings with this policy less competitive unless justified by high demand or property type.
Recommendations for Hosts
- Consider adopting a Flexible policy to align with the 68.4% market standard in Kwabenya.
- Given the high prevalence of Flexible policies (68.4%), offering this can enhance booking appeal, especially during shoulder seasons.
- Using a Strict policy might deter some guests, as only 5.3% of listings use it. Evaluate if potential revenue protection outweighs possible lower booking rates.
- Regularly review your cancellation policy against competitors and market demand shifts in Kwabenya.
Kwabenya STR Booking Lead Time Analysis (2025)
Average Booking Lead Time by Month
Booking Lead Time Insights for Kwabenya
- The overall average booking lead time for vacation rentals in Kwabenya is 20 days.
- Guests book furthest in advance for stays during August (average 45 days), likely coinciding with peak travel demand or local events.
- The shortest booking windows occur for stays in October (average 2 days), indicating more last-minute travel plans during this time.
- Seasonally, Summer (26 days avg.) sees the longest lead times, while Spring (16 days avg.) has the shortest, reflecting typical travel planning cycles.
Recommendations for Hosts
- Use the overall average lead time (20 days) as a baseline for your pricing and availability strategy in Kwabenya.
- For August stays, consider implementing length-of-stay discounts or slightly higher rates for bookings made less than 45 days out to capitalize on advance planning.
- During October, focus on last-minute booking availability and promotions, as guests book with very short notice (2 days avg.).
- Target marketing efforts for the Summer season well in advance (at least 26 days) to capture early planners.
- Monitor your own booking lead times against these Kwabenya averages to identify opportunities for dynamic pricing adjustments.
Popular & Essential Airbnb Amenities in Kwabenya (2025)
Amenity Prevalence
Amenity Insights for Kwabenya
- Essential amenities in Kwabenya that guests expect include: Kitchen, Free parking on premises, TV, Air conditioning. Lacking these (any) could significantly impact bookings.
- Popular amenities like Iron, Washer, Wifi are common but not universal. Offering these can provide a competitive edge.
- Warning: Wifi is not universally provided but is considered essential globally. Ensure reliable Wifi is offered.
Recommendations for Hosts
- Ensure your listing includes all essential amenities for Kwabenya: Kitchen, Free parking on premises, TV, Air conditioning.
- Consider adding popular differentiators like Iron or Washer to increase appeal.
- Highlight unique or less common amenities you offer (e.g., hot tub, dedicated workspace, EV charger) in your listing description and photos.
- Regularly check competitor amenities in Kwabenya to stay competitive.
Kwabenya Airbnb Guest Demographics & Profile Analysis (2025)
Guest Profile Summary for Kwabenya
- The typical guest profile for Airbnb in Kwabenya consists of predominantly international visitors (85%), with top international origins including Canada, typically belonging to the 1980s (Millennials) group (50%), primarily speaking English or Dutch.
- Domestic travelers account for 15.4% of guests.
- Key international markets include United States (46.2%) and Canada (15.4%).
- Top languages spoken are English (81.8%) followed by Dutch (18.2%).
- A significant demographic segment is the Post-2000s (Gen Z/Alpha) group, representing 50% of guests.
Recommendations for Hosts
- Focus marketing internationally, particularly towards travelers from Canada.
- Tailor amenities and listing descriptions to appeal to the dominant 1980s (Millennials) demographic (e.g., highlight fast WiFi, smart home features, local guides).
- Highlight unique local experiences or amenities relevant to the primary guest profile.
- Consider seasonal promotions aligned with peak travel times for key origin markets.
Nearby Short-Term Rental Market Comparison
How does the Kwabenya Airbnb market stack up against its neighbors? Compare key performance metrics like average monthly revenue, ADR, and occupancy rates in surrounding areas to understand the broader regional STR landscape.
| Market | Active Properties | Monthly Revenue | Daily Rate | Avg. Occupancy |
|---|---|---|---|---|
| Accra | 2,183 | $645 | $100.92 | 34% |
| East Legon Hills | 19 | $635 | $123.08 | 29% |
| Kasoa | 11 | $631 | $258.15 | 22% |
| Madina | 37 | $547 | $75.52 | 34% |
| Elmina | 12 | $529 | $119.70 | 22% |
| Haatso | 33 | $512 | $91.78 | 33% |
| Adenta | 30 | $469 | $48.63 | 35% |
| Abokobi | 18 | $448 | $64.19 | 35% |
| Adenta Municipal | 33 | $447 | $90.94 | 33% |
| Adenta Municipality | 28 | $413 | $69.62 | 37% |