Dome Airbnb Market Analysis 2025: Short Term Rental Data & Vacation Rental Statistics in Greater Accra Region, Ghana
Is Airbnb profitable in Dome in 2025? Explore comprehensive Airbnb analytics for Dome, Greater Accra Region, Ghana to uncover income potential. This 2025 STR market report for Dome, based on AirROI data from November 2024 to October 2025, reveals key trends in the niche market of 20 active listings.
Whether you're considering an Airbnb investment in Dome, optimizing your existing vacation rental, or exploring rental arbitrage opportunities, understanding the Dome Airbnb data is crucial. Leveraging the low regulation environment is key to maximizing your short term rental income potential. Let's dive into the specifics.
Key Dome Airbnb Performance Metrics Overview
Monthly Airbnb Revenue Variations & Income Potential in Dome (2025)
Understanding the monthly revenue variations for Airbnb listings in Dome is key to maximizing your short term rental income potential. Seasonality significantly impacts earnings. Our analysis, based on data from the past 12 months, shows that the peak revenue month for STRs in Dome is typically March, while October often presents the lowest earnings, highlighting opportunities for strategic pricing adjustments during shoulder and low seasons. Explore the typical Airbnb income in Dome across different performance tiers:
- Best-in-class properties (Top 10%) achieve $1,292+ monthly, often utilizing dynamic pricing and superior guest experiences.
- Strong performing properties (Top 25%) earn $704 or more, indicating effective management and desirable locations/amenities.
- Typical properties (Median) generate around $309 per month, representing the average market performance.
- Entry-level properties (Bottom 25%) see earnings around $192, often with potential for optimization.
Average Monthly Airbnb Earnings Trend in Dome
Dome Airbnb Occupancy Rate Trends (2025)
Maximize your bookings by understanding the Dome STR occupancy trends. Seasonal demand shifts significantly influence how often properties are booked. Typically, Marchsees the highest demand (peak season occupancy), while June experiences the lowest (low season). Effective strategies, like adjusting minimum stays or offering promotions, can boost occupancy during slower periods. Here's how different property tiers perform in Dome:
- Best-in-class properties (Top 10%) achieve 73%+ occupancy, indicating high desirability and potentially optimized availability.
- Strong performing properties (Top 25%) maintain 39% or higher occupancy, suggesting good market fit and guest satisfaction.
- Typical properties (Median) have an occupancy rate around 21%.
- Entry-level properties (Bottom 25%) average 12% occupancy, potentially facing higher vacancy.
Average Monthly Occupancy Rate Trend in Dome
Average Daily Rate (ADR) Airbnb Trends in Dome (2025)
Effective short term rental pricing strategy in Dome involves understanding monthly ADR fluctuations. The Average Daily Rate (ADR) for Airbnb in Dome typically peaks in June and dips lowest during April. Leveraging Airbnb dynamic pricing tools or strategies based on this seasonality can significantly boost revenue. Here's a look at the typical nightly rates achieved:
- Best-in-class properties (Top 10%) command rates of $113+ per night, often due to premium features or locations.
- Strong performing properties (Top 25%) achieve nightly rates of $85 or more.
- Typical properties (Median) charge around $60 per night.
- Entry-level properties (Bottom 25%) earn around $43 per night.
Average Daily Rate (ADR) Trend by Month in Dome
Get Live Dome Market Intelligence 👇

Explore Real-time Analytics
Airbnb Seasonality Analysis & Trends in Dome (2025)
Peak Season (March, December, November)
- Revenue averages $699 per month
- Occupancy rates average 36.4%
- Daily rates average $68
Shoulder Season
- Revenue averages $533 per month
- Occupancy maintains around 31.9%
- Daily rates hold near $68
Low Season (May, June, October)
- Revenue drops to average $363 per month
- Occupancy decreases to average 22.5%
- Daily rates adjust to average $69
Seasonality Insights for Dome
- The Airbnb seasonality in Dome shows highly seasonal trends requiring careful strategy. While the sections above show seasonal averages, it's also insightful to look at the extremes:
- During the high season, the absolute peak month showcases Dome's highest earning potential, with monthly revenues capable of climbing to $756, occupancy reaching a high of 45.1%, and ADRs peaking at $72.
- Conversely, the slowest single month of the year, typically falling within the low season, marks the market's lowest point. In this month, revenue might dip to $326, occupancy could drop to 20.4%, and ADRs may adjust down to $67.
- Understanding both the seasonal averages and these monthly peaks and troughs in revenue, occupancy, and ADR is crucial for maximizing your Airbnb profit potential in Dome.
Seasonal Strategies for Maximizing Profit
- Peak Season: Maximize revenue through premium pricing and potentially longer minimum stays. Ensure high availability.
- Low Season: Offer competitive pricing, special promotions (e.g., extended stay discounts), and flexible cancellation policies. Target off-season travelers like remote workers or budget-conscious guests.
- Shoulder Seasons: Implement dynamic pricing that balances peak and low rates. Target weekend travelers or specific events. Offer slightly more flexible terms than peak season.
- Regularly analyze your own performance against these Dome seasonality benchmarks and adjust your pricing and availability strategy accordingly.
Best Areas for Airbnb Investment in Dome (2025)
Exploring the top neighborhoods for short-term rentals in Dome? This section highlights key areas, outlining why they are attractive for hosts and guests, along with notable local attractions. Consider these locations based on your target guest profile and investment strategy.
| Neighborhood / Area | Why Host Here? (Target Guests & Appeal) | Key Attractions & Landmarks |
|---|---|---|
| Accra Central | The bustling heart of Accra, known for its vibrant markets and business district. Ideal for tourists seeking authentic local experiences and easy access to attractions. | Kwame Nkrumah Mausoleum, Makola Market, Independence Arch, Black Star Square, Art Centre for National Culture |
| Labadi Beach | Famous for its scenic beaches and lively atmosphere, Labadi Beach attracts both locals and tourists looking for relaxation and water activities. | Labadi Beach, Labadi Beach Hotel, Horseback riding on the beach, Restaurants by the beach |
| Osu | A trendy neighborhood known for its nightlife, restaurants, and shopping. Popular among younger travelers and expatriates. | Oxford Street, Kwame Nkrumah memorial, Various bars and clubs, Shopping hubs |
| East Legon | An upscale residential area popular with expatriates, offering a range of high-quality housing and amenities. Great for business and family travelers. | Shops and restaurants, Amma's Kitchen, Bawjiase Market, Art Galleries |
| Tema | A developing port city with access to both industrial and leisure activities. Emerging as a destination for short-term rentals. | Tema Port, Sakumono Lagoon, East Legon Mall |
| Adabraka | A vibrant urban neighborhood with a combination of residential and business areas. Close to the city center, appealing to budget travelers. | Budget-friendly accommodations, Local eateries, Cultural experiences |
| Aburi | A serene mountain town known for its natural beauty and botanical gardens. Perfect for tourists looking to escape the city hustle. | Aburi Botanical Gardens, Mountain hikes, Cultural crafts |
| Kumasi | While not in Accra, it is a significant city in Ghana with cultural history and is increasingly gaining attention for its hospitality industry. | Kumasi Central Market, Manhyia Palace, Cultural sites, Craft villages |
Understanding Airbnb License Requirements & STR Laws in Dome (2025)
While Dome, Greater Accra Region, Ghana currently shows low STR regulations, specific Airbnb license requirements might still exist or change. Always verify the latest short term rental regulations and Airbnb license requirements directly with local government authorities for Dome to ensure full compliance before hosting.
(Source: AirROI data, 2025, finding no licensed listings among those analyzed)
Top Performing Airbnb Properties in Dome (2025)
Benchmark your potential! Explore examples of top-performing Airbnb properties in Domebased on Trailing Twelve Month (TTM) revenue. Analyze their characteristics, revenue, occupancy rate, and ADR to understand what drives success in this market.

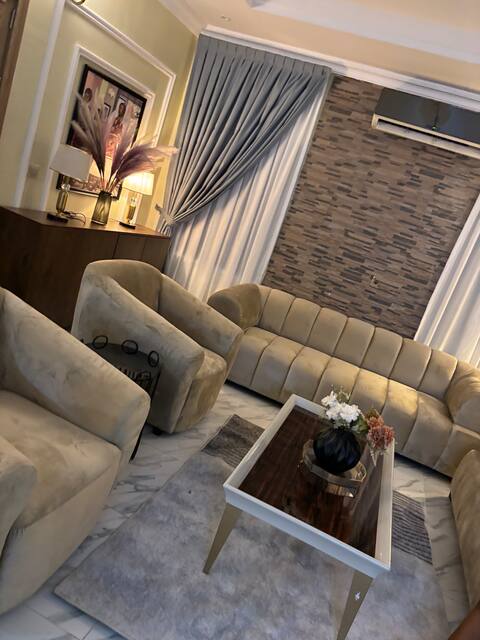
Cozy Bohemian suite
Entire Place • 1 bedroom

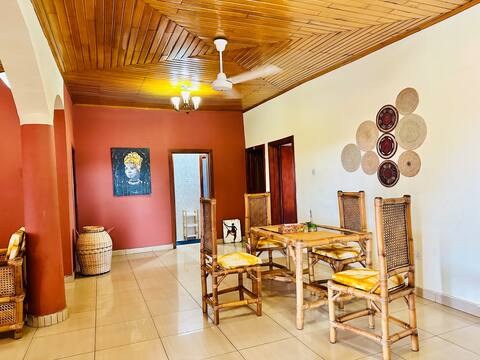
Secure and Affordable 3-bed home with free parking
Entire Place • 3 bedrooms
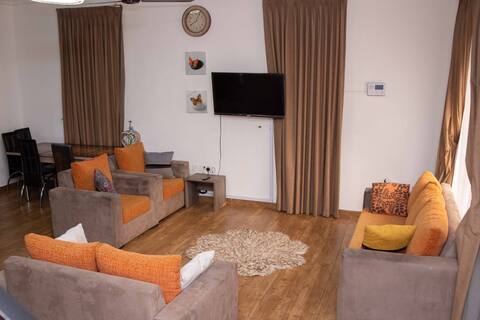
Lycia’s Vista
Entire Place • 3 bedrooms

Working From Home 1 Bedroom Apartment
Entire Place • 1 bedroom
Spacious 2 Bedroom Apt W/Balcony
Entire Place ��• 2 bedrooms
1-bedroom cozy home on a budget
Entire Place • 1 bedroom
Note: Performance varies based on location, size, amenities, seasonality, and management quality. Data reflects the past 12 months.
Top Performing Airbnb Hosts in Dome (2025)
Learn from the best! This table showcases top-performing Airbnb hosts in Dome based on the number of properties managed and estimated total revenue over the past year. Analyze their scale and performance metrics.
| Host Name | Properties | Grossing Revenue | Stay Reviews | Avg Rating |
|---|---|---|---|---|
| Lara | 1 | $11,316 | 14 | 4.43/5.0 |
| Stefanie | 3 | $11,118 | 30 | 4.58/5.0 |
| Ike | 4 | $6,222 | 28 | 4.76/5.0 |
| Osei | 1 | $4,740 | 1 | Not Rated |
| Jojo | 2 | $3,718 | 15 | 4.62/5.0 |
| Lwanga | 1 | $2,843 | 12 | 4.58/5.0 |
| Doris | 1 | $1,986 | 3 | 5.00/5.0 |
| Kd | 2 | $1,886 | 4 | 5.00/5.0 |
| Freda | 1 | $1,690 | 14 | 4.93/5.0 |
| Nana | 1 | $1,234 | 13 | 4.69/5.0 |
Analyzing the strategies of top hosts, such as their property selection, pricing, and guest communication, can offer valuable lessons for optimizing your own Airbnb operations in Dome.
Dive Deeper: Advanced Dome STR Market Data (2025)
Ready to unlock more insights? AirROI provides access to advanced metrics and comprehensive Airbnb data for Dome. Explore detailed analytics beyond this report to refine your investment strategy, optimize pricing, and maximize your vacation rental profits.
Explore Advanced MetricsDome Short-Term Rental Market Composition (2025): Property & Room Types
Room Type Distribution
Property Type Distribution
Market Composition Insights for Dome
- The Dome Airbnb market composition is heavily skewed towards Entire Home/Apt listings, which make up 90% of the 20 active rentals. This indicates strong guest preference for privacy and space.
- Looking at the property type distribution in Dome, Apartment/Condo properties are the most common (65%), reflecting the local real estate landscape.
- Houses represent a significant 35% portion, catering likely to families or larger groups.
Dome Airbnb Room Capacity Analysis (2025): Bedroom Distribution
Distribution of Listings by Number of Bedrooms
Room Capacity Insights for Dome
- The dominant room capacity in Dome is 2 bedrooms listings, making up 40% of the market. This suggests a strong demand for properties suitable for couples or solo travelers.
- Together, 2 bedrooms and 3 bedrooms properties represent 65.0% of the active Airbnb listings in Dome, indicating a high concentration in these sizes.
- A significant 25.0% of listings offer 3+ bedrooms, catering to larger groups and families seeking more space in Dome.
Dome Vacation Rental Guest Capacity Trends (2025)
Distribution of Listings by Guest Capacity
Guest Capacity Insights for Dome
- The most common guest capacity trend in Dome vacation rentals is listings accommodating 4 guests (35%). This suggests the primary traveler segment is likely small families or groups.
- Properties designed for 4 guests and 6 guests dominate the Dome STR market, accounting for 55.0% of listings.
- 20.0% of properties accommodate 6+ guests, serving the market segment for larger families or group travel in Dome.
- On average, properties in Dome are equipped to host 3.6 guests.
Dome Airbnb Booking Patterns (2025): Available vs. Booked Days
Available Days Distribution
Booked Days Distribution
Booking Pattern Insights for Dome
- The most common availability pattern in Dome falls within the 271-366 days range, representing 95% of listings. This suggests many properties have significant open periods on their calendars.
- Approximately 95.0% of listings show high availability (181+ days open annually), indicating potential for increased bookings or specific owner usage patterns.
- For booked days, the 1-30 days range is most frequent in Dome (60%), reflecting common guest stay durations or potential owner blocking patterns.
- A notable 5.0% of properties secure long booking periods (181+ days booked per year), highlighting successful long-term rental strategies or significant owner usage.
Dome Airbnb Minimum Stay Requirements Analysis
Distribution of Listings by Minimum Night Requirement
1 Night
11 listings
55% of total
2 Nights
1 listings
5% of total
3 Nights
2 listings
10% of total
4-6 Nights
2 listings
10% of total
7-29 Nights
3 listings
15% of total
30+ Nights
1 listings
5% of total
Key Insights
- The most prevalent minimum stay requirement in Dome is 1 Night, adopted by 55% of listings. This highlights the market's preference for shorter, flexible bookings.
Recommendations
- Align with the market by considering a 1 Night minimum stay, as 55% of Dome hosts use this setting.
- Adjust minimum nights based on seasonality – potentially shorter during low season and longer during peak demand periods in Dome.
Dome Airbnb Cancellation Policy Trends Analysis (2025)
Flexible
15 listings
75% of total
Moderate
1 listings
5% of total
Firm
3 listings
15% of total
Strict
1 listings
5% of total
Cancellation Policy Insights for Dome
- The prevailing Airbnb cancellation policy trend in Dome is Flexible, used by 75% of listings.
- The market strongly favors guest-friendly terms, with 80.0% of listings offering Flexible or Moderate policies. This suggests guests in Dome may expect booking flexibility.
- Strict cancellation policies are quite rare (5%), potentially making listings with this policy less competitive unless justified by high demand or property type.
Recommendations for Hosts
- Consider adopting a Flexible policy to align with the 75% market standard in Dome.
- Given the high prevalence of Flexible policies (75%), offering this can enhance booking appeal, especially during shoulder seasons.
- Using a Strict policy might deter some guests, as only 5% of listings use it. Evaluate if potential revenue protection outweighs possible lower booking rates.
- Regularly review your cancellation policy against competitors and market demand shifts in Dome.
Dome STR Booking Lead Time Analysis (2025)
Average Booking Lead Time by Month
Booking Lead Time Insights for Dome
- The overall average booking lead time for vacation rentals in Dome is 23 days.
- Guests book furthest in advance for stays during May (average 27 days), likely coinciding with peak travel demand or local events.
- The shortest booking windows occur for stays in March (average 4 days), indicating more last-minute travel plans during this time.
- Seasonally, Summer (19 days avg.) sees the longest lead times, while Fall (11 days avg.) has the shortest, reflecting typical travel planning cycles.
Recommendations for Hosts
- Use the overall average lead time (23 days) as a baseline for your pricing and availability strategy in Dome.
- During March, focus on last-minute booking availability and promotions, as guests book with very short notice (4 days avg.).
- Target marketing efforts for the Summer season well in advance (at least 19 days) to capture early planners.
- Monitor your own booking lead times against these Dome averages to identify opportunities for dynamic pricing adjustments.
Popular & Essential Airbnb Amenities in Dome (2025)
Amenity Prevalence
Amenity Insights for Dome
- Essential amenities in Dome that guests expect include: Wifi, Free parking on premises, Kitchen, TV, Dedicated workspace, Air conditioning. Lacking these (any) could significantly impact bookings.
- Popular amenities like Iron, Refrigerator, Dishes and silverware are common but not universal. Offering these can provide a competitive edge.
Recommendations for Hosts
- Ensure your listing includes all essential amenities for Dome: Wifi, Free parking on premises, Kitchen, TV, Dedicated workspace, Air conditioning.
- Prioritize adding missing essentials: TV, Dedicated workspace, Air conditioning.
- Consider adding popular differentiators like Iron or Refrigerator to increase appeal.
- Highlight unique or less common amenities you offer (e.g., hot tub, dedicated workspace, EV charger) in your listing description and photos.
- Regularly check competitor amenities in Dome to stay competitive.
Dome Airbnb Guest Demographics & Profile Analysis (2025)
Guest Profile Summary for Dome
- The typical guest profile for Airbnb in Dome consists of predominantly international visitors (88%), with top international origins including Ghana, typically belonging to the Post-2000s (Gen Z/Alpha) group (50%), primarily speaking English or French.
- Domestic travelers account for 12.5% of guests.
- Key international markets include United States (56.3%) and Ghana (12.5%).
- Top languages spoken are English (60%) followed by French (20%).
- A significant demographic segment is the Post-2000s (Gen Z/Alpha) group, representing 50% of guests.
Recommendations for Hosts
- Focus marketing internationally, particularly towards travelers from Ghana.
- Tailor amenities and listing descriptions to appeal to the dominant Post-2000s (Gen Z/Alpha) demographic (e.g., highlight fast WiFi, smart home features, local guides).
- Highlight unique local experiences or amenities relevant to the primary guest profile.
- Consider seasonal promotions aligned with peak travel times for key origin markets.
Nearby Short-Term Rental Market Comparison
How does the Dome Airbnb market stack up against its neighbors? Compare key performance metrics like average monthly revenue, ADR, and occupancy rates in surrounding areas to understand the broader regional STR landscape.
| Market | Active Properties | Monthly Revenue | Daily Rate | Avg. Occupancy |
|---|---|---|---|---|
| Accra | 2,183 | $645 | $100.92 | 34% |
| East Legon Hills | 19 | $635 | $123.08 | 29% |
| Kasoa | 11 | $631 | $258.15 | 22% |
| Madina | 37 | $547 | $75.52 | 34% |
| Elmina | 12 | $529 | $119.70 | 22% |
| Haatso | 33 | $512 | $91.78 | 33% |
| Adenta | 30 | $469 | $48.63 | 35% |
| Abokobi | 18 | $448 | $64.19 | 35% |
| Adenta Municipal | 33 | $447 | $90.94 | 33% |
| Adenta Municipality | 28 | $413 | $69.62 | 37% |