Accra Airbnb Market Analysis 2026: Short Term Rental Data & Vacation Rental Statistics in Greater Accra Region, Ghana
Is Airbnb profitable in Accra in 2026? Explore comprehensive Airbnb analytics for Accra, Greater Accra Region, Ghana to uncover income potential. This 2026 STR market report for Accra, based on AirROI data from February 2025 to January 2026, reveals key trends in the bustling market of 2,251 active listings.
Whether you're considering an Airbnb investment in Accra, optimizing your existing vacation rental, or exploring rental arbitrage opportunities, understanding the Accra Airbnb data is crucial. Leveraging the low regulation environment is key to maximizing your short term rental income potential. Let's dive into the specifics.
Key Accra Airbnb Performance Metrics Overview
Monthly Airbnb Revenue Variations & Income Potential in Accra (2026)
Understanding the monthly revenue variations for Airbnb listings in Accra is key to maximizing your short term rental income potential. Seasonality significantly impacts earnings. Our analysis, based on data from the past 12 months, shows that the peak revenue month for STRs in Accra is typically December, while May often presents the lowest earnings, highlighting opportunities for strategic pricing adjustments during shoulder and low seasons. Explore the typical Airbnb income in Accra across different performance tiers:
- Best-in-class properties (Top 10%) achieve $2,283+ monthly, often utilizing dynamic pricing and superior guest experiences.
- Strong performing properties (Top 25%) earn $1,479 or more, indicating effective management and desirable locations/amenities.
- Typical properties (Median) generate around $794 per month, representing the average market performance.
- Entry-level properties (Bottom 25%) see earnings around $339, often with potential for optimization.
Average Monthly Airbnb Earnings Trend in Accra
Accra Airbnb Occupancy Rate Trends (2026)
Maximize your bookings by understanding the Accra STR occupancy trends. Seasonal demand shifts significantly influence how often properties are booked. Typically, Aprilsees the highest demand (peak season occupancy), while January experiences the lowest (low season). Effective strategies, like adjusting minimum stays or offering promotions, can boost occupancy during slower periods. Here's how different property tiers perform in Accra:
- Best-in-class properties (Top 10%) achieve 79%+ occupancy, indicating high desirability and potentially optimized availability.
- Strong performing properties (Top 25%) maintain 60% or higher occupancy, suggesting good market fit and guest satisfaction.
- Typical properties (Median) have an occupancy rate around 34%.
- Entry-level properties (Bottom 25%) average 15% occupancy, potentially facing higher vacancy.
Average Monthly Occupancy Rate Trend in Accra
Average Daily Rate (ADR) Airbnb Trends in Accra (2026)
Effective short term rental pricing strategy in Accra involves understanding monthly ADR fluctuations. The Average Daily Rate (ADR) for Airbnb in Accra typically peaks in December and dips lowest during August. Leveraging Airbnb dynamic pricing tools or strategies based on this seasonality can significantly boost revenue. Here's a look at the typical nightly rates achieved:
- Best-in-class properties (Top 10%) command rates of $170+ per night, often due to premium features or locations.
- Strong performing properties (Top 25%) achieve nightly rates of $114 or more.
- Typical properties (Median) charge around $78 per night.
- Entry-level properties (Bottom 25%) earn around $51 per night.
Average Daily Rate (ADR) Trend by Month in Accra
Get Live Accra Market Intelligence 👇

Explore Real-time Analytics
Airbnb Seasonality Analysis & Trends in Accra (2026)
Peak Season (December, April, March)
- Revenue averages $1,230 per month
- Occupancy rates average 41.9%
- Daily rates average $99
Shoulder Season
- Revenue averages $1,084 per month
- Occupancy maintains around 39.8%
- Daily rates hold near $95
Low Season (January, May, June)
- Revenue drops to average $947 per month
- Occupancy decreases to average 33.8%
- Daily rates adjust to average $98
Seasonality Insights for Accra
- The Airbnb seasonality in Accra shows moderate seasonality with distinct peak and low periods. While the sections above show seasonal averages, it's also insightful to look at the extremes:
- During the high season, the absolute peak month showcases Accra's highest earning potential, with monthly revenues capable of climbing to $1,363, occupancy reaching a high of 42.8%, and ADRs peaking at $106.
- Conversely, the slowest single month of the year, typically falling within the low season, marks the market's lowest point. In this month, revenue might dip to $886, occupancy could drop to 32.5%, and ADRs may adjust down to $95.
- Understanding both the seasonal averages and these monthly peaks and troughs in revenue, occupancy, and ADR is crucial for maximizing your Airbnb profit potential in Accra.
Seasonal Strategies for Maximizing Profit
- Peak Season: Maximize revenue through premium pricing and potentially longer minimum stays. Ensure high availability.
- Low Season: Offer competitive pricing, special promotions (e.g., extended stay discounts), and flexible cancellation policies. Target off-season travelers like remote workers or budget-conscious guests.
- Shoulder Seasons: Implement dynamic pricing that balances peak and low rates. Target weekend travelers or specific events. Offer slightly more flexible terms than peak season.
- Regularly analyze your own performance against these Accra seasonality benchmarks and adjust your pricing and availability strategy accordingly.
Best Areas for Airbnb Investment in Accra (2026)
Exploring the top neighborhoods for short-term rentals in Accra? This section highlights key areas, outlining why they are attractive for hosts and guests, along with notable local attractions. Consider these locations based on your target guest profile and investment strategy.
| Neighborhood / Area | Why Host Here? (Target Guests & Appeal) | Key Attractions & Landmarks |
|---|---|---|
| Osu | Vibrant neighborhood known for its nightlife, shopping, and dining. It's also close to the beach, making it a popular destination for tourists. | Oxford Street, Kwame Nkrumah Memorial Park, Labadi Beach, Osu Castle, Legon Botanical Gardens, Local restaurants and bars |
| Labadi | Famous for its beautiful beach and a popular area for relaxation and entertainment. Attracts both locals and tourists for its beach activities. | Labadi Beach, Accra Arts Centre, Skybar25, Eden Tree, The Republic Bar and Grill |
| East Legon | A fast-developing area known for upscale living, restaurants, and proximity to several embassies. Ideal for business travelers and families. | Accra Mall, Lizzy Sports Complex, Legon Botanical Gardens, Local eateries, Nightlife spots |
| Airport Residential Area | An affluent neighborhood that is convenient for travelers due to its proximity to Kotoka International Airport. Popular with expatriates. | Kotoka International Airport, Air Force Museum, Local restaurants, Luxury hotels |
| Tema | A port city with industrial activities and a developing tourist scene. Offers unique attractions and leisure spots. | Tema Beach, Kakum National Park, Community 1 Market, Tema Harbor, Various leisure parks |
| Achimota | A residential area that combines tranquil living with easy access to larger commercial areas. Good for long-term rentals. | Achimota Mall, Achimota Forest, Local markets, Schools and educational institutions |
| Dzorwulu | A serene neighborhood with a mix of residential and commercial properties. Great for families and visitors looking for peace and quiet. | Local parks, Shopping centers, Cafes and restaurants |
| Teshie | A coastal community known for its laid-back lifestyle and beach access. Great for vacation rentals close to the water. | Teshie Beach, The Lighthouse, Various seafood restaurants, Local markets |
Understanding Airbnb License Requirements & STR Laws in Accra (2026)
While Accra, Greater Accra Region, Ghana currently shows low STR regulations, specific Airbnb license requirements might still exist or change. Always verify the latest short term rental regulations and Airbnb license requirements directly with local government authorities for Accra to ensure full compliance before hosting.
(Source: AirROI data, 2026, based on 1% licensed listings)
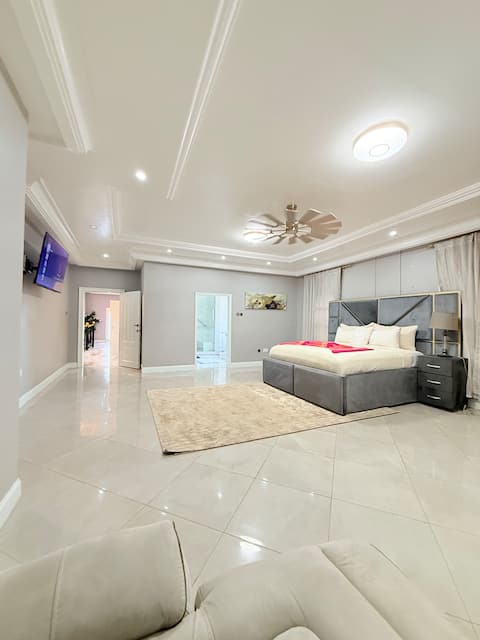
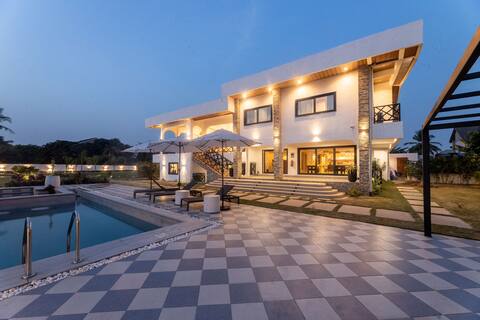
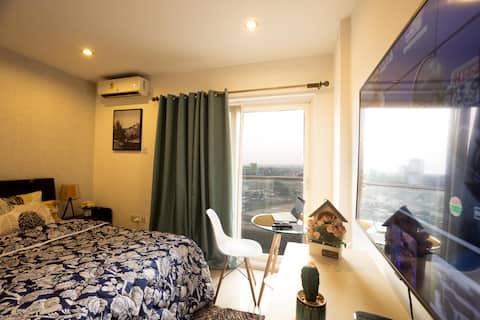
Top Performing Airbnb Properties in Accra (2026)
Benchmark your potential! Explore examples of top-performing Airbnb properties in Accrabased on Trailing Twelve Month (TTM) revenue. Analyze their characteristics, revenue, occupancy rate, and ADR to understand what drives success in this market.
Grand Jacuzz1 @ East Airport
Entire Place • 8 bedrooms
Massive Tranquil Urban Oasis
Entire Place • 13 bedrooms

Palms Garden Luxury 4bd/ba +pool +optional car
Entire Place • 4 bedrooms
Modern studio: 8th floor views close to Airport
Entire Place • 1 bedroom

3BR Penthouse • Rooftop Pool & Private Lift
Entire Place • 3 bedrooms

The Avery at Diamond in the City
Entire Place • 2 bedrooms
Note: Performance varies based on location, size, amenities, seasonality, and management quality. Data reflects the past 12 months.
Top Performing Airbnb Hosts in Accra (2026)
Learn from the best! This table showcases top-performing Airbnb hosts in Accra based on the number of properties managed and estimated total revenue over the past year. Analyze their scale and performance metrics.
| Host Name | Properties | Grossing Revenue | Stay Reviews | Avg Rating |
|---|---|---|---|---|
| Mohammad | 71 | $831,675 | 2455 | 4.59/5.0 |
| Enock | 46 | $576,571 | 3945 | 4.68/5.0 |
| Eliphaz | 75 | $566,168 | 1895 | 4.70/5.0 |
| Ms Priscy | 19 | $375,967 | 1745 | 4.92/5.0 |
| Brian Kwami | 21 | $280,097 | 736 | 4.68/5.0 |
| Ben | 23 | $275,396 | 994 | 4.74/5.0 |
| Pamela | 29 | $272,318 | 325 | 4.66/5.0 |
| Sylvia | 22 | $255,411 | 963 | 4.82/5.0 |
| Alex | 6 | $242,400 | 165 | 4.83/5.0 |
| Adnan | 15 | $240,718 | 893 | 4.90/5.0 |
Analyzing the strategies of top hosts, such as their property selection, pricing, and guest communication, can offer valuable lessons for optimizing your own Airbnb operations in Accra.
Dive Deeper: Advanced Accra STR Market Data (2026)
Ready to unlock more insights? AirROI provides access to advanced metrics and comprehensive Airbnb data for Accra. Explore detailed analytics beyond this report to refine your investment strategy, optimize pricing, and maximize your vacation rental profits.
Explore Advanced MetricsAccra Short-Term Rental Market Composition (2026): Property & Room Types
Room Type Distribution
Property Type Distribution
Market Composition Insights for Accra
- The Accra Airbnb market composition is heavily skewed towards Entire Home/Apt listings, which make up 87.5% of the 2,251 active rentals. This indicates strong guest preference for privacy and space.
- Looking at the property type distribution in Accra, Apartment/Condo properties are the most common (78.5%), reflecting the local real estate landscape.
- Houses represent a significant 17.9% portion, catering likely to families or larger groups.
- Smaller segments like hotel/boutique, others, outdoor/unique (combined 3.6%) offer potential for unique stay experiences.
Accra Airbnb Room Capacity Analysis (2026): Bedroom Distribution
Distribution of Listings by Number of Bedrooms
Room Capacity Insights for Accra
- The dominant room capacity in Accra is 1 bedroom listings, making up 45.6% of the market. This suggests a strong demand for properties suitable for couples or solo travelers.
- Together, 1 bedroom and 2 bedrooms properties represent 70.4% of the active Airbnb listings in Accra, indicating a high concentration in these sizes.
Accra Vacation Rental Guest Capacity Trends (2026)
Distribution of Listings by Guest Capacity
Guest Capacity Insights for Accra
- The most common guest capacity trend in Accra vacation rentals is listings accommodating 2 guests (47.7%). This suggests the primary traveler segment is likely couples or solo travelers.
- Properties designed for 2 guests and 4 guests dominate the Accra STR market, accounting for 70.4% of listings.
- A significant 48.8% of listings cater specifically to 1-2 guests, highlighting strong demand from couples and solo travelers in Accra.
- 13.5% of properties accommodate 6+ guests, serving the market segment for larger families or group travel in Accra.
- On average, properties in Accra are equipped to host 3.0 guests.
Accra Airbnb Booking Patterns (2026): Available vs. Booked Days
Available Days Distribution
Booked Days Distribution
Booking Pattern Insights for Accra
- The most common availability pattern in Accra falls within the 271-366 days range, representing 64.7% of listings. This suggests many properties have significant open periods on their calendars.
- Approximately 86.9% of listings show high availability (181+ days open annually), indicating potential for increased bookings or specific owner usage patterns.
- For booked days, the 1-30 days range is most frequent in Accra (35.4%), reflecting common guest stay durations or potential owner blocking patterns.
- A notable 13.8% of properties secure long booking periods (181+ days booked per year), highlighting successful long-term rental strategies or significant owner usage.
Accra Airbnb Minimum Stay Requirements Analysis
Distribution of Listings by Minimum Night Requirement
1 Night
998 listings
44.3% of total
2 Nights
389 listings
17.3% of total
3 Nights
182 listings
8.1% of total
4-6 Nights
92 listings
4.1% of total
7-29 Nights
34 listings
1.5% of total
30+ Nights
556 listings
24.7% of total
Key Insights
- The most prevalent minimum stay requirement in Accra is 1 Night, adopted by 44.3% of listings. This highlights the market's preference for shorter, flexible bookings.
- A strong majority (61.6%) of the Accra Airbnb data shows acceptance of very short stays (1-2 nights), indicating a dynamic, high-turnover market.
- A significant segment (24.7%) caters to monthly stays (30+ nights) in Accra, pointing to opportunities in the extended-stay market.
Recommendations
- Align with the market by considering a 1 Night minimum stay, as 44.3% of Accra hosts use this setting.
- Explore offering discounts for stays of 30+ nights to attract the 24.7% of the market seeking extended stays.
- Adjust minimum nights based on seasonality – potentially shorter during low season and longer during peak demand periods in Accra.
Accra Airbnb Cancellation Policy Trends Analysis (2026)
Super Strict 60 Days
11 listings
0.5% of total
Limited
43 listings
1.9% of total
Flexible
1119 listings
49.9% of total
Moderate
665 listings
29.7% of total
Firm
338 listings
15.1% of total
Strict
66 listings
2.9% of total
Cancellation Policy Insights for Accra
- The prevailing Airbnb cancellation policy trend in Accra is Flexible, used by 49.9% of listings.
- The market strongly favors guest-friendly terms, with 79.6% of listings offering Flexible or Moderate policies. This suggests guests in Accra may expect booking flexibility.
- Strict cancellation policies are quite rare (2.9%), potentially making listings with this policy less competitive unless justified by high demand or property type.
Recommendations for Hosts
- Consider adopting a Flexible policy to align with the 49.9% market standard in Accra.
- Using a Strict policy might deter some guests, as only 2.9% of listings use it. Evaluate if potential revenue protection outweighs possible lower booking rates.
- Regularly review your cancellation policy against competitors and market demand shifts in Accra.
Accra STR Booking Lead Time Analysis (2026)
Average Booking Lead Time by Month
Booking Lead Time Insights for Accra
- The overall average booking lead time for vacation rentals in Accra is 27 days.
- Guests book furthest in advance for stays during December (average 49 days), likely coinciding with peak travel demand or local events.
- The shortest booking windows occur for stays in February (average 17 days), indicating more last-minute travel plans during this time.
- Seasonally, Winter (32 days avg.) sees the longest lead times, while Spring (21 days avg.) has the shortest, reflecting typical travel planning cycles.
Recommendations for Hosts
- Use the overall average lead time (27 days) as a baseline for your pricing and availability strategy in Accra.
- For December stays, consider implementing length-of-stay discounts or slightly higher rates for bookings made less than 49 days out to capitalize on advance planning.
- Target marketing efforts for the Winter season well in advance (at least 32 days) to capture early planners.
- Monitor your own booking lead times against these Accra averages to identify opportunities for dynamic pricing adjustments.
Popular & Essential Airbnb Amenities in Accra (2026)
Amenity Prevalence
Amenity Insights for Accra
- Essential amenities in Accra that guests expect include: Air conditioning, Wifi, TV. Lacking these (any) could significantly impact bookings.
- Popular amenities like Free parking on premises, Kitchen, Washer are common but not universal. Offering these can provide a competitive edge.
Recommendations for Hosts
- Ensure your listing includes all essential amenities for Accra: Air conditioning, Wifi, TV.
- Prioritize adding missing essentials: Air conditioning, Wifi, TV.
- Consider adding popular differentiators like Free parking on premises or Kitchen to increase appeal.
- Highlight unique or less common amenities you offer (e.g., hot tub, dedicated workspace, EV charger) in your listing description and photos.
- Regularly check competitor amenities in Accra to stay competitive.
Accra Airbnb Guest Demographics & Profile Analysis (2026)
Guest Profile Summary for Accra
- The typical guest profile for Airbnb in Accra consists of predominantly international visitors (87%), with top international origins including United Kingdom, typically belonging to the Post-2000s (Gen Z/Alpha) group (50%), primarily speaking English or French.
- Domestic travelers account for 13.1% of guests.
- Key international markets include United States (38.5%) and United Kingdom (16.3%).
- Top languages spoken are English (60.6%) followed by French (13.8%).
- A significant demographic segment is the Post-2000s (Gen Z/Alpha) group, representing 50% of guests.
Recommendations for Hosts
- Focus marketing internationally, particularly towards travelers from United Kingdom.
- Tailor amenities and listing descriptions to appeal to the dominant Post-2000s (Gen Z/Alpha) demographic (e.g., highlight fast WiFi, smart home features, local guides).
- Highlight unique local experiences or amenities relevant to the primary guest profile.
- Consider seasonal promotions aligned with peak travel times for key origin markets.
Nearby Short-Term Rental Market Comparison
How does the Accra Airbnb market stack up against its neighbors? Compare key performance metrics like average monthly revenue, ADR, and occupancy rates in surrounding areas to understand the broader regional STR landscape.