Stromberg Airbnb Market Analysis 2025: Short Term Rental Data & Vacation Rental Statistics in Rhineland-Palatinate, Germany
Is Airbnb profitable in Stromberg in 2025? Explore comprehensive Airbnb analytics for Stromberg, Rhineland-Palatinate, Germany to uncover income potential. This 2025 STR market report for Stromberg, based on AirROI data from June 2024 to May 2025, reveals key trends in the niche market of 18 active listings.
Whether you're considering an Airbnb investment in Stromberg, optimizing your existing vacation rental, or exploring rental arbitrage opportunities, understanding the Stromberg Airbnb data is crucial. Leveraging the low regulation environment is key to maximizing your short term rental income potential. Let's dive into the specifics.
Key Stromberg Airbnb Performance Metrics Overview
Monthly Airbnb Revenue Variations & Income Potential in Stromberg (2025)
Understanding the monthly revenue variations for Airbnb listings in Stromberg is key to maximizing your short term rental income potential. Seasonality significantly impacts earnings. Our analysis, based on data from the past 12 months, shows that the peak revenue month for STRs in Stromberg is typically November, while February often presents the lowest earnings, highlighting opportunities for strategic pricing adjustments during shoulder and low seasons. Explore the typical Airbnb income in Stromberg across different performance tiers:
- Best-in-class properties (Top 10%) achieve $3,495+ monthly, often utilizing dynamic pricing and superior guest experiences.
- Strong performing properties (Top 25%) earn $2,554 or more, indicating effective management and desirable locations/amenities.
- Typical properties (Median) generate around $1,411 per month, representing the average market performance.
- Entry-level properties (Bottom 25%) see earnings around $696, often with potential for optimization.
Average Monthly Airbnb Earnings Trend in Stromberg
Stromberg Airbnb Occupancy Rate Trends (2025)
Maximize your bookings by understanding the Stromberg STR occupancy trends. Seasonal demand shifts significantly influence how often properties are booked. Typically, Augustsees the highest demand (peak season occupancy), while October experiences the lowest (low season). Effective strategies, like adjusting minimum stays or offering promotions, can boost occupancy during slower periods. Here's how different property tiers perform in Stromberg:
- Best-in-class properties (Top 10%) achieve 76%+ occupancy, indicating high desirability and potentially optimized availability.
- Strong performing properties (Top 25%) maintain 59% or higher occupancy, suggesting good market fit and guest satisfaction.
- Typical properties (Median) have an occupancy rate around 34%.
- Entry-level properties (Bottom 25%) average 18% occupancy, potentially facing higher vacancy.
Average Monthly Occupancy Rate Trend in Stromberg
Average Daily Rate (ADR) Airbnb Trends in Stromberg (2025)
Effective short term rental pricing strategy in Stromberg involves understanding monthly ADR fluctuations. The Average Daily Rate (ADR) for Airbnb in Stromberg typically peaks in May and dips lowest during December. Leveraging Airbnb dynamic pricing tools or strategies based on this seasonality can significantly boost revenue. Here's a look at the typical nightly rates achieved:
- Best-in-class properties (Top 10%) command rates of $215+ per night, often due to premium features or locations.
- Strong performing properties (Top 25%) achieve nightly rates of $147 or more.
- Typical properties (Median) charge around $105 per night.
- Entry-level properties (Bottom 25%) earn around $86 per night.
Average Daily Rate (ADR) Trend by Month in Stromberg
Get Live Stromberg Market Intelligence 👇

Explore Real-time Analytics
Airbnb Seasonality Analysis & Trends in Stromberg (2025)
Peak Season (November, March, January)
- Revenue averages $3,358 per month
- Occupancy rates average 38.2%
- Daily rates average $156
Shoulder Season
- Revenue averages $2,594 per month
- Occupancy maintains around 45.0%
- Daily rates hold near $150
Low Season (February, June, September)
- Revenue drops to average $1,520 per month
- Occupancy decreases to average 36.7%
- Daily rates adjust to average $148
Seasonality Insights for Stromberg
- The Airbnb seasonality in Stromberg shows highly seasonal trends requiring careful strategy. While the sections above show seasonal averages, it's also insightful to look at the extremes:
- During the high season, the absolute peak month showcases Stromberg's highest earning potential, with monthly revenues capable of climbing to $3,579, occupancy reaching a high of 55.1%, and ADRs peaking at $169.
- Conversely, the slowest single month of the year, typically falling within the low season, marks the market's lowest point. In this month, revenue might dip to $961, occupancy could drop to 30.9%, and ADRs may adjust down to $140.
- Understanding both the seasonal averages and these monthly peaks and troughs in revenue, occupancy, and ADR is crucial for maximizing your Airbnb profit potential in Stromberg.
Seasonal Strategies for Maximizing Profit
- Peak Season: Maximize revenue through premium pricing and potentially longer minimum stays. Ensure high availability.
- Low Season: Offer competitive pricing, special promotions (e.g., extended stay discounts), and flexible cancellation policies. Target off-season travelers like remote workers or budget-conscious guests.
- Shoulder Seasons: Implement dynamic pricing that balances peak and low rates. Target weekend travelers or specific events. Offer slightly more flexible terms than peak season.
- Regularly analyze your own performance against these Stromberg seasonality benchmarks and adjust your pricing and availability strategy accordingly.
Best Areas for Airbnb Investment in Stromberg (2025)
Exploring the top neighborhoods for short-term rentals in Stromberg? This section highlights key areas, outlining why they are attractive for hosts and guests, along with notable local attractions. Consider these locations based on your target guest profile and investment strategy.
| Neighborhood / Area | Why Host Here? (Target Guests & Appeal) | Key Attractions & Landmarks |
|---|---|---|
| Stromberg Old Town | Charming medieval town with picturesque streets and historic architecture. Ideal for guests seeking a quiet retreat with easy access to hiking trails and nature. | Stromberg Castle, St. Mary’s Church, local wine taverns, nature walks, local festivals |
| Binger Wald Nature Park | A beautiful natural area surrounding Stromberg, perfect for outdoor activities and relaxation. Attracts nature lovers and families looking for weekend getaways. | Hiking trails, Bird watching, Picnic areas, Natural scenery, Outdoor sports |
| Rheinsteig Trail | Part of one of Germany’s premier long-distance hiking paths, it draws outdoor enthusiasts and walkers, making it a popular area for Airbnb hosts. | Scenic views of the Rhine River, Associated villages along the trail, Historical landmarks, Cultural excursions |
| Bad Kreuznach | A nearby spa town famous for its healing springs and wellness options. Attracts guests seeking relaxation and therapeutic experiences. | Thermal baths, Kurhaus, Old Bridge, Spa gardens, Wine tasting |
| Niederhausen | Located near popular wine-growing regions, this area is great for vineyard tours and wine enthusiasts. | Vineyard tours, Wine tasting events, Local wine festivals, Scenic views over vineyards, Cycling paths |
| Rüdesheim am Rhein | Famous for its wine and fairy-tale landscapes along the Rhine, this town attracts tourists looking for cultural experiences and scenic views. | Drosselgasse, Wine vineyards, Rhine River cruises, Cable cars with views, Bridges and castles |
| Bad Salzig | Close to the Rhine, this small town offers tranquil surroundings and access to outdoor activities, appealing to those looking for a peaceful retreat. | Cycling trails, Riverside walks, Local historical sites, Nature parks, Quiet cafes |
| Hunsrück National Park | A major nature reserve that offers hiking, wildlife, and beautiful landscapes, perfect for nature enthusiasts looking to escape the city. | Diverse fauna and flora, Hiking paths, Scenic viewpoints, Educational visitor centers, Wildlife watching |
Understanding Airbnb License Requirements & STR Laws in Stromberg (2025)
While Stromberg, Rhineland-Palatinate, Germany currently shows low STR regulations, specific Airbnb license requirements might still exist or change. Always verify the latest short term rental regulations and Airbnb license requirements directly with local government authorities for Stromberg to ensure full compliance before hosting.
(Source: AirROI data, 2025, finding no licensed listings among those analyzed)
Top Performing Airbnb Properties in Stromberg (2025)
Benchmark your potential! Explore examples of top-performing Airbnb properties in Strombergbased on Trailing Twelve Month (TTM) revenue. Analyze their characteristics, revenue, occupancy rate, and ADR to understand what drives success in this market.
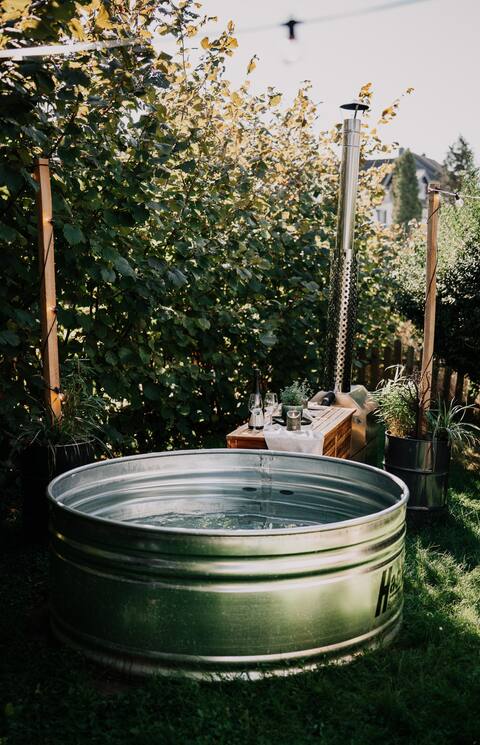
Soonwald Haus I Hot Tube I Whirlpool I Kamin
Entire Place • 4 bedrooms
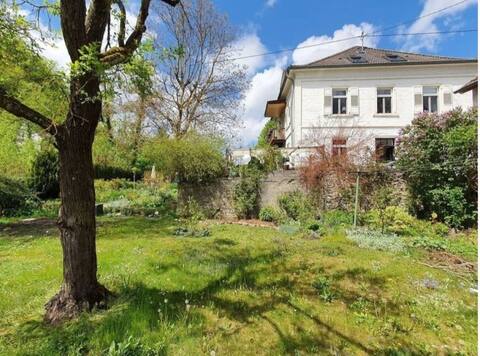
Villa Adelinde
Entire Place • 2 bedrooms
Soonwald Apartment I Hot Tube I Kamin I Garten
Entire Place • 2 bedrooms
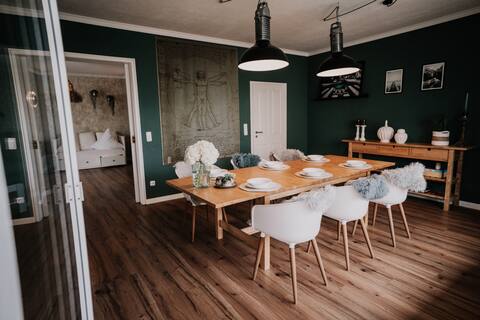
Charming professional working room in Stromberg old town
Entire Place • 2 bedrooms
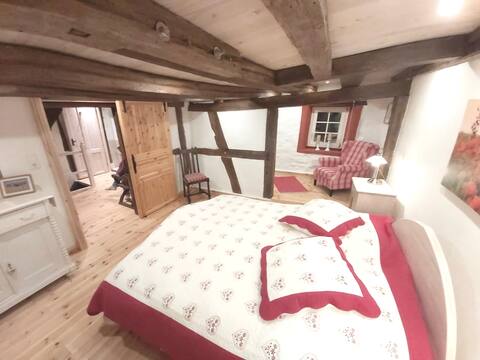
Ferienhaus "Leonidas"
Entire Place • 1 bedroom
Soonwald Studio I Whirlpool I Terrasse I Garten
Entire Place • 1 bedroom
Note: Performance varies based on location, size, amenities, seasonality, and management quality. Data reflects the past 12 months.
Top Performing Airbnb Hosts in Stromberg (2025)
Learn from the best! This table showcases top-performing Airbnb hosts in Stromberg based on the number of properties managed and estimated total revenue over the past year. Analyze their scale and performance metrics.
| Host Name | Properties | Grossing Revenue | Stay Reviews | Avg Rating |
|---|---|---|---|---|
| Jennifer | 4 | $226,576 | 42 | 4.83/5.0 |
| Isabelle | 1 | $30,475 | 24 | 5.00/5.0 |
| Dieter | 1 | $25,045 | 99 | 5.00/5.0 |
| Maria Und Nico | 1 | $24,594 | 62 | 4.92/5.0 |
| Ulrike | 1 | $16,246 | 68 | 4.85/5.0 |
| Ina | 1 | $15,027 | 9 | 5.00/5.0 |
| Mark | 1 | $14,290 | 19 | 4.79/5.0 |
| Gabriele | 2 | $13,646 | 29 | 4.97/5.0 |
| Heike | 1 | $7,191 | 8 | 5.00/5.0 |
| Detlef | 1 | $3,353 | 10 | 4.80/5.0 |
Analyzing the strategies of top hosts, such as their property selection, pricing, and guest communication, can offer valuable lessons for optimizing your own Airbnb operations in Stromberg.
Dive Deeper: Advanced Stromberg STR Market Data (2025)
Ready to unlock more insights? AirROI provides access to advanced metrics and comprehensive Airbnb data for Stromberg. Explore detailed analytics beyond this report to refine your investment strategy, optimize pricing, and maximize your vacation rental profits.
Explore Advanced MetricsStromberg Short-Term Rental Market Composition (2025): Property & Room Types
Room Type Distribution
Property Type Distribution
Market Composition Insights for Stromberg
- The Stromberg Airbnb market composition is heavily skewed towards Entire Home/Apt listings, which make up 88.9% of the 18 active rentals. This indicates strong guest preference for privacy and space.
- Looking at the property type distribution in Stromberg, House properties are the most common (55.6%), reflecting the local real estate landscape.
- Houses represent a significant 55.6% portion, catering likely to families or larger groups.
Stromberg Airbnb Room Capacity Analysis (2025): Bedroom Distribution
Distribution of Listings by Number of Bedrooms
Room Capacity Insights for Stromberg
- The dominant room capacity in Stromberg is 2 bedrooms listings, making up 55.6% of the market. This suggests a strong demand for properties suitable for couples or solo travelers.
- Together, 2 bedrooms and 1 bedroom properties represent 83.4% of the active Airbnb listings in Stromberg, indicating a high concentration in these sizes.
- Listings with 3+ bedrooms (5.6%) represent a smaller niche, potentially indicating an underserved market for larger group accommodations in Stromberg.
Stromberg Vacation Rental Guest Capacity Trends (2025)
Distribution of Listings by Guest Capacity
Guest Capacity Insights for Stromberg
- The most common guest capacity trend in Stromberg vacation rentals is listings accommodating 4 guests (38.9%). This suggests the primary traveler segment is likely small families or groups.
- Properties designed for 4 guests and 8+ guests dominate the Stromberg STR market, accounting for 55.6% of listings.
- 22.3% of properties accommodate 6+ guests, serving the market segment for larger families or group travel in Stromberg.
- On average, properties in Stromberg are equipped to host 4.1 guests.
Stromberg Airbnb Booking Patterns (2025): Available vs. Booked Days
Available Days Distribution
Booked Days Distribution
Booking Pattern Insights for Stromberg
- The most common availability pattern in Stromberg falls within the 271-366 days range, representing 44.4% of listings. This suggests many properties have significant open periods on their calendars.
- Approximately 72.2% of listings show high availability (181+ days open annually), indicating potential for increased bookings or specific owner usage patterns.
- For booked days, the 91-180 days range is most frequent in Stromberg (33.3%), reflecting common guest stay durations or potential owner blocking patterns.
- A notable 27.8% of properties secure long booking periods (181+ days booked per year), highlighting successful long-term rental strategies or significant owner usage.
Stromberg Airbnb Minimum Stay Requirements Analysis
Distribution of Listings by Minimum Night Requirement
1 Night
4 listings
23.5% of total
2 Nights
8 listings
47.1% of total
3 Nights
1 listings
5.9% of total
4-6 Nights
1 listings
5.9% of total
30+ Nights
3 listings
17.6% of total
Key Insights
- The most prevalent minimum stay requirement in Stromberg is 2 Nights, adopted by 47.1% of listings. This highlights the market's preference for shorter, flexible bookings.
- A strong majority (70.6%) of the Stromberg Airbnb data shows acceptance of very short stays (1-2 nights), indicating a dynamic, high-turnover market.
- A significant segment (17.6%) caters to monthly stays (30+ nights) in Stromberg, pointing to opportunities in the extended-stay market.
Recommendations
- Align with the market by considering a 2 Nights minimum stay, as 47.1% of Stromberg hosts use this setting.
- If feasible, allowing 1-night stays, especially midweek or during low season, could capture last-minute bookings, as only 23.5% currently do.
- Explore offering discounts for stays of 30+ nights to attract the 17.6% of the market seeking extended stays.
- Adjust minimum nights based on seasonality – potentially shorter during low season and longer during peak demand periods in Stromberg.
Stromberg Airbnb Cancellation Policy Trends Analysis (2025)
Super Strict 60 Days
1 listings
5.9% of total
Flexible
6 listings
35.3% of total
Moderate
3 listings
17.6% of total
Firm
2 listings
11.8% of total
Strict
5 listings
29.4% of total
Cancellation Policy Insights for Stromberg
- The prevailing Airbnb cancellation policy trend in Stromberg is Flexible, used by 35.3% of listings.
- There's a relatively balanced mix between guest-friendly (52.9%) and stricter (41.2%) policies, offering choices for different guest needs.
Recommendations for Hosts
- Consider adopting a Flexible policy to align with the 35.3% market standard in Stromberg.
- Regularly review your cancellation policy against competitors and market demand shifts in Stromberg.
Stromberg STR Booking Lead Time Analysis (2025)
Average Booking Lead Time by Month
Booking Lead Time Insights for Stromberg
- The overall average booking lead time for vacation rentals in Stromberg is 62 days.
- Guests book furthest in advance for stays during June (average 151 days), likely coinciding with peak travel demand or local events.
- The shortest booking windows occur for stays in January (average 26 days), indicating more last-minute travel plans during this time.
- Seasonally, Summer (94 days avg.) sees the longest lead times, while Winter (36 days avg.) has the shortest, reflecting typical travel planning cycles.
Recommendations for Hosts
- Use the overall average lead time (62 days) as a baseline for your pricing and availability strategy in Stromberg.
- For June stays, consider implementing length-of-stay discounts or slightly higher rates for bookings made less than 151 days out to capitalize on advance planning.
- Target marketing efforts for the Summer season well in advance (at least 94 days) to capture early planners.
- Monitor your own booking lead times against these Stromberg averages to identify opportunities for dynamic pricing adjustments.
Popular & Essential Airbnb Amenities in Stromberg (2025)
Amenity Prevalence
Amenity Insights for Stromberg
- Essential amenities in Stromberg that guests expect include: Wifi. Lacking these (this) could significantly impact bookings.
- Popular amenities like TV, Dishes and silverware, Heating are common but not universal. Offering these can provide a competitive edge.
Recommendations for Hosts
- Ensure your listing includes all essential amenities for Stromberg: Wifi.
- Consider adding popular differentiators like TV or Dishes and silverware to increase appeal.
- Highlight unique or less common amenities you offer (e.g., hot tub, dedicated workspace, EV charger) in your listing description and photos.
- Regularly check competitor amenities in Stromberg to stay competitive.
Stromberg Airbnb Guest Demographics & Profile Analysis (2025)
Guest Profile Summary for Stromberg
- The typical guest profile for Airbnb in Stromberg consists of a mix of domestic (59%) and international guests, often arriving from nearby Hamburg, typically belonging to the Post-2000s (Gen Z/Alpha) group (50%), primarily speaking English or German.
- Domestic travelers account for 58.6% of guests.
- Key international markets include Germany (58.6%) and Netherlands (17.2%).
- Top languages spoken are English (37.9%) followed by German (29.9%).
- A significant demographic segment is the Post-2000s (Gen Z/Alpha) group, representing 50% of guests.
Recommendations for Hosts
- Balance marketing efforts between domestic and international channels based on the guest mix.
- Tailor amenities and listing descriptions to appeal to the dominant Post-2000s (Gen Z/Alpha) demographic (e.g., highlight fast WiFi, smart home features, local guides).
- Highlight unique local experiences or amenities relevant to the primary guest profile.
- Consider seasonal promotions aligned with peak travel times for key origin markets.
Nearby Short-Term Rental Market Comparison
How does the Stromberg Airbnb market stack up against its neighbors? Compare key performance metrics like average monthly revenue, ADR, and occupancy rates in surrounding areas to understand the broader regional STR landscape.
| Market | Active Properties | Monthly Revenue | Daily Rate | Avg. Occupancy |
|---|---|---|---|---|
| Ittenheim | 21 | $3,491 | $235.70 | 42% |
| Kruft | 13 | $3,340 | $229.39 | 41% |
| Belmont | 12 | $3,303 | $282.76 | 39% |
| Furdenheim | 19 | $3,205 | $318.23 | 47% |
| Le Valtin | 17 | $3,002 | $321.67 | 39% |
| Hurtigheim | 10 | $2,867 | $202.90 | 43% |
| Ondenval | 11 | $2,787 | $235.48 | 42% |
| Unkel | 18 | $2,750 | $232.55 | 41% |
| Bütgenbach | 30 | $2,747 | $327.96 | 36% |
| Griesheim-près-Molsheim | 21 | $2,742 | $250.06 | 40% |